. 2014 Jun 19;157(7):1535-51.
doi: 10.1016/j.cell.2014.05.017.

Natural neural projection dynamics underlying social behavior

Affiliations

Natural neural projection dynamics underlying social behavior

Lisa A Gunaydin et al. Cell. .

Abstract

Social interaction is a complex behavior essential for many species and is impaired in major neuropsychiatric disorders. Pharmacological studies have implicated certain neurotransmitter systems in social behavior, but circuit-level understanding of endogenous neural activity during social interaction is lacking. We therefore developed and applied a new methodology, termed fiber photometry, to optically record natural neural activity in genetically and connectivity-defined projections to elucidate the real-time role of specified pathways in mammalian behavior. Fiber photometry revealed that activity dynamics of a ventral tegmental area (VTA)-to-nucleus accumbens (NAc) projection could encode and predict key features of social, but not novel object, interaction. Consistent with this observation, optogenetic control of cells specifically contributing to this projection was sufficient to modulate social behavior, which was mediated by type 1 dopamine receptor signaling downstream in the NAc. Direct observation of deep projection-specific activity in this way captures a fundamental and previously inaccessible dimension of mammalian circuit dynamics.


Figures

Figure 1
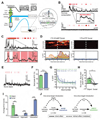
Figure 1. Fiber photometry of neural dynamics during social interaction
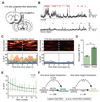
(A) Left: photometry setup. Light path for fluorescence excitation and emission is through a single 400µm fiberoptic implanted in VTA. Right: viral targeting of GCaMP5 to VTA-DA neurons. (B) Photometry traces from mice expressing eYFP (bottom) and GCaMP5.0 (top) in VTA during the sucrose lickometer test, showing robust increases in GCaMP fluorescence correlated with sucrose licking epochs (red dashes). dF/F represents change in fluorescence from median of the entire time-series. (C) Top: example trace of VTA-DA activity in social behavior. Red dashes: interaction bouts. Bottom: zoom-in of dashed interval relating VTA-DA GCaMP signal and social interaction (colored boxes). (D) Example heatmaps (top) and peri-event plots (bottom) aligned to start of interaction for mice expressing GCaMP (left) or eYFP (right). Heatmaps: warmer colors indicate higher fluorescence signal; peri-event plots: warmer colors represent earlier interaction bouts. (E) VTA-DA activity in novel object investigation. Red dashes: interaction bouts. (F) Average peak fluorescence over first ten interaction bouts (16.4% dF/F: social; 13.7% dF/F: novel object; n=10, Wilcoxon signed-rank test, p=0.5). (G) Signal changes across bouts: social (blue) and novel object (green). (H) Signal changes within bouts; novel object peak responses occur closer to interaction-bout end than do social peak responses (n=10 individual animals plotted, gray lines; difference of peaks over 0.5 s from bout-end and bout-start: −1.7% dF/F social vs. 9.7% dF/F novel object; Wilcoxon signed-rank test: p=0.0051). (I) Specific behaviors during 1 sec behavioral video clips centered around peak fluorescence within each bout. Peak during novel object investigation occurs predominantly in withdrawing from object (92%), while peak fluorescence during social interaction occurs in approach (14%) or active investigation (81%) (n=10 animals, 15 bouts/animal). (J) Directed-graph model of causal mediation analysis (Methods); while time-elapsed partially mediates effects of VTA-DA neuron activity on latency to social interaction only, the majority of effect was direct rather than mediated (74.0% average direct effect, 26.0% average indirect effect mediated by time elapsed; both p<0.0001). See also Figure S1.
Figure 2
Figure 2. VTA modulation of social behavior
(A) Injection of AAV5-DIO-ChR2 into VTA of TH::Cre mice. (B) Confocal image: ChR2-eYFP expression in VTA, colocalization with TH (blue). Scale bar: 100 µm. (C) In vivo anesthetized recording of light-evoked spikes from TH::Cre mouse: ChR2 in VTA. (D) Optical stimulation parameters for home cage interaction. For excitation, 473nm light was delivered in 30 Hz bursts (8 pulses, 5 ms each) every 5 seconds. For inhibition, continuous 591nm light was delivered. (E) Summary of light-evoked changes in social interaction after bidirectional control of DA neurons. Phasic stimulation of VTA cell bodies increased social interaction compared to eYFP (n=17 ChR2 and n=18 eYFP, LME model, t57=2.31, p=0.03), while inhibition of VTA cell bodies decreased interaction (n=10 eNpHR3.0 and n=15 eYFP, LME model, t57=−2.09, p=0.04). (F) Neither stimulation nor inhibition of VTA cell bodies significantly affected novel object interaction (p>0.05). See also Figure S2.
Figure 3
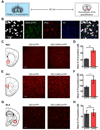
Figure 3. Downstream regions recruited by optogenetic VTA stimulation
(A) Animals were stimulated for 5 min (home-cage) and sacrificed 90 min later. (B) Confocal images: ChR2-eYFP in VTA-orginating fibers in NAc; induction of NAc cFos by VTA stimulation. White: DAPI nuclear stain, green: ChR2-eYFP, red: cFos, blue: anti-TH labeling of DA fibers. Scale bar: 25 µm. (C) Images of NAc medial shell from eYFP and ChR2 slices; increased cFos+ NAc cells in ChR2 brain following VTA stimulation. (D) cFos induction by VTA stimulation: NAc cFos increase in ChR2 compared to control (n=4 eYFP, n=4 ChR2; t-test, p=0.00006). (E) Images of PFC from eYFP control and ChR2 slices; increased cFos+ PFC cells in the ChR2 brain following VTA stimulation. (F) cFos induction by VTA stimulation: PFC cFos increase in ChR2 compared to control (n=4 eYFP, n=3 ChR2; t-test, p=0.002). (G) Images of BLA from eYFP and ChR2 slices; no change in cFos+ PFC cells in the ChR2 brain following VTA stimulation. (H) BLA cFos induction by VTA stimulation; no difference between ChR2 and control (n=4 eYFP, n=4 ChR2; t-test, p=0.82).
Figure 4
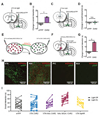
Figure 4. Projection-specific VTA control of social behavior
(A) ChR2 in VTA DA neurons and optical fiber implantation above NAc, targeting VTA-to-NAc projections. (B) Phasic stimulation of VTA-originating axons in NAc increased social interaction in ChR2 animals (purple) compared to controls (gray) (n=11 ChR2, n=12 eYFP; LME model, t30=7.11, p=0.039). (C) ChR2 expression in VTA DA neurons and optical fiber implantation above PFC, targeting VTA-to-PFC projections. (D) Phasic stimulation of VTA-originating axons in PFC had no effect on social interaction in ChR2 animals (blue) or controls (gray) (n=7/group; LME model, t12= 0.11, p=0.39). (E) Injection of mCherry-labeled WGA-Cre into NAc and Cre-dependent ChR2-eYFP into VTA of wild-type mice. WGA-Cre is trans-synaptically transported to all cells upstream of the NAc (orange arrow) but ChR2 expression is only activated in the subset of VTA neurons topologically defined by projections to medial NAc. (F) ChR2 in the subset of VTA neurons that project to medial NAc; optical fiber implantation above VTA. (G) Phasic stimulation of this subpopulation of VTA neurons increased social interaction in ChR2 animals (magenta) but not controls (gray) (n=14/group; LME model, t23=2.53, p=0.02). (H) Sparse but strong ChR2-eYFP expression in VTA using this dual-virus system. ChR2-eYFP labels VTA fibers in medial NAc where WGA-Cre virus was injected, with negligible labeling of PFC or BLA fibers. Scale bars: 100 µm. (I) Summary of bidirectional effects of VTA interventions in individual animals. Consistency of pro-social effects increased with ChR2 projection specificity, and optical inhibition of VTA decreased social interaction. Gray: eYFP controls, blue: VTA DA cell body stimulation, purple: VTA-NAc axonal stimulation, magenta: WGA-Cre-isolated VTA-NAc projection, yellow: VTA DA cell body inhibition with eNpHR3.0. See also Figure S3.
Figure 5
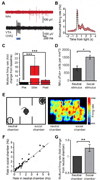
Figure 5. Electrophysiologic assessment in NAc of increased social behavior
(A) NAc activity (red) evoked by VTA stimulation (black). (B) PSTH: light-evoked increase in NAc firing with one burst of VTA stimulation. (C) Summary graph from (B): increase in NAc firing during/following a burst of light to VTA (Wilcoxon signed-rank test, p<0.001). (D) Increase in NAc cFos in un-implanted mice; social vs. neutral stimulus (wire mesh cup) (5 min, n=3/group; t-test, p=0.03). (E) Left: NAc activity in a freely moving animal exploring neutral and social environments. Right: heat map: firing rate of NAc neurons higher in social compared to neutral chamber. Warmer colors: higher firing rate. (F) Correlation of firing rate in social vs. neutral chamber for each multiunit recording site: note greater activity in social chamber (black dots: individual multiunit recording sites; dashed line: unity). (G) NAc spiking higher in social environment (Wilcoxon signed-rank test, p=0.025). See also Figure S4.
Figure 6
Figure 6. Fiber photometry assessment of DA projection activity in NAc during social interaction
(A) Fiber photometry of VTA projections in NAc. (B) VTA projection activity during social (top) and novel object investigation (bottom; interaction bouts in red). (C) Heatmaps (top) and peri-event plots (bottom) of NAc projection fluorescence aligned to start of interaction bout for social or novel object investigation. For heatmaps, warmer colors indicate higher fluorescence signal; peri-event plots: warmer colors indicate earlier interaction bouts. (D) NAc projections largely recapitulate social signals in VTA, with lower response to novel object (n=11, Wilcoxon signed-rank test, mean peak fluorescence: 6.9% dF/F social, 3.6% dF/F novel object, p=0.016). (E) Decay of NAc projection signal across bouts. Decay in signal during social behavior is slower in projections than cell bodies. Social decay rate=0.2491, r2=0.8; Object decay rate=0.0012, r2=0.6. (F) Directed graphical model of causal mediation analysis; while time elapsed partially mediated effects of VTA-NAc projection activity on latency to social interaction, the major effect was direct (68.2% average direct effect, 31.8% average indirect effect mediated by time elapsed; both p<0.0001). No significant direct or indirect effects of VTA-NAc projection activity on latency to interact were observed in novel object investigation.
Figure 7
Figure 7. VTA-NAc projection activity encodes social interaction
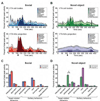
(A) Area plots, smoothed behavioral score: %total Ca2+ peaks representing specific social target-related and solitary behaviors during VTA cell body (top) and VTA-NAc projection (bottom) fiber photometry (5 min; n=10 and n=11 mice, respectively). Arrows: target introduction. (B) Area plots, smoothed behavioral score: %total Ca2+ peaks representing specific novel object-related and solitary behaviors during VTA cell body (top) and VTA-NAc projection (bottom) fiber photometry (5 min; n=10 and n=11 mice, respectively). (C) Summary of data from (A): average %total Ca2+ peaks in target-related and solitary behaviors while recording VTA cell bodies (blue) and VTA-NAc projections (red) in the social assay. Note encoding of social interaction by VTA cell body and VTA-NAc projection activity. (D) Summary of data from (B): average %total Ca2+ peaks in target-related and solitary behaviors while recording VTA cell bodies (green) and VTA-NAc projections (purple) in the novel object assay. After correcting for multiple comparisons, only VTA-NAc projection activity at withdrawal represented a significantly smaller proportion of total peak activity compared to VTA cell body activity (two-sample permutation t-test; p=0.034 (Holm-corrected), n=11), suggesting a specific reduction of object-related activity in VTA-NAc projections (the largest contributor to activity peaks in the novel object VTA cell body assay).
Figure 8
Figure 8. Postsynaptic NAc D1 cells and receptors in natural and VTA stimulation-driven social behavior
(A) Infusion of D1 receptor (D1R) antagonist SCH23390 into NAc prior to VTA stimulation during social interaction. (B) Compared to control saline infusion, D1R antagonism attenuated light-evoked increases in social behavior (n=15, LME model, t18=2.29, p=0.035). (C) Opto-D1 design: replacing intracellular loops of rhodopsin with those of D1R. (D) In vitro GPCR signaling assays show selective upregulation of cAMP but not IP3 or cGMP pathways by Opto-D1 (n=3 samples, 4 readings each, unpaired t-test, p=0.002). (E) Infusion of DIO-Opto-D1 virus into NAc of Drd1::Cre mice for selective expression in D1R+ NAc cells. (F) Illumination of Opto-D1 in NAc D1 cells with continuous 473 nm light increased social interaction compared to eYFP controls (n=10 per group, LME model, t18=2.64, p=0.018). (G) Example recording of NAc activity with Opto-D1 activation. (H) PSTH: light-evoked increase in NAc firing with Opto-D1. (I) Summary graph from (H): increase in NAc firing during activation of Opto-D1 (Wilcoxon signed-rank test, p=0.01). (J) Infusion of DIO-ChR2 into NAc of Drd1::Cre mice. (K) Tonic 10 Hz stimulation of NAc D1R cells increased social interaction (n=6, LME model, t11=2.26, p=0.039). See also Figure S5.

References

    1. Adamantidis AR, Tsai HC, Boutrel B, Zhang F, Stuber GD, Budygin EA, Tourino C, Bonci A, Deisseroth K, de Lecea L. Optogenetic interrogation of dopaminergic modulation of the multiple phases of reward-seeking behavior. J Neurosci. 2011;31:10829–10835. - PMC - PubMed
    1. Airan RD, Thompson KR, Fenno LE, Bernstein H, Deisseroth K. Temporally precise in vivo control of intracellular signalling. Nature. 2009;458:1025–1029. - PubMed
    1. Akerboom J, et al. Optimization of a GCaMP calcium indicator for neural activity imaging. J Neurosci. 2012;32:13819–13840. - PMC - PubMed
    1. Aragona BJ, Liu Y, Yu YJ, Curtis JT, Detwiler JM, Insel TR, Wang Z. Nucleus accumbens dopamine differentially mediates the formation and maintenance of monogamous pair bonds. Nature neuroscience. 2006;9:133–139. - PubMed
    1. Aravanis AM, Wang LP, Zhang F, Meltzer LA, Mogri MZ, Schneider MB, Deisseroth K. An optical neural interface: in vivo control of rodent motor cortex with integrated fiberoptic and optogenetic technology. Journal of neural engineering. 2007;4:S143–S156. - PubMed

Publication types