. 2014 Jun 19;157(7):1577-90.
doi: 10.1016/j.cell.2014.05.016.

The diabetes susceptibility gene Clec16a regulates mitophagy

Affiliations

The diabetes susceptibility gene Clec16a regulates mitophagy

Scott A Soleimanpour et al. Cell. .

Abstract

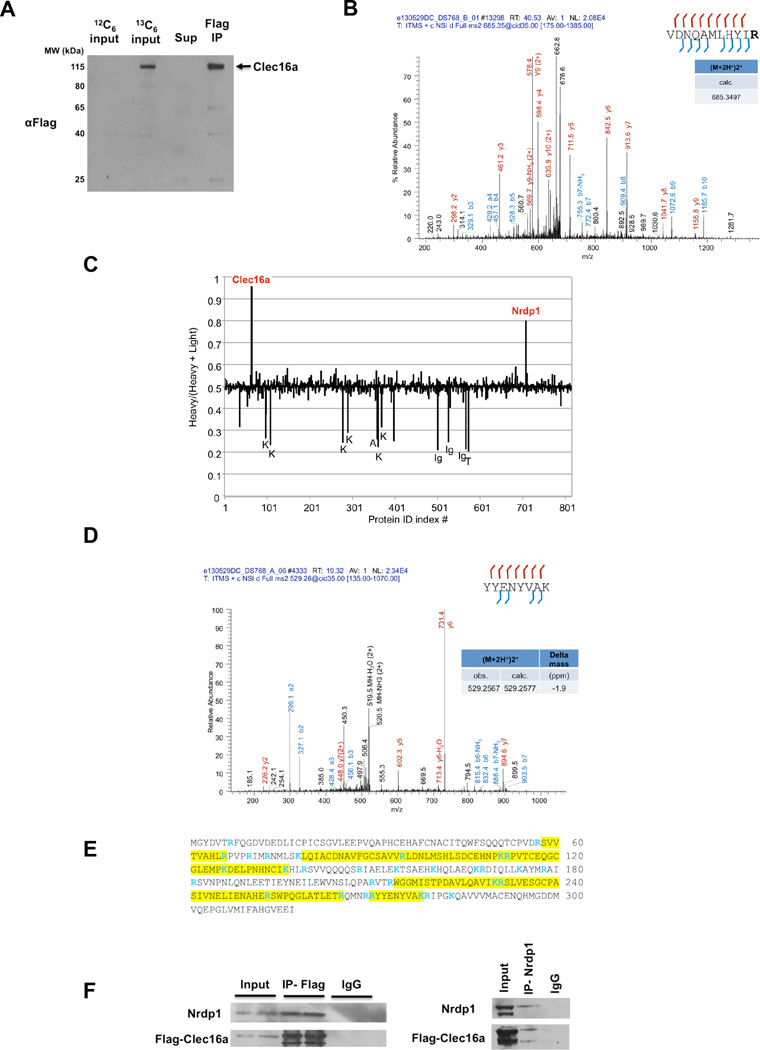
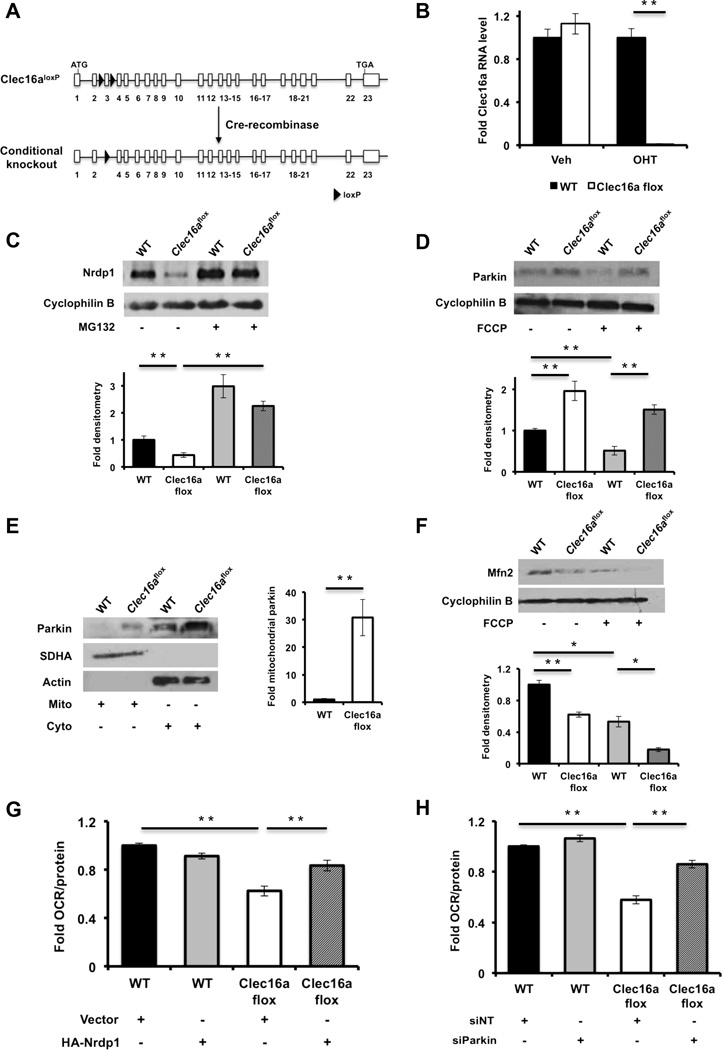
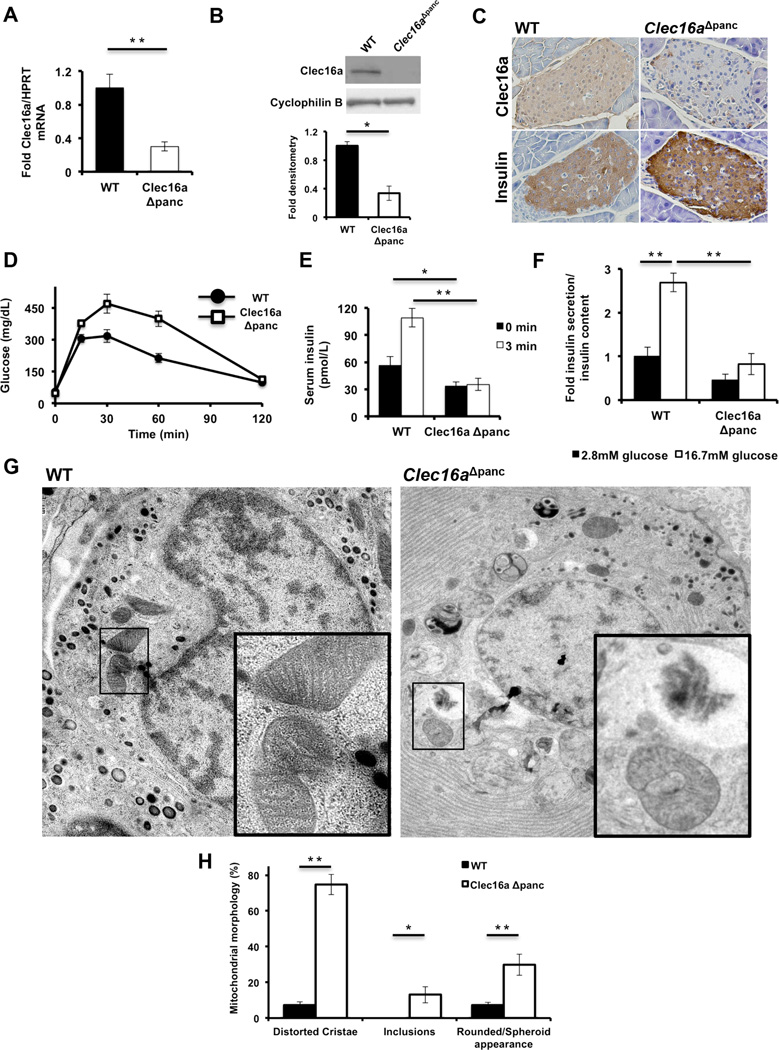
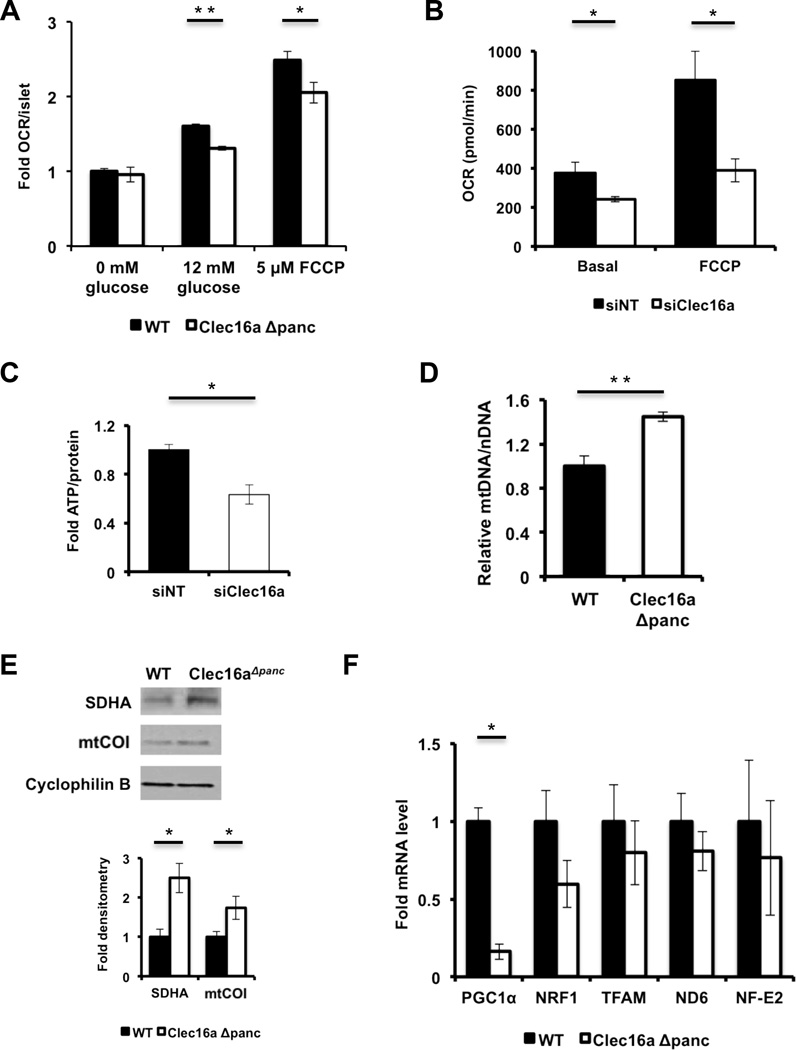
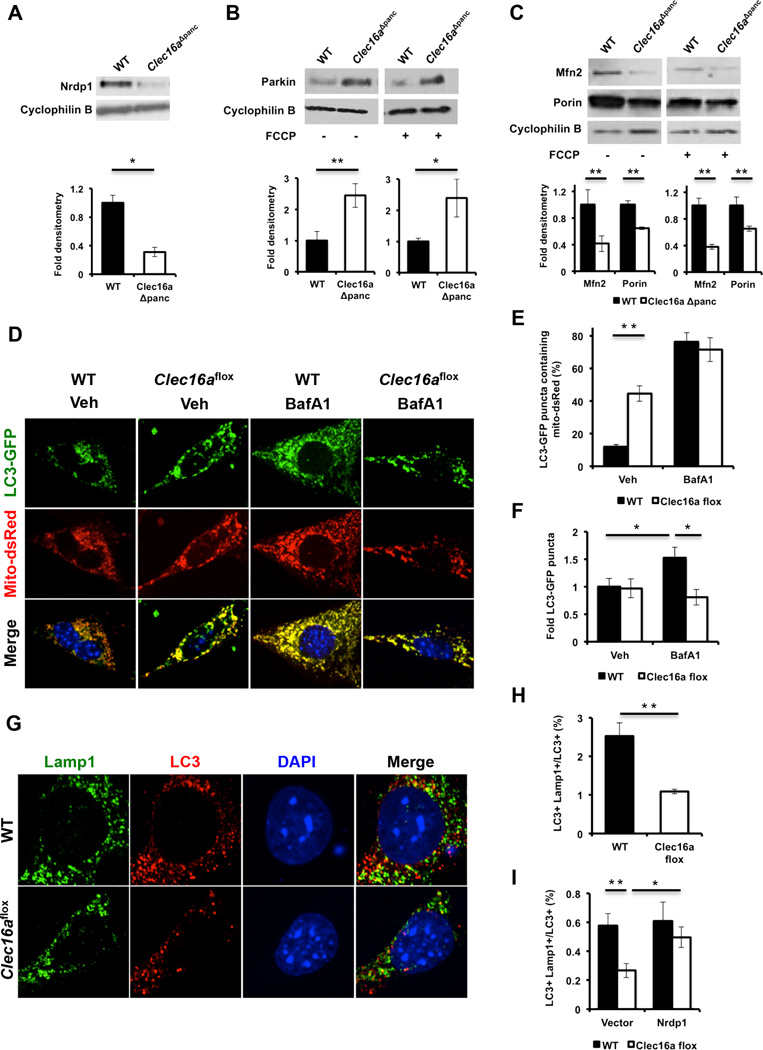
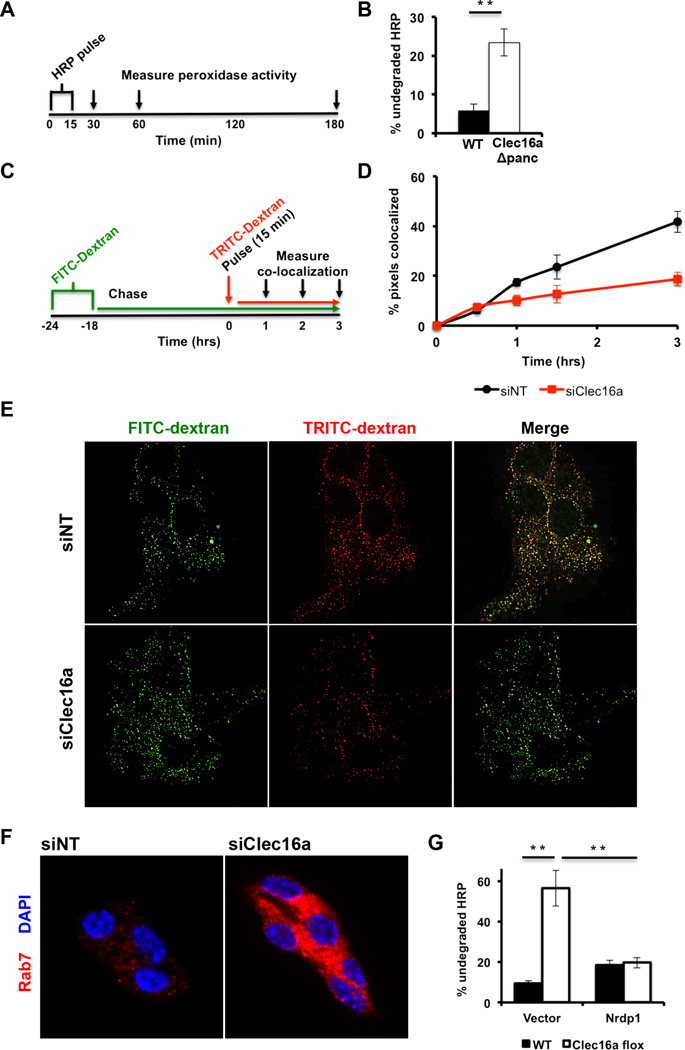
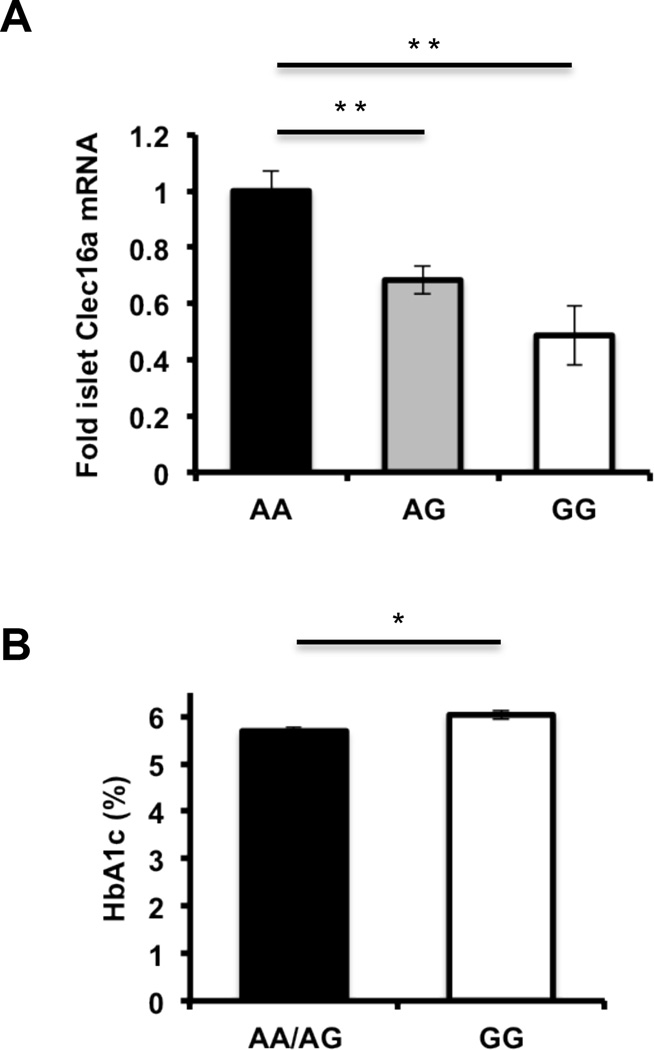
Clec16a has been identified as a disease susceptibility gene for type 1 diabetes, multiple sclerosis, and adrenal dysfunction, but its function is unknown. Here we report that Clec16a is a membrane-associated endosomal protein that interacts with E3 ubiquitin ligase Nrdp1. Loss of Clec16a leads to an increase in the Nrdp1 target Parkin, a master regulator of mitophagy. Islets from mice with pancreas-specific deletion of Clec16a have abnormal mitochondria with reduced oxygen consumption and ATP concentration, both of which are required for normal β cell function. Indeed, pancreatic Clec16a is required for normal glucose-stimulated insulin release. Moreover, patients harboring a diabetogenic SNP in the Clec16a gene have reduced islet Clec16a expression and reduced insulin secretion. Thus, Clec16a controls β cell function and prevents diabetes by controlling mitophagy. This pathway could be targeted for prevention and control of diabetes and may extend to the pathogenesis of other Clec16a- and Parkin-associated diseases.


Figures

Figure 1
Figure 1. I-DIRT identifies Clec16a interaction with E3 ubiquitin ligase Nrdp1
(A) Representative Western blot (WB) of parental NIH3T3 fibroblast (12C6-labeled) or stably expressing Flag-Clec16a NIH3T3 fibroblast (13C6-labeled) input protein lysates, supernatant and Flag immunoprecipitation for Flag-Clec16a (n=6). (B) MS/MS map marked with b ions (blue) and y ions (red) for Clec16a specific peptide sequence with calculated m/z ratios. Heavy residue indicated in bold print in peptide sequence. (C) I-DIRT ratios for >800 proteins identified from 6 independent I-DIRT experiments with calculated non-specific value of 0.5. Clec16a and Nrdp1 peaks indicated. Contaminant peptides (human keratin (K), immunoglobulins (Ig), trypsin (T), and albumin (A)) indicated by peaks below non-specific interactors. (D) MS/MS map marked with b ions (blue) and y ions (red) for an Nrdp1 specific peptide sequence with observed and calculated m/z ratios. (E) Amino acid sequence of Nrdp1 with peptides identified by MS (highlighted residues). Trypsin cleavage sites demarcated in blue. (F) Representative WB (3 independent experiments) of lysates of Flag-Clec16a NIH3T3 fibroblasts following anti-Flag IP (left) or anti-Nrdp1 IP (right).
Figure 2
Figure 2. Clec16a controls mitochondrial function through the Nrdp1/Parkin pathway
(A) Model of Cre-mediated recombination of the Clec16a locus. (B) Clec16a expression by qRTPCR of RNA isolated from vehicle (EtOH) or OHT treated WT or Clec16aflox fibroblasts (n=3/group). (C) Nrdp1 protein expression by WB of WT or Clec16aflox fibroblasts following overnight treatment with vehicle (DMSO) or 10 µM MG132 (n=3/group). (D) Parkin expression by WB in WT or Clec16aflox fibroblasts following 3-hr treatment with vehicle (DMSO) or 10 µM FCCP (n=3/group). (E) Parkin subcellular localization by WB in WT or Clec16aflox fibroblasts following cell fractionation and enrichment of mitochondrial or cytosolic proteins. SDHA and actin serve as mitochondrial and cytosolic loading controls, respectively (n=3/group). Fold mitochondrial parkin as estimated by densitometry. (F) Mitofusin 2 expression by WB in WT or Clec16aflox fibroblasts following 3-hr treatment with vehicle (DMSO) or 10 µM FCCP (n=3/group). (G) Fold oxygen consumption rate (OCR) in WT or Clec16aflox fibroblasts, 96 hours after transient overexpression of empty vector (pcDNA3-3xHA) or 3xHA-Nrdp1 (n=3/group). (H) Fold OCR in WT or Clec16aflox fibroblasts, 96 hours after transient transfection of non-targeting (siNT) or Parkin (siParkin) siRNA (n=3/group). For all WBs, representative images chosen from among 3 independent experiments. Densitometry, shown adjacent to each WB, represents mean (±SEM) of all 3 independent experiments. qRT-PCR and OCR data expressed as mean (±SEM) of 3 experiments performed in triplicate. *p<0.05 **p<0.01. See also Figure S1.
Figure 3
Figure 3. Pancreas-specific Clec16a loss of function leads to hyperglycemia due to functional defects in β-cells
(A) Clec16a mRNA expression by qRT-PCR from RNA isolated from WT or Clec16aΔpanc islets (n=10/group). (B) Clec16a expression by WB in WT or Clec16aΔpanc islets (n=4/group). (C) Immunohistochemistry of adjacent sections of WT and Clec16aΔpanc pancreata for Clec16a (top) and insulin (bottom). Image shown is representative of IHC performed in 3 mice/group. (D) Blood glucose concentrations measured during IPGTT of 5 week old WT and Clec16aΔpanc littermates. (p<0.005 by ANOVA; n=6–15/group) (E) Serum insulin (n=6–15/group) measured during in vivo glucose-stimulated insulin release testing in 8 week old WT and Clec16aΔpanc littermates. (F) Fold glucose-stimulated insulin secretion following static incubations in 2.8mM and 16.7 mM glucose performed in isolated WT or Clec16aΔpanc islets of 8 week old littermates (n=4/group). (G) Transmission EM images from 3-month-old WT and Clec16aΔpanc β-cells. Inset (lower right) – focused area of mitochondria on EM images. (H) Quantification of changes in mitochondrial morphology (% of total mitochondria) observed in WT and Clec16aΔpanc β-cells in transmission EM images (~250 independent mitochondria scored/animal). Images captured from 3–6 animals/group. Representative WBs chosen from among 4 independent experiments. Densitometry, shown adjacent to each WB, represents mean (±SEM) of 4 independent experiments. *p<0.05 **p<0.01. See also Figures S2-S4.
Figure 4
Figure 4. Clec16a loss of function results in the accumulation of unhealthy mitochondria
(A) Relative OCR measured in isolated WT and Clec16aΔpanc islets (n=6/group). (B) OCR (n=4/group) measured at baseline or following 300 nM FCCP in Min6 β-cells following transfection with non-targeting (siNT) or Clec16a specific siRNA (siClec16a). (C) Fold ATP concentrations (normalized to protein content; n=3/group) in Min6 β-cells following transfection with siNT or siClec16a. (D) Relative mtDNA content measured by qPCR (normalized to nuclear DNA expression) in isolated WT and Clec16aΔpanc islets (n=3–4/group). (E) Expression of the mitochondrial proteins succinate dehydrogenase A (SDHA) and mitochondrial complex IV subunit I (mtCOI) in isolated WT and Clec16aΔpanc islets by WB. (F) Quantitative RT-PCR of markers of mitochondrial biogenesis (PGC1α, NRF1, TFAM) and ROS-induced genes (ND6 and NF-E2) from RNA isolated from WT and Clec16aΔpanc islets (n=5/group). For all WBs, representative images chosen from 3 independent experiments performed. WB densitometry represents mean (±SEM) of 3 independent experiments. *p<0.05 **p<0.01. See also Figures S5-S6.
Figure 5
Figure 5. Clec16a regulates mitophagy
(A) Nrdp1 expression by WB of WT and Clec16aΔpanc islets. Representative WB chosen from 4 independent experiments performed. Each sample analyzed comprised islet lysates pooled from 8 mice (32 mice total/group). (B) Parkin expression by WB of WT and Clec16aΔpanc islets following 3-hr of vehicle (DMSO) or 10 µM FCCP (n=3/group). (C) Mfn2 and Porin expression by WB in WT and Clec16aΔpanc islets following 3-hr of vehicle (DMSO) or 10 µM FCCP (n=3/group). (D) Representative deconvolution image of WT and Clec16aflox fibroblasts, 72 hours after overexpression of LC3-GFP and mito-dsRed, treated with vehicle (DMSO) or 150 nM BafA1 for 6 hours. (E) Quantification of LC3-GFP/mito-dsRed co-localization in WT and Clec16aflox fibroblasts following vehicle (DMSO) or 150 nM BafA1 for 6 hours (n=5–8/group). (F) Fold LC3-GFP puncta quantified from WT and Clec16aflox fibroblasts, 72 hours after overexpression of LC3-GFP, treated with vehicle (DMSO) or 150 nM BafA1 for 6 hours. (G) Representative deconvolution image of WT and Clec16aflox fibroblasts treated with 10 µM FCCP for 60 minutes followed by indirect immunofluorescence for Lamp1 (green), LC3 (red), and DAPI (blue). (H) Quantification of LC3+ Lamp1+ co-localization in WT and Clec16aflox fibroblasts following 10 µM FCCP for 60 minutes (n=5/group). (I) Quantification of LC3+ Lamp1+ co-localization in non-FCCP treated WT and Clec16aflox fibroblasts, 72 hours after transient overexpression of empty vector (pcDNA3–3xHA) or 3xHANrdp1 (n=5–7/group). For Figure 5B and 5C, representative WBs chosen from 3 independent experiments performed. Densitometry, shown adjacent to each WB, represents mean (±SEM) of all experiments performed. *p<0.05 **p<0.01. See also Figures S5-S6 and Movies S1–S3.
Figure 6
Figure 6. Clec16a regulates β-cell endosomal trafficking
(A) Study design for HRP (5 mg/mL) trafficking and degradation by a pulse-chase approach. (B) Quantification of undegraded HRP activity in dispersed WT and Clec16aΔpanc islets (n=6/group). (C) Study design for fluorescent-conjugated dextran trafficking and co-localization by pulse-chase in Min6 β-cells. (D) Quantification of FITC-dextran and TRITC-dextran co-localization over time in Min6 β-cells (p<0.05 by ANOVA; n=3/group) 72 hours after transient transfection with non-targeting or Clec16a-specific siRNA. (E) Representative deconvolution image of FITC-dextran and TRITC-dextran treated Min6 β-cells (3 hours post-TRITC-dextran chase) following transient transfection with non-targeting or Clec16a-specific siRNA. (F) Representative deconvolution image following immunofluorescence staining for Rab7 (red) and DAPI (DNA, blue) of Min6 β-cells following transient transfection with non-targeting or Clec16a-specific siRNA. (G) Quantification of undegraded HRP activity in WT and Clec16aflox fibroblasts, 72 hours after overexpression of empty vector (pcDNA3–3xHA) or 3xHA-Nrdp1, utilizing HRP pulse-chase approach (n=6/group). *p<0.05 **p<0.01. See also Figure S7 and Movies S1 and S3.
Figure 7
Figure 7. The diabetogenic CLEC16A SNP rs12708716 is associated with reduced islet CLEC16A expression and impaired glucose control
(A) Human islet CLEC16A RNA expression measured by RNA-seq in islet donors stratified by DNA sequencing at position of rs12708716 A/G SNP. **p<0.001. (B) Hemoglobin A1c measurements in islet donors sequenced at position of rs12708716 A/G SNP. (AA n=31/group, AG n=42/group, GG n=8/group). *p<0.05.

References

    1. Ashrafi G, Schwarz TL. The pathways of mitophagy for quality control and clearance of mitochondria. Cell death and differentiation. 2013;20:31–42. - PMC - PubMed
    1. Avvakumov GV, Walker JR, Xue S, Finerty PJ, Jr, Mackenzie F, Newman EM, Dhe-Paganon S. Amino-terminal dimerization, NRDP1-rhodanese interaction, and inhibited catalytic domain conformation of the ubiquitin-specific protease 8 (USP8) J Biol Chem. 2006;281:38061–38070. - PubMed
    1. Chase HP, Cuthbertson DD, Dolan LM, Kaufman F, Krischer JP, Schatz DA, White NH, Wilson DM, Wolfsdorf J. First-phase insulin release during the intravenous glucose tolerance test as a risk factor for type 1 diabetes. J Pediatr. 2001;138:244–249. - PubMed
    1. de Brito OM, Scorrano L. Mitofusin 2 tethers endoplasmic reticulum to mitochondria. Nature. 2008;456:605–610. - PubMed
    1. Defronzo RA. Banting Lecture. From the triumvirate to the ominous octet: a new paradigm for the treatment of type 2 diabetes mellitus. Diabetes. 2009;58:773–795. - PMC - PubMed

Publication types

MeSH terms