. 2014 Aug;235(2):449-62.
doi: 10.1016/j.atherosclerosis.2014.05.931. Epub 2014 Jun 4.

CETP inhibitors downregulate hepatic LDL receptor and PCSK9 expression in vitro and in vivo through a SREBP2 dependent mechanism

Affiliations

CETP inhibitors downregulate hepatic LDL receptor and PCSK9 expression in vitro and in vivo through a SREBP2 dependent mechanism

Bin Dong et al. Atherosclerosis. 2014 Aug.

Abstract

Background: CETP inhibitors block the transfer of cholesteryl ester from HDL-C to VLDL-C and LDL-C, thereby raising HDL-C and lowering LDL-C. In this study, we explored the effect of CETP inhibitors on hepatic LDL receptor (LDLR) and PCSK9 expression and further elucidated the underlying regulatory mechanism.

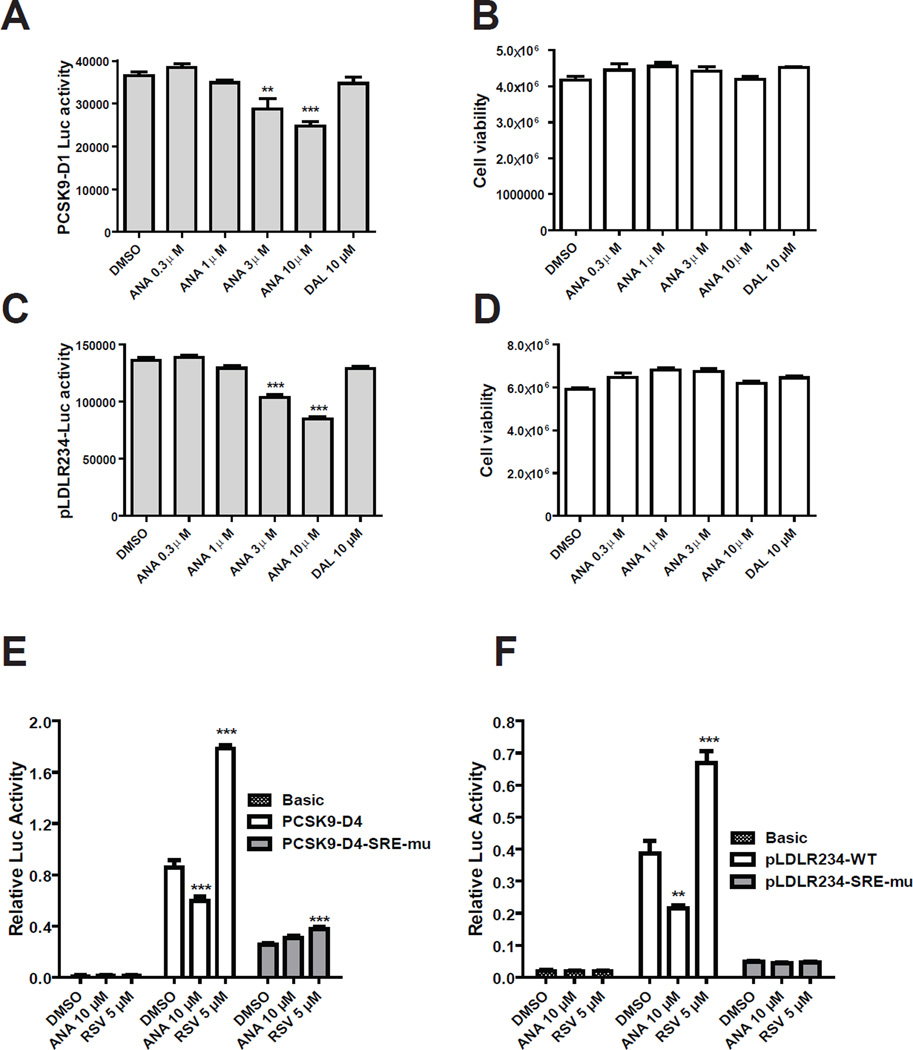
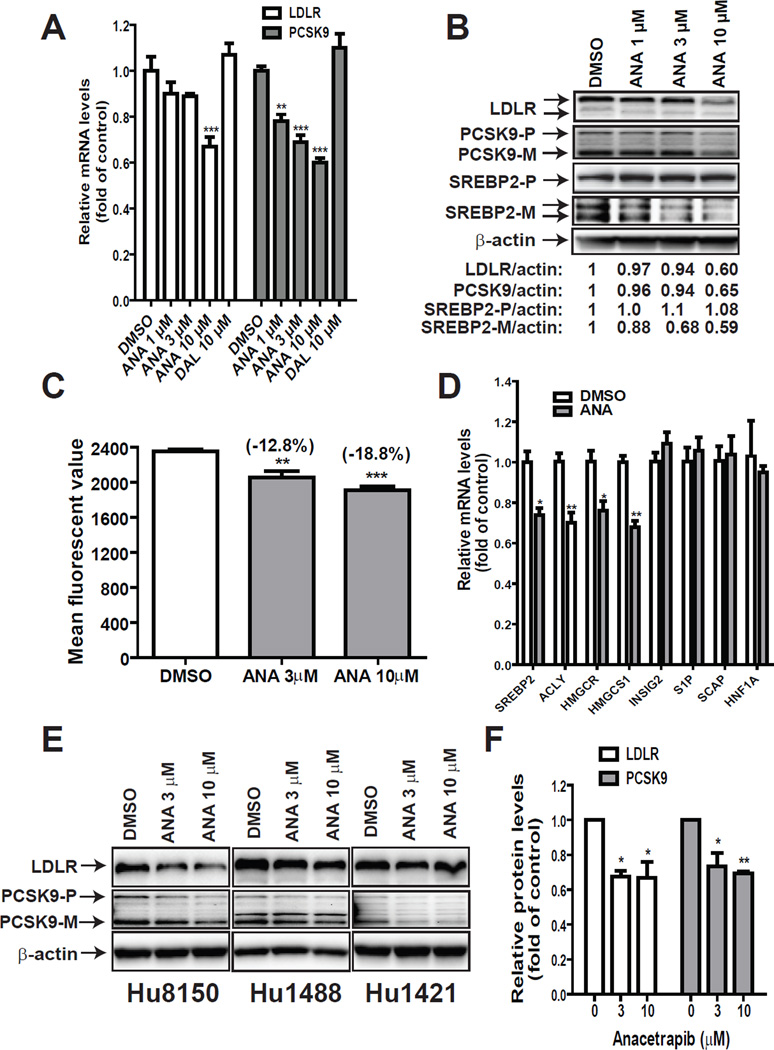
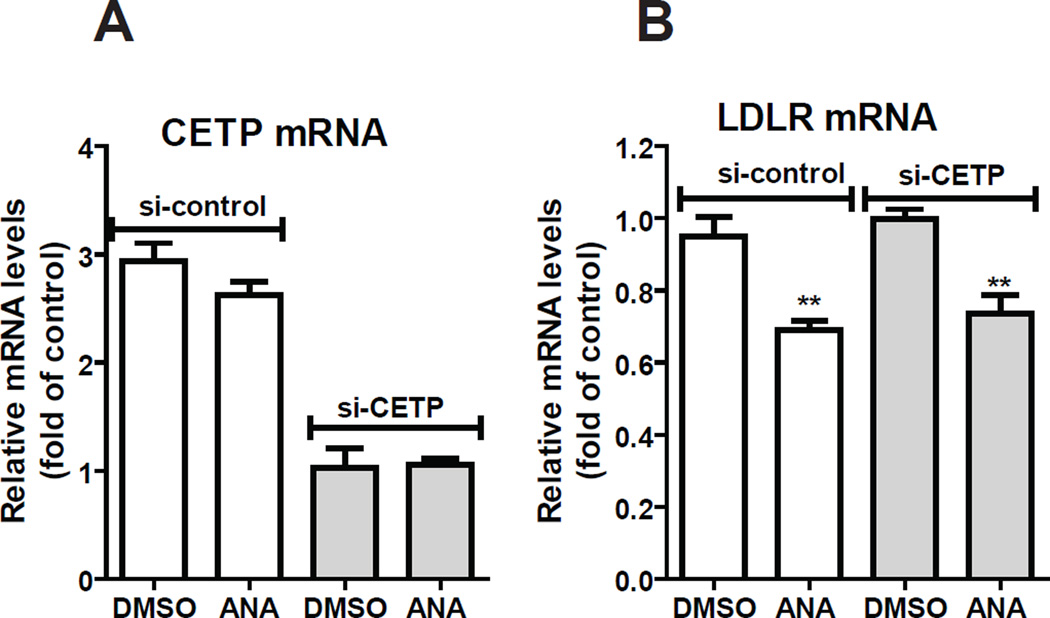
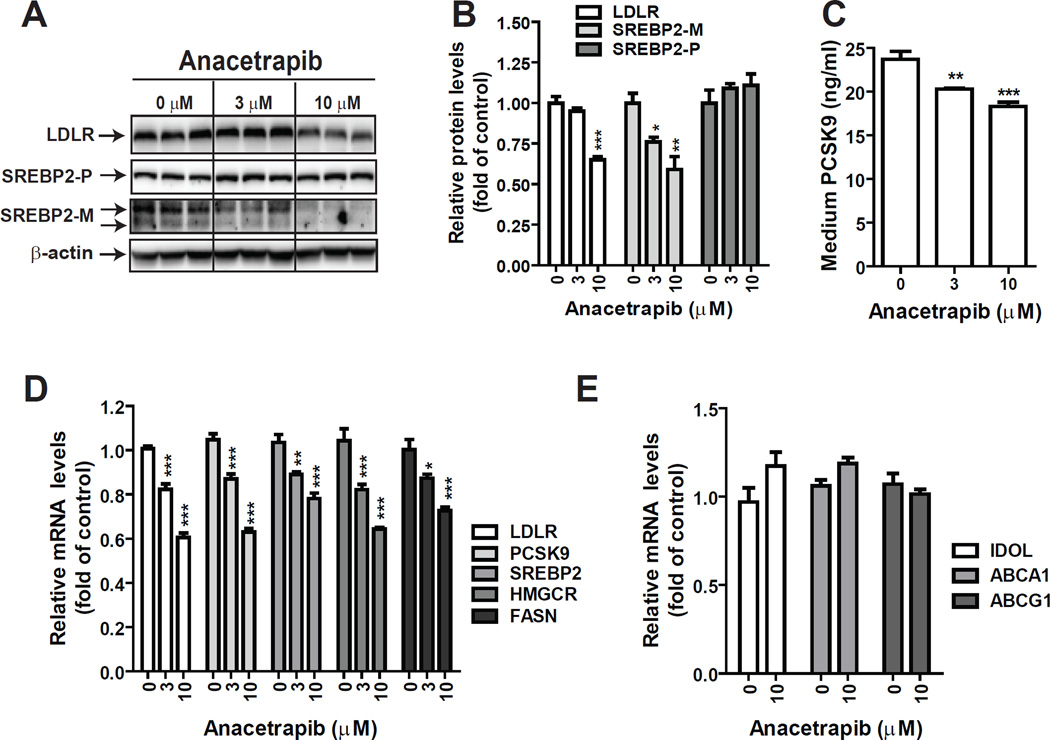
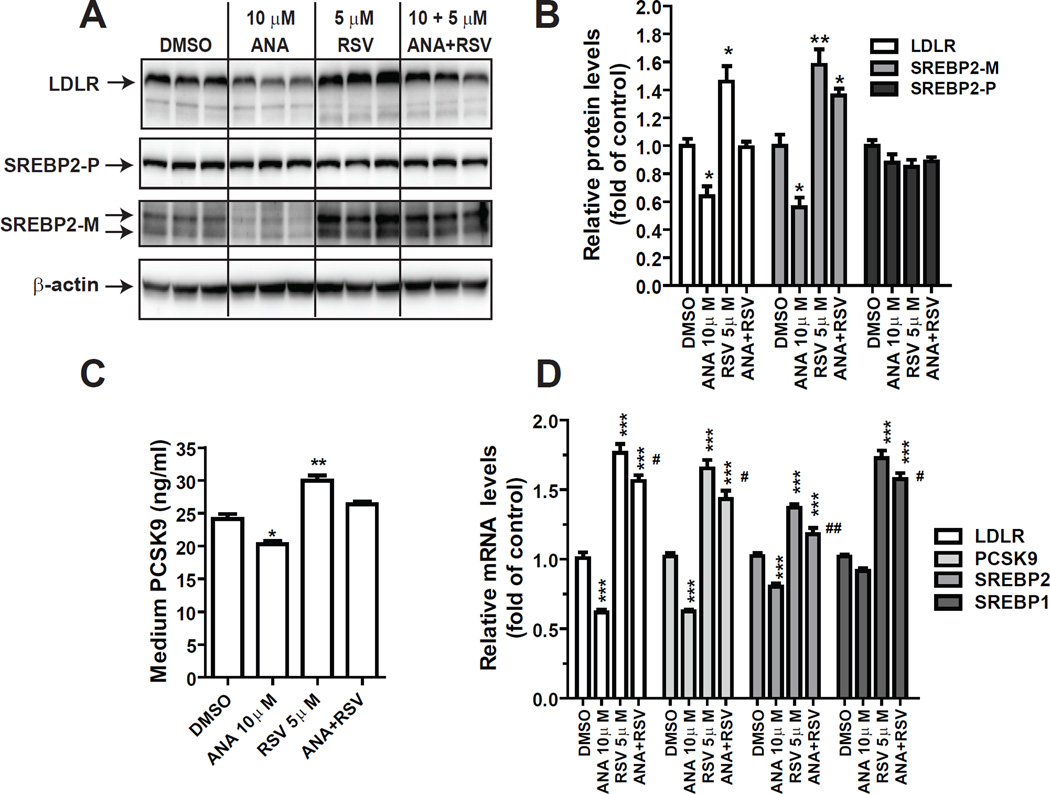
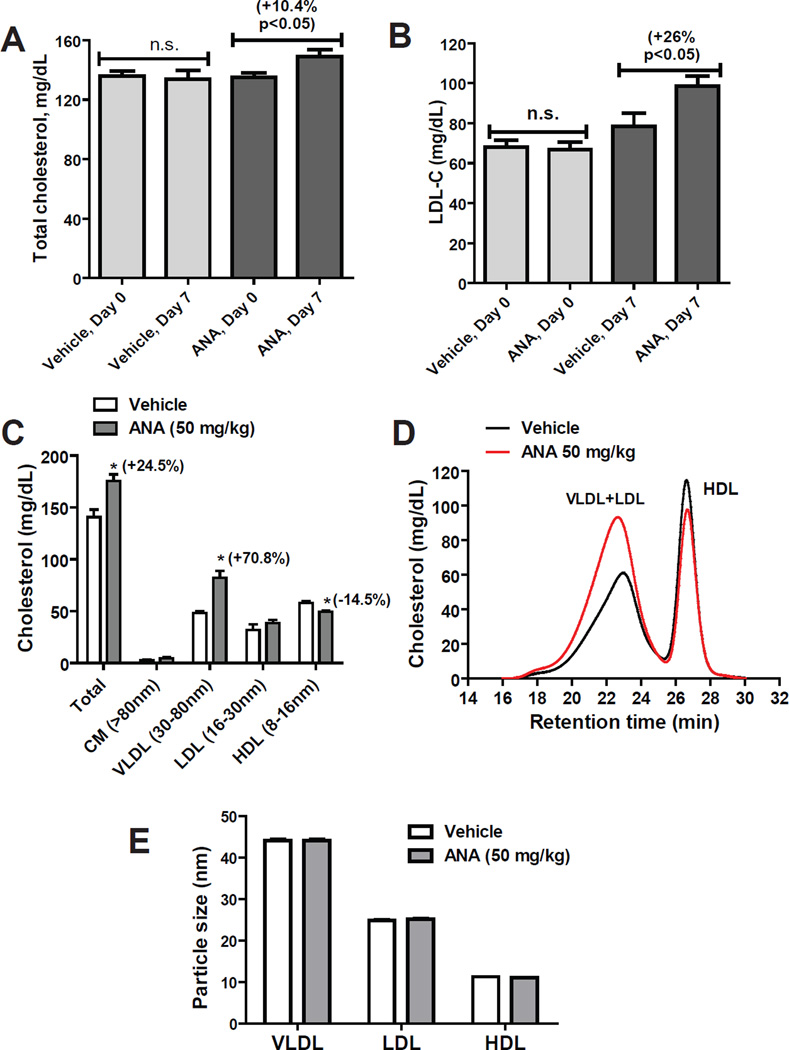
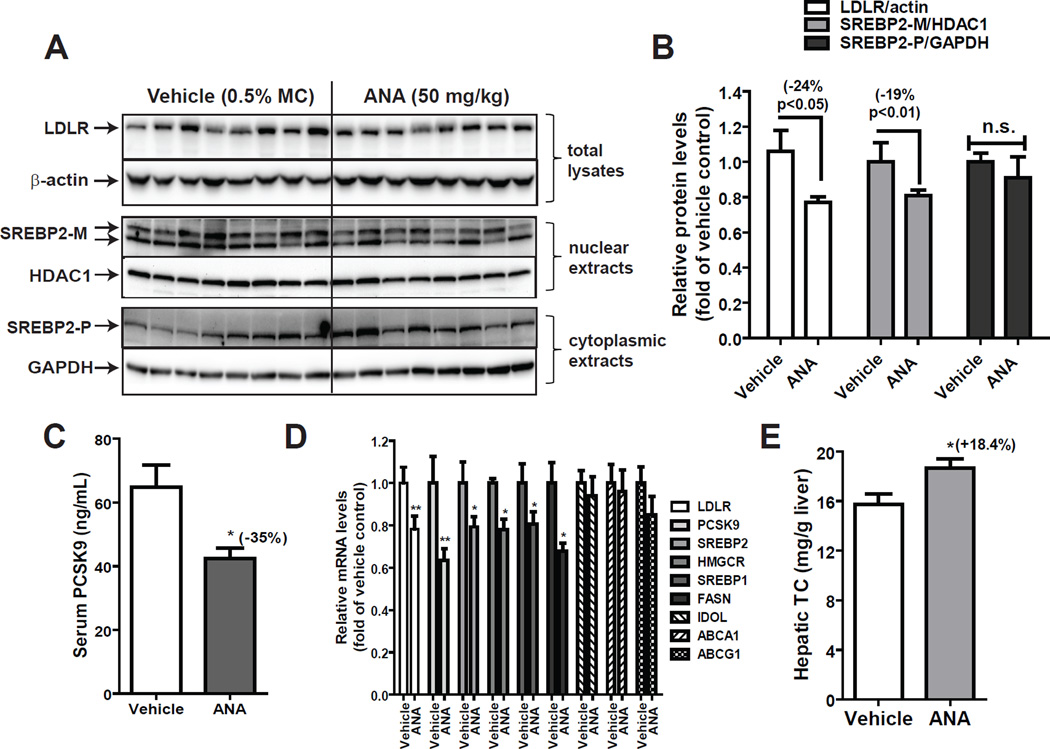
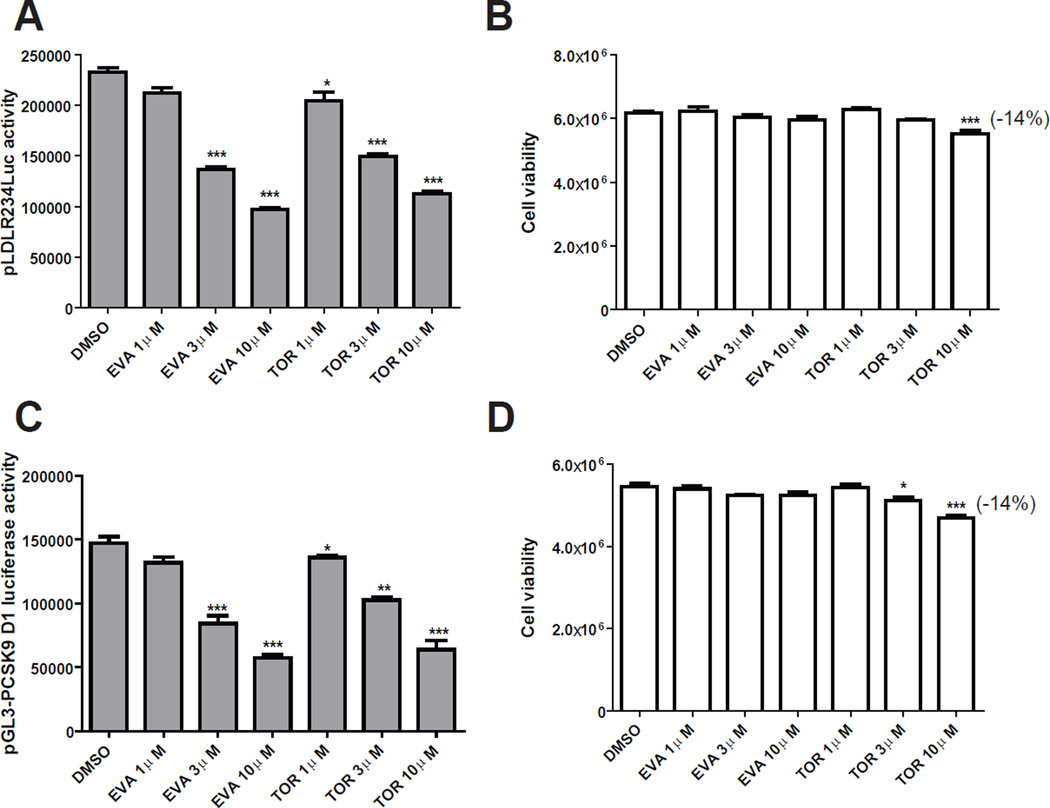
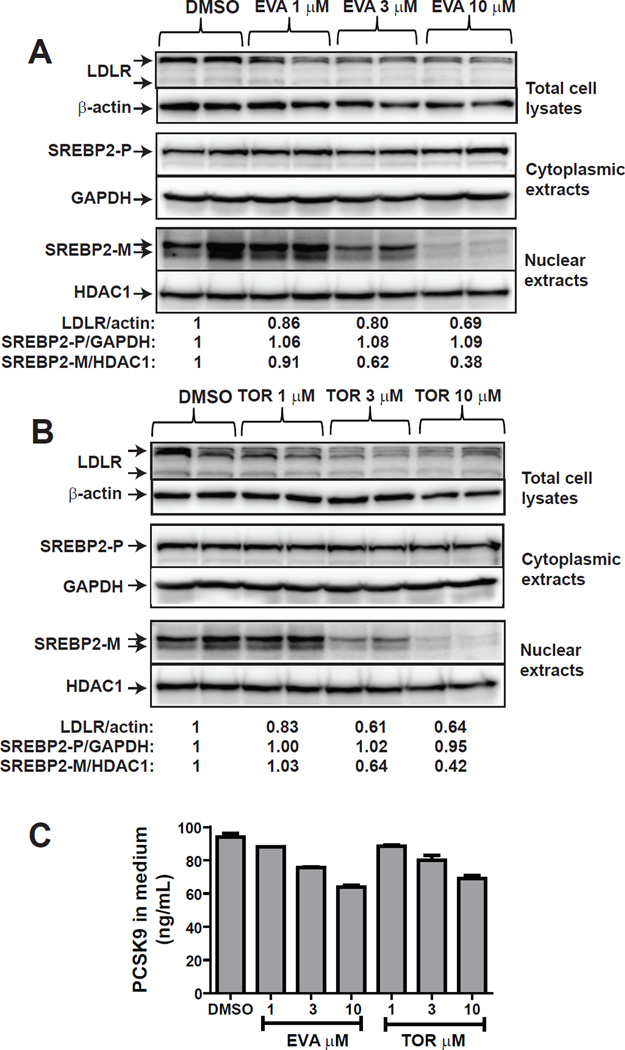
Results: We first examined the effect of anacetrapib (ANA) and dalcetrapib (DAL) on LDLR and PCSK9 expression in hepatic cells in vitro. ANA exhibited a dose-dependent inhibition on both LDLR and PCSK9 expression in CETP-positive HepG2 cells and human primary hepatocytes as well as CETP-negative mouse primary hepatocytes (MPH). Moreover, the induction of LDLR protein expression by rosuvastatin in MPH was blunted by cotreatment with ANA. In both HepG2 and MPH ANA treatment reduced the amount of mature form of SREBP2 (SREBP2-M). In vivo, oral administration of ANA to dyslipidemic C57BL/6J mice at a daily dose of 50 mg/kg for 1 week elevated serum total cholesterol by approximately 24.5% (p < 0.05%) and VLDL-C by 70% (p < 0.05%) with concomitant reductions of serum PCSK9 and liver LDLR/SREBP2-M protein. Finally, we examined the in vitro effect of two other strong CETP inhibitors evacetrapib and torcetrapib on LDLR/PCSK9 expression and observed a similar inhibitory effect as ANA in a concentration range of 1-10 μM.

Conclusion: Our study revealed an unexpected off-target effect of CETP inhibitors that reduce the mature form of SREBP2, leading to attenuated transcription of hepatic LDLR and PCSK9. This negative regulation of SREBP pathway by ANA manifested in mice where CETP activity was absent and affected serum cholesterol metabolism.

Keywords: CETP inhibitors; Hyperlipidemia; LDL receptor; PCSK9; SREBP2.


Figures

Figure 1
Figure 1. Analysis of PCSK9 and LDLR promoter activities in stable and transiently transfected HepG2 cells without and with CETP inhibitors
HepG2-CL26 cells (A, B) or HepG2-B11 (C, D) cells were incubated with ANA or DAL for 24 h. Luciferase activities were measured to determine PCSK9 promoter activity in CL26 cells and LDLR promoter activity in B11 cells. Cell viabilities in CL26 (B) and B11 cells (D) were determined as described in methods. HepG2 cells were transiently transfected with PCSK9 (E) or LDLR (F) wild-type and SRE-1 mutated reporters along with pRL-SV40 renilla control vector. One day post transfection, cells were treated for 24 h with 5 µM RSV or 10 µM ANA. Cells were harvested and dual luciferase activities were measured. Firefly luciferase activity was normalized with renilla luciferase activity. After normalization, the relative luciferase unit of each vector is expressed. Significant differences between control and treatments were assessed by One-way ANOVA with posttest of Dunnett’s Multiple Comparison Test. Data shown are representative of 2–4 separate experiments with similar results.
Figure 2
Figure 2. Downregulation of the mature form of SREBP2 by ANA attenuated LDLR and PCSK9 expression in HepG2 and primary human hepatocytes
(A, B) HepG2 cells were treated with vehicle DMSO, ANA or DAL for 24 h. Total RNA was isolated and mRNA levels of LDLR and PCSK9 were quantified by qPCR in A. In B, total cell lysates were isolated and protein levels of LDLR, PCSK9 and SREBP2 were examined by Western blotting. PCSK9-P refers to the PCSK9 proprotein and PCSK9-M refers to the processed mature protein. SREBP2-P refers to the precursor form and SREBP-M refers to the processed and active mature form of SREBP2. (C) HepG2 cells cultured in 10% FBS medium on six-well culture plates were treated for 24 h with 3 mM or 10µM ANA. After treatment, fluorescent DiI-LDL at a concentration of 2 µg/ml was added to the medium and cells were trypsinized 4 h later. The uptake of DiI-LDL was measured by FACScan with 1×10⁴ cells per sample. The data shown are mean ± SEM of four wells per treatment condition. Data shown are representative of 2 separate experiments with similar results. (D) HepG2 cells were treated with 10 µM ANA for 24 h and total RNA was harvested for gene expression analysis. Significant differences between control and ANA treatment were assessed by two-tailed Student’s t-test. (E, F) Primary human hepatocytes of three different donors (Hu8105, Hu1488 and Hu1421) were seeded in 12-well plates at a density of 1×10⁶ cells/well in William E Medium supplemented with 10% FBS. After overnight seeding, cells were treated with 3 or 10 µM ANA for 24 h before cell lysis for Western blotting with anti-LDLR, anti-PCSK9, or anti-β-actin antibodies. The LDLR and PCSK9 bands were quantified with the Alpha View Software with normalization by signals of β-actin and were graphed relative to vehicle DMSO-treated cells.
Figure 3
Figure 3. Examination of the involvement of CETP in ANA-mediated suppression of LDLR mRNA expression
HepG2 cells were transfected with si-CETP or a control siRNA for 48 h, followed by ANA treatment of 24 h. qPCR was conducted to determine CETP mRNA levels (A) or LDLR mRNA levels (B). The figures shown are representatives of 2 separate transfection experiments with similar results.
Figure 4
Figure 4. CETP-independent suppression of SREBP pathway by ANA in MPH
MPH in triplicate wells were treated with ANA for 24 h. In A, total cell lysates were isolated and the protein abundance of LDLR or SREBP2 was examined by Western blotting and specific signals were quantified and presented in B. In C, concentrations of secreted PCSK9 in medium of different treatments were measured by a mouse PCSK9 ELISA kit. In D & E, total RNA was isolated and mRNA levels of SREBP-target genes (D) and LXR target genes (E) were measured and presented relative to control without ANA treatment. Data are mean ± SEM of triplicate RNA samples with duplicate measurements of each cDNA sample.
Figure 5
Figure 5. Antagonism to statin-induced activation of SREBP2 by ANA in MPH
MPH in triplicate wells were treated with 5 µM RSV, 10 µM ANA or RSV+ANA for 24 h. In A, protein levels of LDLR and SREBP2 were examined by Western blotting and specific signals were quantified and presented in B. In C, concentrations of secreted PCSK9 in medium of different treatments were measured by ELISA. Significant differences between control and treatment were assessed by One-way ANOVA with posttest of Bonferroni’s multiple comparison for B & C *p < 0.05 and **p < 0.01 as compared to DMSO vehicle control. In D, total RNA was isolated and mRNA levels of SREBP-target genes were measured and presented relative to control without treatment. Data are mean ± SEM of triplicate RNA samples with duplicate measurements of each cDNA sample. Significant differences between control and treatment were assessed by One-way ANOVA with posttest of Tukey’s multiple comparison, *p < 0.05 and ***p < 0.001 as compared to DMSO control. #p < 0.05 and ##p < 0.01 as compared to RSV treatment alone.
Figure 6
Figure 6. ANA treatment affected serum cholesterol levels of mice fed a HFHC diet
(A, B) Male C57BL/6J mice fed a HFHC diet were orally dosed 50 mg/kg/day ANA (n=8) or equal volume of vehicle (0.5% methyl cellulose) as the control group (n=8) for 7 days. Serum TC and LDL-C were measured at day 0 before the drug treatment and day 7 after the last dosing by commercial kits. Data are mean ± SEM. (C–E) Fifty µl of serum sample from two serum samples of the same treatment group were pooled together and a total of 4 pooled samples from vehicle group and 4 pooled samples from ANA-treated group were individually analyzed for cholesterol levels of each of the major lipoprotein classes including chylomicron (CM), VLDL, LDL, and HDL after HPLC separation. In C, cholesterol levels in individual lipoprotein fractions are presented as mean ± SEM. In D, the mean value of cholesterol in vehicle and ANA-treated samples are plotted. The calculated particle sizes are presented as mean ± SEM. Significant differences between control and ANA treatment were assessed by two-tailed Student’s t-test.
Figure 7
Figure 7. ANA treatment reduced the mature form of SREBP2 and LDLR protein levels in liver tissue and decreased serum PCSK9 levels in dyslipidemic mice
(A) Individual liver protein extracts were prepared and protein concentrations were determined. 50 µg of homogenate proteins of individual liver samples were resolved by SDS-PAGE and LDLR protein was detected by immunoblotting using anti-LDLR antibody. The membrane was reprobed with anti-β-actin antibody. Nuclear fraction and cytoplasmic fraction of individual liver homogenate from the ANA and vehicle groups were analyzed for SREBP2-M and SREBP2-P protein levels by Western blotting. The membranes were reprobed with anti-HDAC1 antibody as a control of equal nuclear protein loading or GAPDH as a control of equal cytoplasmic protein loading. (B) The protein abundance of LDLR was quantified with the Alpha View Software with normalization by signals of β-actin. Values are mean ± SEM of 7 samples per group. * p < 0.05 compared to the vehicle group. The protein abundance of SREBP2-M in nuclear extracts was quantified with normalization by signals of HDAC1. Values are mean ± SEM of 8 samples per group. ** p < 0.01 compared to the vehicle group. The protein abundance of SREBP2-P in cytoplasmic extracts was quantified with normalization by signals of GAPDH. Values are mean ± SEM of 8 samples per group. n.s., not statistically significant as compared to the vehicle group. (C) Individual serum PCSK9 levels were quantified by ELISA. Values are mean ± SEM of 8 mice per group. (D) qPCR analysis of liver mRNA levels of LDLR and PCSK9 along with 4 additional SREBP-target genes and 3 LXR regulated genes in ANA-treated and vehicle-treated control mice. Values are mean ± SEM of 8 mice per group (E) Cholesterol levels in vehicle and ANA-treated liver samples were measured. Values are mean ± SEM of 8 mice per group.
Figure 8
Figure 8. EVA and TOR inhibited LDLR and PCSK9 promoter activity
HepG2-B11 cells (A, B) or HepG2-CL26 (C, D) cells were incubated with EVA or TOR at indicated concentrations for 24 h. Luciferase activities were measured to determine LDLR promoter activity in B11 cells and PCSK9 promoter activity in CL26 cells. Cell viability was determined as described in methods. Significant differences between control and treatments were assessed by One-way ANOVA with posttest of Dunnett’s Multiple Comparison Test.
Figure 9
Figure 9. Downregulation of SREBP2-M by EVA and TOR reduced LDLR and PCSK9 expression
HepG2 cells were treated with EVA (A) or TOR (B) at indicated concentrations for 24 h. Total cell lysates (30 µg) were analyzed for the protein abundance of LDLR and β-actin. Nuclear and cytoplasmic extracts were isolated from each sample. Nuclear extracts of 30 µg protein per sample were used to detect SREBP2-M. The membrane was reprobed with anti-HDAC1. Cytoplasmic extracts of 30 µg protein per sample were used to detect SREBP2-P. The membrane was reprobed with anti-GAPDH. The amount of secreted PCSK9 in culture medium was determined by a human PCSK9 ELISA kit (C).

Similar articles

Cited by

References

    1. Grundy SM, Cleeman JI, Merz CN, Brewer HB, Jr, Clark LT, Hunninghake DB, Pasternak RC, Smith SC, Jr, Stone NJ. Implications of recent clinical trials for the National Cholesterol Education Program Adult Treatment Panel III Guidelines. J Am Coll Cardiol. 2004;44:720–732. - PubMed
    1. Spady DK. Hepatic clearance of plasma low density lipoproteins. Semin Liver Dis. 1996;12:373–385. - PubMed
    1. Brown MS, Goldstein JL. A receptor-mediated pathway for cholesterol homeostasis. Science. 1986;232:34–47. - PubMed
    1. Goldstein JL, Brown MS. Regulation of the mevalonate pathway. Nature. 1990;343:425–430. - PubMed
    1. Grundy SM. Statin trials and goals of cholesterol-lowering therapy. Circulation. 1998;97:1436–1439. - PubMed

Publication types

MeSH terms