. 2014 Jul;6(7):575-83.
doi: 10.1038/nchem.1954. Epub 2014 May 25.

Incorporation of protein flexibility and conformational energy penalties in docking screens to improve ligand discovery

Affiliations

Incorporation of protein flexibility and conformational energy penalties in docking screens to improve ligand discovery

Marcus Fischer et al. Nat Chem. 2014 Jul.

Abstract

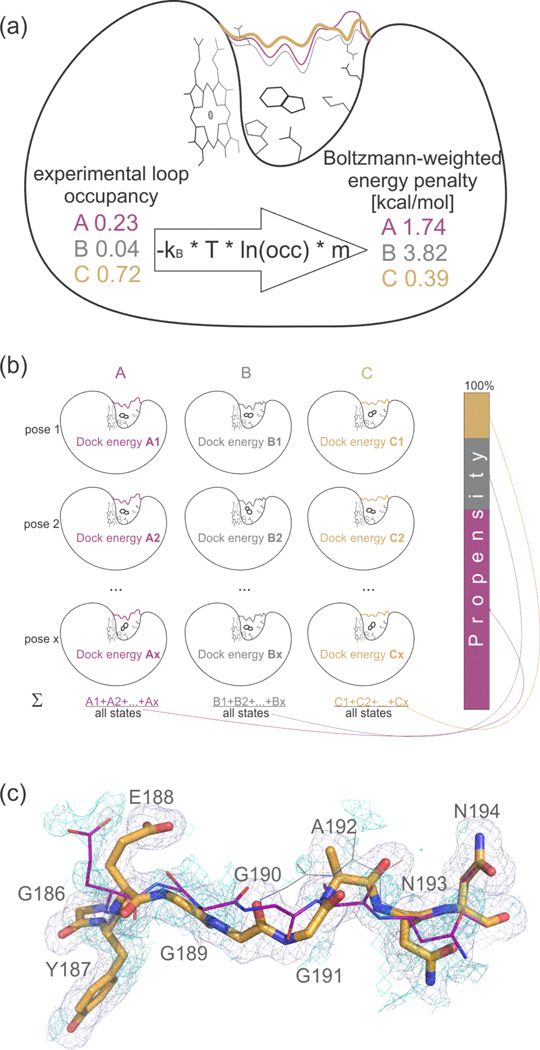
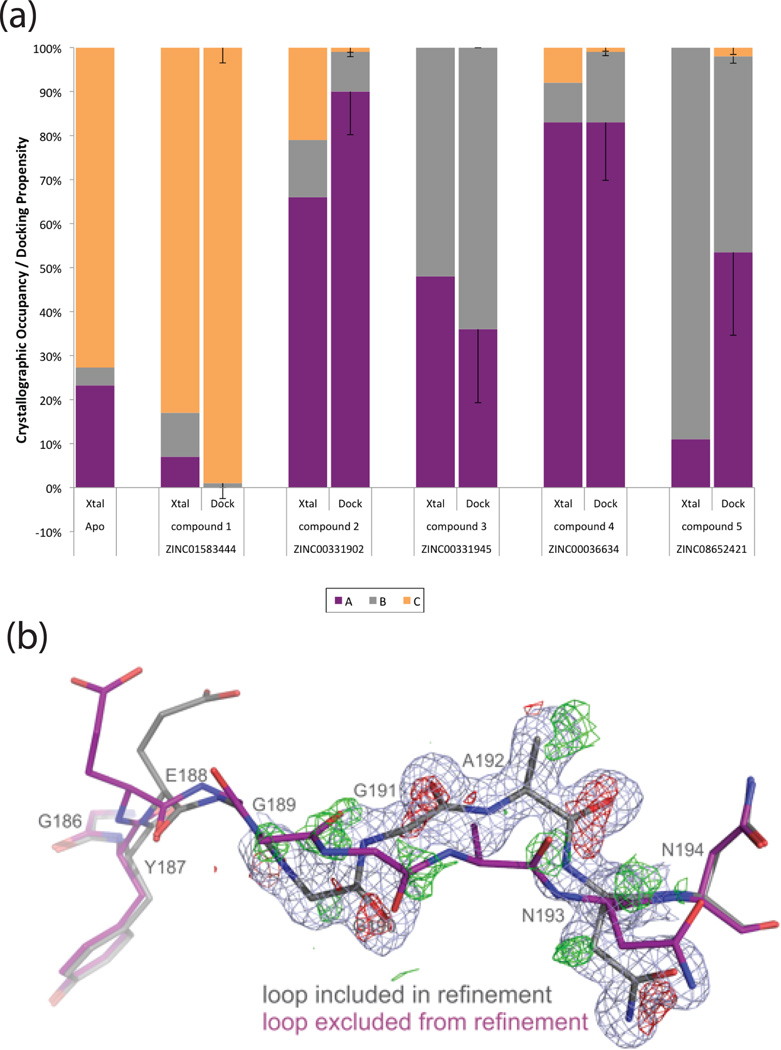
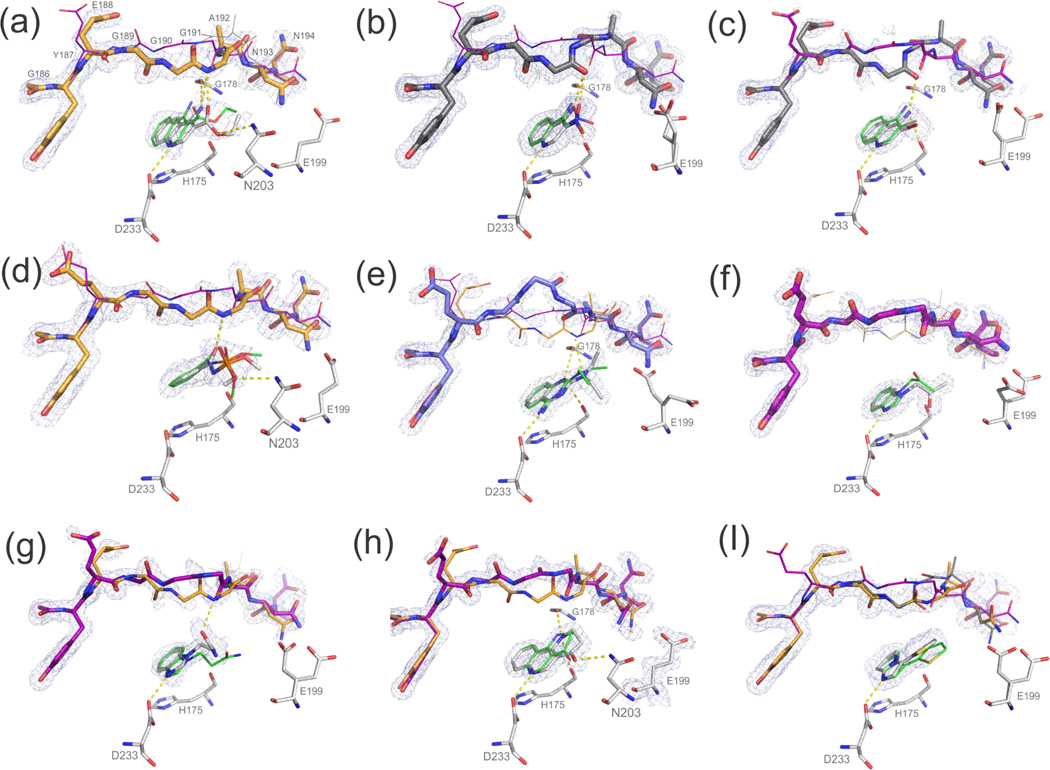
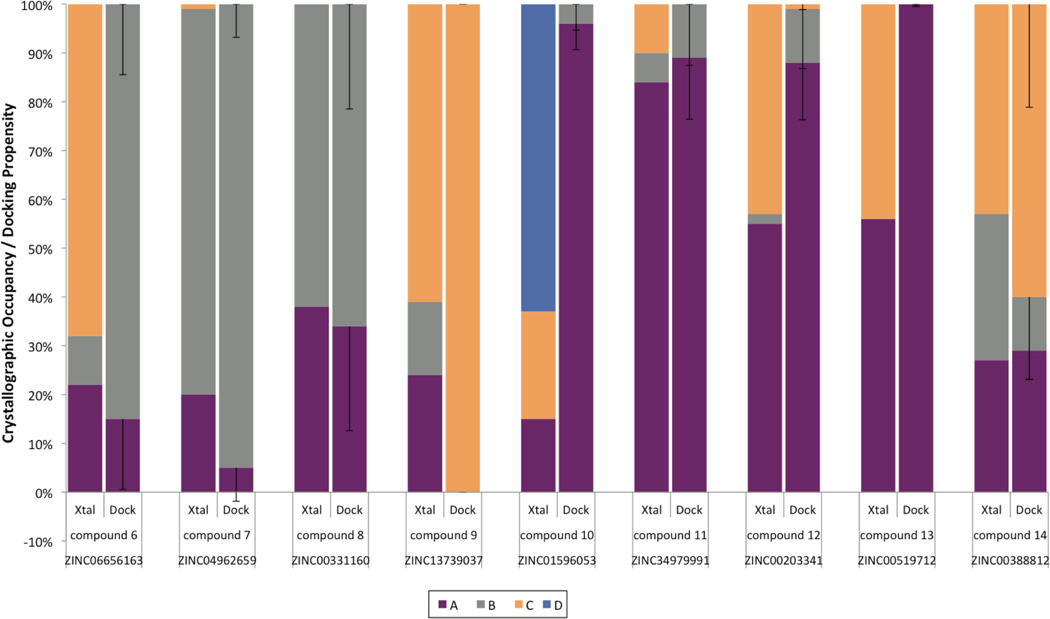
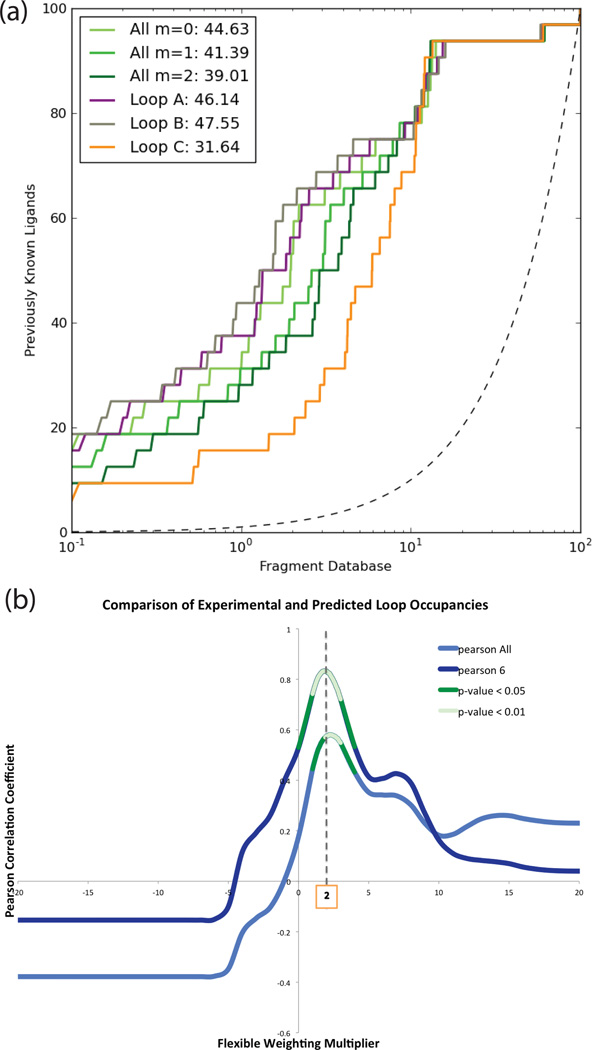
Proteins fluctuate between alternative conformations, which presents a challenge for ligand discovery because such flexibility is difficult to treat computationally owing to problems with conformational sampling and energy weighting. Here we describe a flexible docking method that samples and weights protein conformations using experimentally derived conformations as a guide. The crystallographically refined occupancies of these conformations, which are observable in an apo receptor structure, define energy penalties for docking. In a large prospective library screen, we identified new ligands that target specific receptor conformations of a cavity in cytochrome c peroxidase, and we confirm both ligand pose and associated receptor conformation predictions by crystallography. The inclusion of receptor flexibility led to ligands with new chemotypes and physical properties. By exploiting experimental measures of loop and side-chain flexibility, this method can be extended to the discovery of new ligands for hundreds of targets in the Protein Data Bank for which similar experimental information is available.


Figures

Figure 1
Figure 1. Experimental occupancies of Apo loop conformations set penalties for docking
(a) From experimental loop occupancies to docking penalties. Flexible loop (in colors) and side-chain conformations of the Apo CcP Gateless protein are assigned Boltzmann-weighted energy penalties based on their crystallographic occupancy; kB – Boltzmann constant, T – temperature in K, occ. – occupancy, m – flexible weighting multiplier (here m = 2). (b) From docking energies to loop propensities. The Boltzmann sum of the energies of all x poses for a ligand to different loops A, B, C are calculated. The result is expressed as a percentage, indicating the predicted preference of the ligand to bind to a particular loop conformation, that can be compared to the experimental occupancies. (c) Electron density shows evidence for 3 conformations of the apo loop. Electron density showing missing conformation of loops A (purple sticks) and B (grey lines) when only loop C (orange sticks) is included in the refinement is shown as blue (2mFo-DFc, 1sigma) and cyan (Fo-Fc, +1.5sigma). Stick radius according to relative occupancies (cf. Figure 2A). See Suppl. Figure 13 for more pronounced difference cyan density for loop B when including A in addition to C in refinement.
Figure 2
Figure 2. Predicting loop occupancies in holo-complexes
(A) Experimental occupancies of three flexible loop (186–194) conformations A, B and C are depicted as a percentage (Xtal). These can then easily be compared to their predicted docking propensities (dock) for compounds 1–5. Using Boltzmann energy penalties and a multiplier m=2 results in close agreement of the major loop conformation between prediction (dock) and experiment (Xtal), with a Pearson Correlation Coefficient (PCC) of 0.83, and a p-value < 0.01. Error bars for docking propensities are derived by using any flexible weighting multiplier m between 1.0 and 3.0 and taking the standard deviation. (B) The difference electron density map of CcP and compound 5 around the backbone carbonyls (red mesh for main loop in grey sticks and green for the new loop conformation) provides evidence for the presence of a second loop conformation (purple) even at very low levels around 10%. Resolution is 1.2 Å; 2mFo-DFc map rendered at 1σ and mFo-DFc map at 2.6σ.
Figure 3
Figure 3. Experimental binding poses vs. prospective docking predictions
Electron density at 1sigma shown for ligand and loop conformations. Loop stick thickness corresponds to experimentally observed occupancies; coloring as before with loop conformation A in purple, B in grey, C in orange and D (for compound 10) in blue. Superposition of ligand poses with experimental in grey versus docked in green. (a) compound 6, (b) 7, (c) 8, (d) 9, (e) 10, (f) 11, (g) 12, (h) 13, (i) 14. For clarity, co-crystallized MES for compounds 6 (a), 9 (d) and 12 (g) has been omitted.
Figure 4
Figure 4. Predicting loop occupancies in bound complexes
The loop occupancies and predicted propensities for compounds 6–14 are shown, with crystallographic occupancies at left and predicted loop propensities (with m = 2) at right in each pair. Error bars for the loop propensity represent the standard deviation of the occupancies by varying the flexible weighting multiplier m from 1 to 3. The major loop conformation is predicted correctly for all cases but compound 10 that prefers a fourth loop, D, conformation that was not modeled; compounds 6 and 12 have a larger C loop presence due to the partial presence of MES.
Figure 5
Figure 5. Enrichment alone cannot distinguish first-in-class from best-in-class
(a) Retrospective enrichment of known ligands against decoys (adjusted logAUC) for loops A, B, and C individually (colored as purple, grey and orange) and combined with different multipliers (tones of green). Adjusted area under the log ROC plot is shown in the legend (cf. Suppl. Table 6 for other common performance metrics). (b) Pearson correlation of experimental and predicted loop occupancies with statistically significant areas highlighted in green (dark green for p-values < 0.05; light green for p < 0.01). Pearson All is for all 9 compounds, Pearson 6 is the correlation only considering compounds 7, 8, 9, 11, 13 and 14, where results are not distorted by a partial presence of MES.

Comment in

References

    1. Baldwin AJ, Kay LE. NMR spectroscopy brings invisible protein states into focus. Nat Chem Biol. 2009;5:808–814. - PubMed
    1. Koveal D, Clarkson MW, Wood TK, Page R, Peti W. Ligand Binding Reduces Conformational Flexibility in the Active Site of Tyrosine Phosphatase Related to Biofilm Formation A (TpbA) from Pseudomonas aeruginosa. Journal of Molecular Biology. 2013;425:2219–2231. - PMC - PubMed
    1. Burnley BT, Pavel VA, Paul DA, Piet G. Modelling dynamics in protein crystal structures by ensemble refinement. eLife Sciences. 2012;1 - PMC - PubMed
    1. Fraser JS, et al. Hidden alternative structures of proline isomerase essential for catalysis. Nature. 2009;462:669–673. - PMC - PubMed
    1. Fraser JS, et al. Accessing protein conformational ensembles using room-temperature X-ray crystallography. Proceedings of the National Academy of Sciences. 2011;108:16247–16252. - PMC - PubMed

Publication types