. 2014 Jun 20;9(6):e100042.
doi: 10.1371/journal.pone.0100042. eCollection 2014.

A microfluidic system for studying ageing and dynamic single-cell responses in budding yeast

Affiliations

A microfluidic system for studying ageing and dynamic single-cell responses in budding yeast

Matthew M Crane et al. PLoS One. .

Abstract

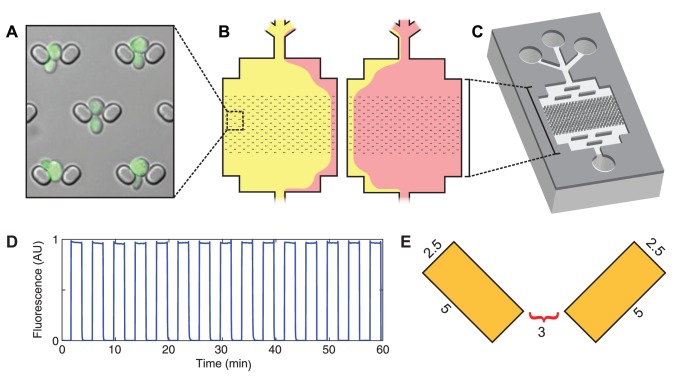
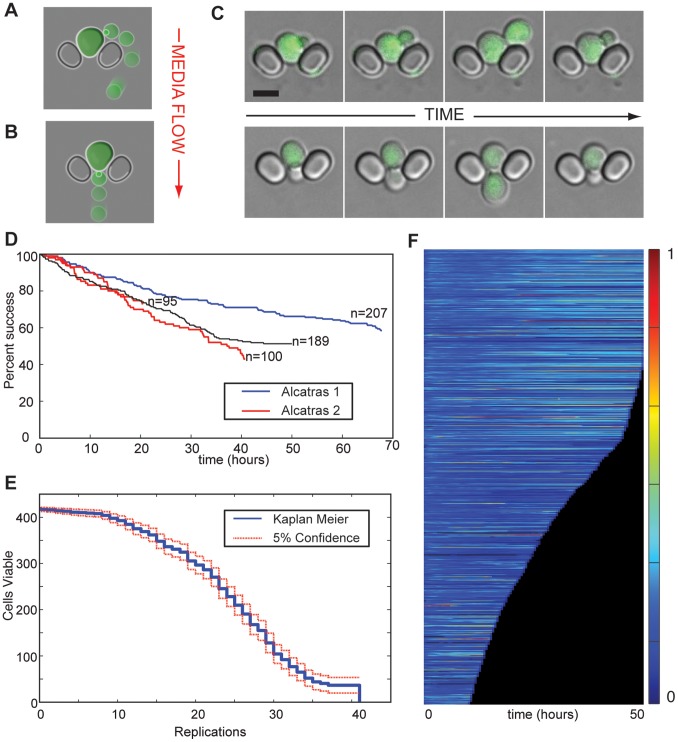
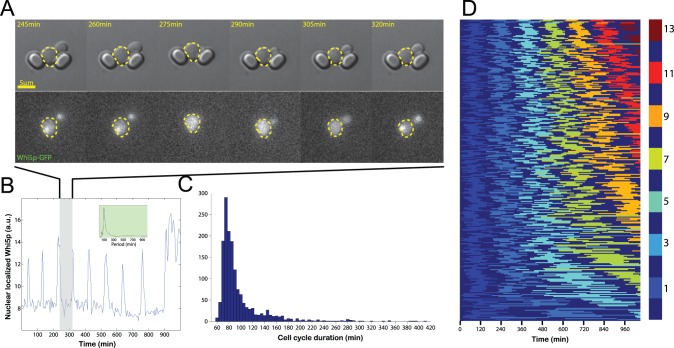
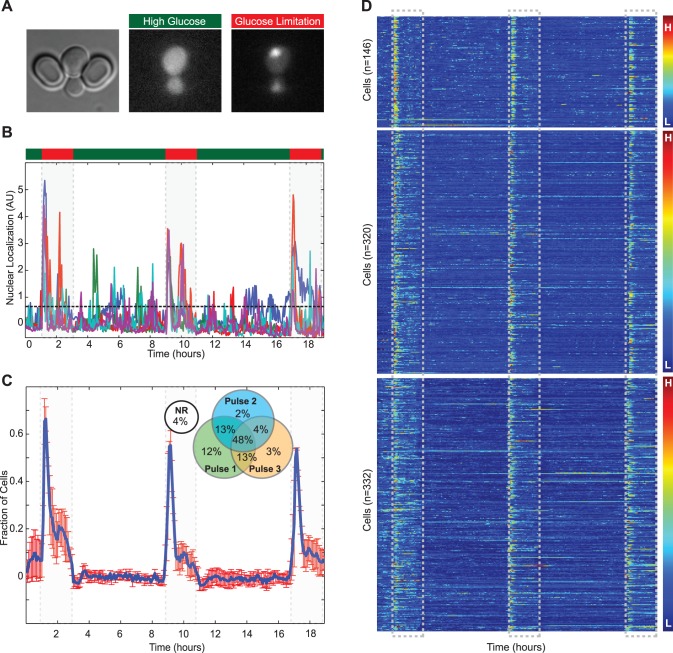
Recognition of the importance of cell-to-cell variability in cellular decision-making and a growing interest in stochastic modeling of cellular processes has led to an increased demand for high density, reproducible, single-cell measurements in time-varying surroundings. We present ALCATRAS (A Long-term Culturing And TRApping System), a microfluidic device that can quantitatively monitor up to 1000 cells of budding yeast in a well-defined and controlled environment. Daughter cells are removed by fluid flow to avoid crowding allowing experiments to run for over 60 hours, and the extracellular media may be changed repeatedly and in seconds. We illustrate use of the device by measuring ageing through replicative life span curves, following the dynamics of the cell cycle, and examining history-dependent behaviour in the general stress response.


Conflict of interest statement

Competing Interests: The authors have declared that no competing interests exist.

Figures

Figure 1
Figure 1. Overview of ALCATRAS.
A) A DIC image of the cell traps. The cells are expressing Doa1p-GFP, and the fluorescence image has been overlaid with the DIC image for clarity. Traps consist of two vertical pillars that trap mother cells and allow daughters to flow away. The small size of the traps permits a high density of cells in the field of view (more than 40 mother cells can be imaged at 60x magnification in ALCATRAS 1). B) A schematic depicting fluid flow in the flow cell during media switching. Switching occurs within six seconds by changing the flow rate of syringe pumps. C) Overview of the microfluidic device. Each device contains more than 1500 individual traps. D) The switching rate and reliability of media switching in traps. Media switching was assayed using 0.1% fluorescein in one of the two media. E) Schematic showing trap dimensions in microns.
Figure 2
Figure 2. Operation of ALCATRAS.
A, B) Schematics showing the removal of a daughter cell by the media flow when the mother buds at the top of the trap (A) or at the bottom (B). In both cases the flow is from top to bottom (red arrow). The newly formed daughter cells follow the streamlines shown in Fig. S1A. C) Microscopy images of removal of daughter cells in the device. The cells are expressing Doa1p-GFP, and the fluorescence image has been overlaid with the DIC image for clarity. Scale bar indicates 5 µm. D) Success rates for four ALCATRAS experiments. The number of cells retained in their original traps over the time course is plotted for two independent experiments using each of ALCATRAS 1 (red – more dense spacing of traps) or ALCATRAS 2 (blue – less dense spacing of traps). Only cells that were present in the traps at the first time point are included. Results were scored manually from a random subset of the fields imaged. Numbers include cells that have visibly died during the experiment. For a more detailed breakdown of cell loss and replacement, see Fig. S3. Flow rates were 2 µl/min from each input syringe pump (4 µl/min total). E) Cell viability plotted as a function of the number of replications (n = 422). Cells were observed for 62 hours, and replicative lifespans were scored manually. The mean lifespan is 22.4. Flow rates were 2 µl/min from each input syringe pump (4 µl/min total). F) Kymograph showing Hsp104-GFP expression over time with imaging every 10 mins. The median fluorescence intensity within the area of each cell (n = 1003) at each time point is shown by the colour map. Only cells that are present during the first hour of the experiment and that remain in their original traps for at least 10 hours are shown.
Figure 3
Figure 3. Cell cycle dynamics in ALCATRAS.
A) Frames from a time-lapse movie showing a cell expressing Whi5p-GFP across one cell cycle. Fluorescence is localized in the nucleus during late M and early G1 phases. B) Plot of the nuclear localization of Whi5p over time for the cell shown in A. Frames in A are from the shaded period. Over many hours the cell undergoes a large number of cell cycles, resulting in a strongly periodic signal. The inset shows the power spectrum derived from applying Welch’s windowing algorithm and the Fourier transform to this data with a single peak at the frequency of the cell cycle. C) Histogram showing the distribution of cell cycle times of mother cells undergoing their first three divisions in ALCATRAS. D) Kymograph illustrating the change in replicative age of individual cells during the experiment. To aid visualization of the cell cycle, each alternate division is marked by a different colour. The total number of divisions undergone in the device when odd is shown by the colour map; even numbers of division are depicted in dark blue. Cells have been ordered by their number of divisions, and only cells that remain alive and in their original traps throughout are illustrated (299 cells). Flow rates were 2 µl/min from each input syringe pump (4 µl/min total).
Figure 4
Figure 4. Stress response and learning.
A) An image of a cell in ALCATRAS expressing Msn2p-GFP. Under conditions of high glucose, the majority of signal is localized to the cytoplasm, but almost immediately upon glucose limitation becomes nuclear localized. B) Nuclear localization of five single cells under repeated glucose limitation. Media was repeatedly switched from high glucose (2% - green) for 6 hours to low glucose (0.1% - red) for 2 hours. The dashed line shows the threshold for classification of Msn2p-GFP as being nuclear localized. C) Fraction of cells with nuclear localized Msn2p-GFP (n = 3 experiments, error bars are SEM.) (Inset) A Venn diagram showing the fraction of cells that respond for each of the three pulses over all experiments. The difference in number of cells responding to each of the three pulses was statistically significant (p<0.01). D) A kymograph showing the single cell traces and results for all cells (n = 146, 320, 332). Flow rates were 4.5 µl/min (dominant pump) and 0.5 µl/min. The rates were reversed for media switching which was confirmed by inclusion of cy5 dye in one of the media reservoirs.

References

    1. Shahrezaei V, Swain PS (2008) The stochastic nature of biochemical networks. Curr Opin Biotechnol 19: 369–374. - PubMed
    1. Eldar A, Elowitz MB (2010) Functional roles for noise in genetic circuits. Nature 467: 167–173. - PMC - PubMed
    1. Raj A, van Oudenaarden A (2008) Nature, nurture, or chance: stochastic gene expression and its consequences. Cell 135: 216–226. - PMC - PubMed
    1. Pedraza JM, van Oudenaarden A (2005) Noise propagation in gene networks. Science 307: 1965–1969. - PubMed
    1. Raser JM, O’Shea EK (2005) Noise in gene expression: origins, consequences, and control. Science 309: 2010–2013. - PMC - PubMed

Publication types