. 2014 Jun 20:12:176.
doi: 10.1186/1479-5876-12-176.

Gene expression identifies heterogeneity of metastatic behavior among high-grade non-translocation associated soft tissue sarcomas

Affiliations

Gene expression identifies heterogeneity of metastatic behavior among high-grade non-translocation associated soft tissue sarcomas

Keith M Skubitz et al. J Transl Med. .

Abstract

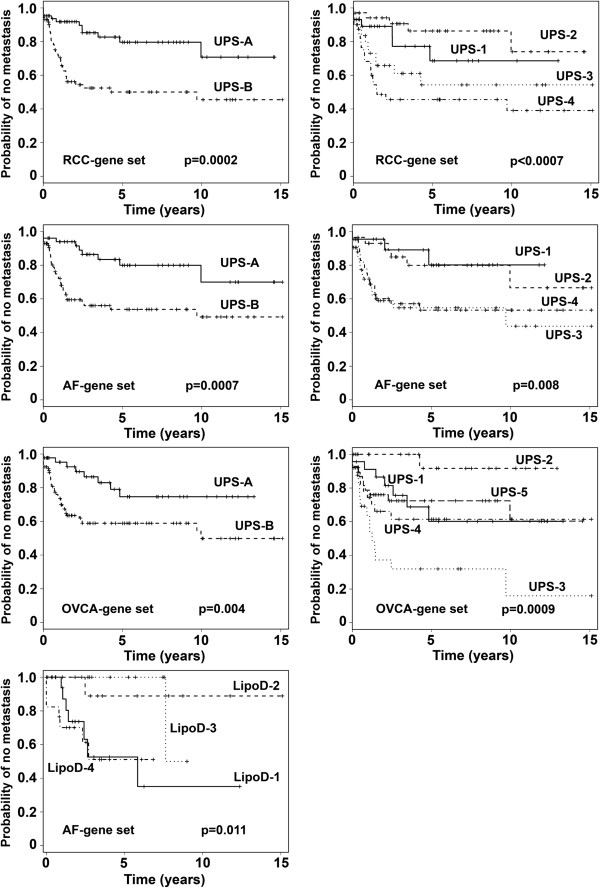
Background: The biologic heterogeneity of soft tissue sarcomas (STS), even within histological subtypes, complicates treatment. In earlier studies, gene expression patterns that distinguish two subsets of clear cell renal carcinoma (RCC), serous ovarian carcinoma (OVCA), and aggressive fibromatosis (AF) were used to separate 73 STS into two or four groups with different probabilities of developing metastatic disease (PrMet). This study was designed to confirm our earlier observations in a larger independent data set.

Methods: We utilized these gene sets, hierarchical clustering (HC), and Kaplan-Meier analysis, to examine 309 STS, using Affymetrix chip expression profiling.

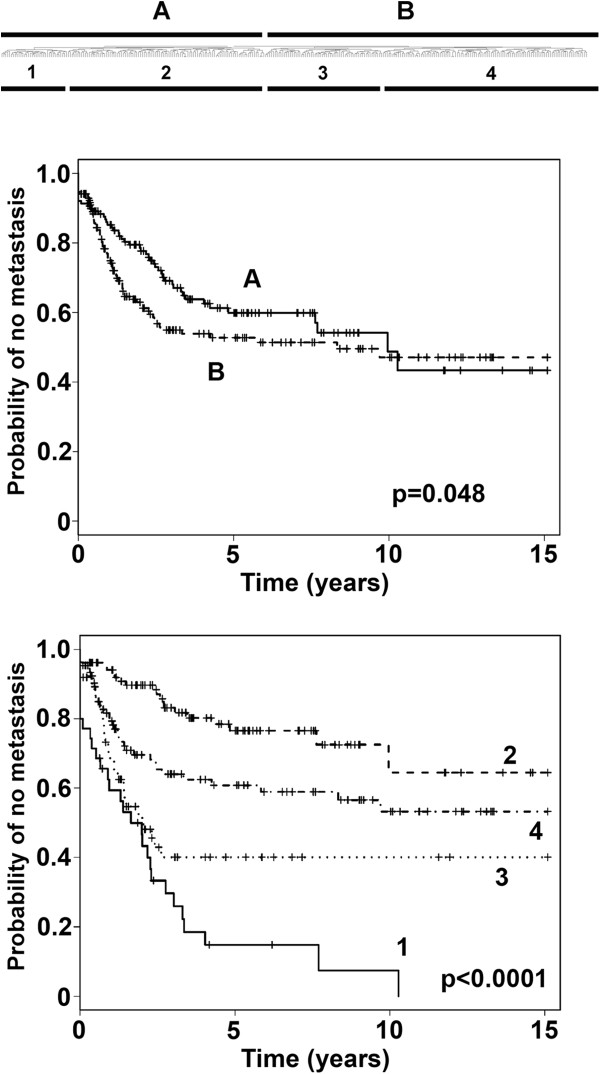
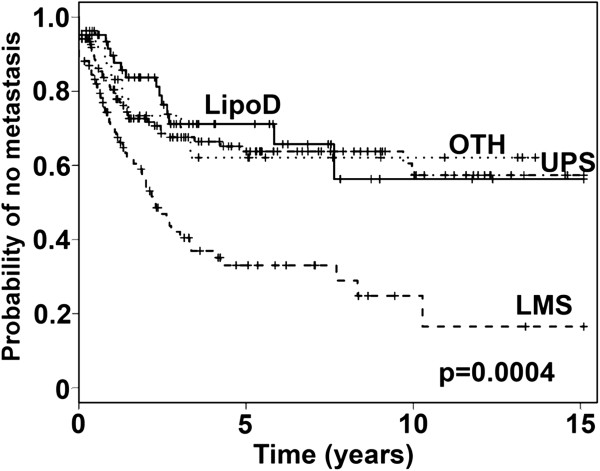
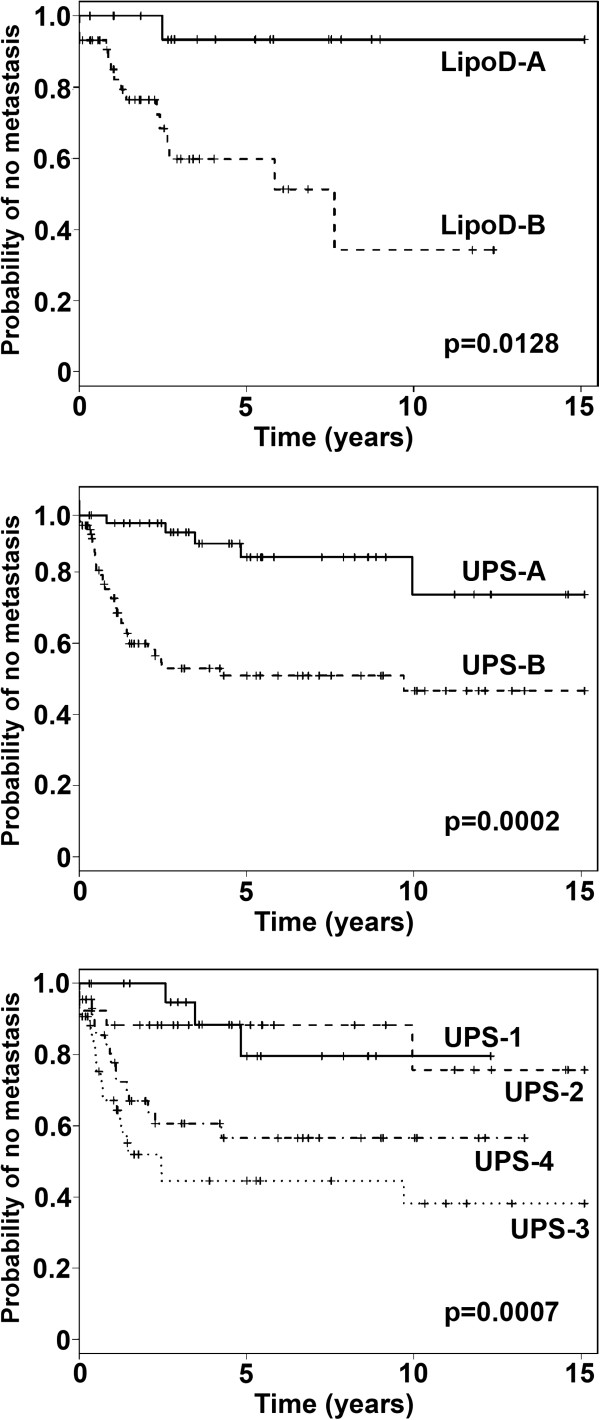
Results: HC using the combined AF-, RCC-, and OVCA-gene sets identified subsets of the STS samples. Analysis revealed differences in PrMet between the clusters defined by the first branch point of the clustering dendrogram (p = 0.048), and also among the four different clusters defined by the second branch points (p < 0.0001). Analysis also revealed differences in PrMet between the leiomyosarcomas (LMS), dedifferentiated liposarcomas (LipoD), and undifferentiated pleomorphic sarcomas (UPS) (p = 0.0004). HC of both the LipoD and UPS sample sets divided the samples into two groups with different PrMet (p = 0.0128, and 0.0002, respectively). HC of the UPS samples also showed four groups with different PrMet (p = 0.0007). HC found no subgroups of the LMS samples.

Conclusions: These data confirm our earlier studies, and suggest that this approach may allow the identification of more than two subsets of STS, each with distinct clinical behavior, and may be useful to stratify STS in clinical trials and in patient management.


Figures

Figure 1
Figure 1
Top: clustering of gene expression in the 309 high-grade STS samples using the Eisen clustering software Cluster. The samples were clustered by complete-linkage hierarchical clustering with uncentered correlation using the Eisen clustering software Cluster and the 533 probes present in the pooled gene set as described in the text. Groups A and B are defined by the first branch point in the clustering. Groups 1–4 are defined by the second branch points. Middle and bottom: Kaplan-Meier analysis of the time to development of metastases of the two groups (groups A and B) and four groups (groups 1–4), defined by the first and second break points, respectively, of the hierarchical clustering. The time to development of metastasis differed between groups A and B (p = 0.048), and groups 1–4 (p < 0.0001) (see Additional file 1: Table S1).
Figure 2
Figure 2
Kaplan-Meier analysis of the time to development of metastases of the four groups of LMS, LipoD, UPS, and OTH samples. The time to development of metastasis differed between the groups, p = 0.0004 (see Additional file 1: Table S1).
Figure 3
Figure 3
Kaplan-Meier analysis of the time to development of metastases of the two groups of LipoD samples (groups A and B), defined by the first break point of the hierarchical clustering with the pooled probe set (top panel). The time to development of metastasis differed between groups A and B, p = 0.0128. Analysis of the time to development of metastases of the two groups (groups A and B) (middle panel), and four groups (groups 1–4) of UPS samples (bottom panel) defined by the first and second break points, respectively, of the hierarchical clustering with the pooled probe set. The time to development of metastasis differed between groups A and B, p = 0.0002, and groups 1–4, p = 0.0007 (see Additional file 1: Table S1).
Figure 4
Figure 4
Top panel: Kaplan-Meier analysis of the time to development of metastases of the two groups (groups A and B) and the four groups (groups 1–4) of UPS samples, defined by the first and second break points of the hierarchical clustering with the RCC-gene set. The time to development of metastasis differed between groups A and B, p = 0.0002 and groups 1–4, p < 0.0007 (see Additional file 1: Table S1). Second row: Kaplan-Meier analysis of the time to development of metastases of the two (groups A and B) and four groups (groups 1–4) of UPS samples defined by the first and second break points, respectively, of the hierarchical clustering with the AF-gene set. The time to development of metastasis differed between groups A and B, p = 0.0007, and groups 1–4, p = 0.008 (see Additional file 1: Table S1). Third row: Kaplan-Meier analysis of the time to development of metastases of the two groups (groups A and B), and five groups (groups 1–5) of the UPS samples, defined by the first break point, and visual separation of the break points, respectively, of the hierarchical clustering with the OVCA-gene set. The time to development of metastasis differed between groups A and B, p = 0.004, and between groups 1–5, p = 0.0009 (see Additional file 1: Table S1). Bottom row: Kaplan-Meier analysis of the time to development of metastases of the four groups of LipoD samples defined by the second break points of the hierarchical clustering with the AF-gene set, p = 0.011 (see Additional file 1: Table S1).

References

    1. Helias-Rodzewicz Z, Pedeutour F, Coindre JM, Terrier P, Aurias A. Selective elimination of amplified CDK4 sequences correlates with spontaneous adipocytic differentiation in liposarcoma. Genes Chromosomes Cancer. 2009;48(11):943–952. - PubMed
    1. Ladanyi M, Bridge JA. Contribution of molecular genetic data to the classification of sarcomas. Hum Pathol. 2000;31(5):532–538. - PubMed
    1. Mitelman F. Recurrent chromosome aberrations in cancer. Mutat Res. 2000;462(2–3):247–253. - PubMed
    1. Skubitz KM, D’Adamo DR. Sarcoma. Mayo Clin Proc. 2007;82(11):1409–1432. - PubMed
    1. van de Rijn M, Fletcher JA. Genetics of soft tissue tumors. Annu Rev Pathol. 2006;1:435–466. - PubMed

Publication types