. 2014 Sep 1;74(17):4875-87.
doi: 10.1158/0008-5472.CAN-13-3579. Epub 2014 Jun 20.

TRIM29 suppresses TWIST1 and invasive breast cancer behavior

Affiliations

TRIM29 suppresses TWIST1 and invasive breast cancer behavior

Lingbao Ai et al. Cancer Res. .

Abstract

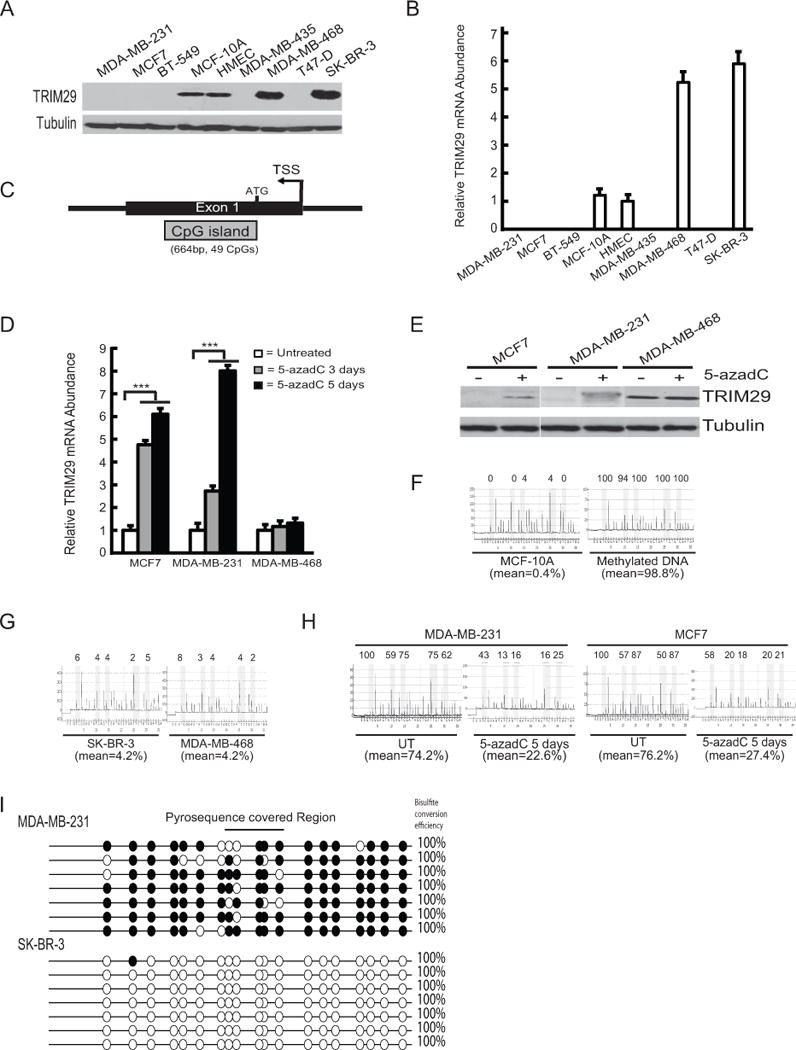
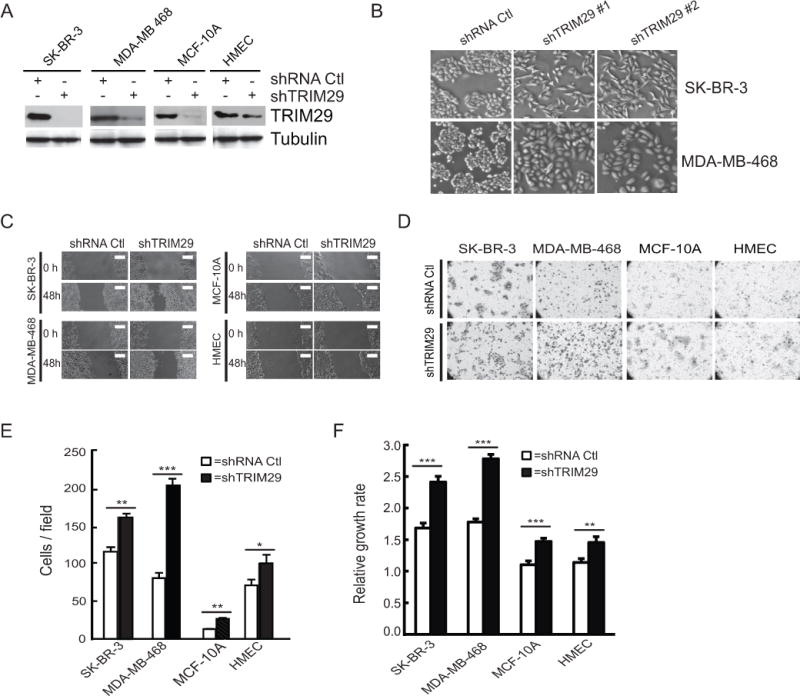
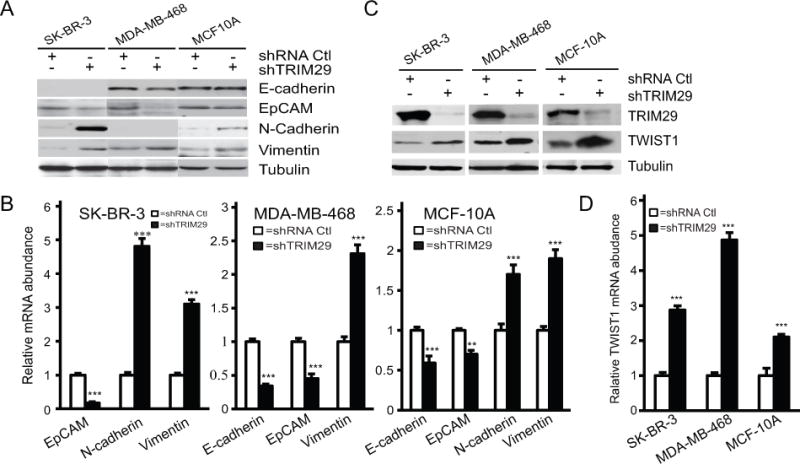
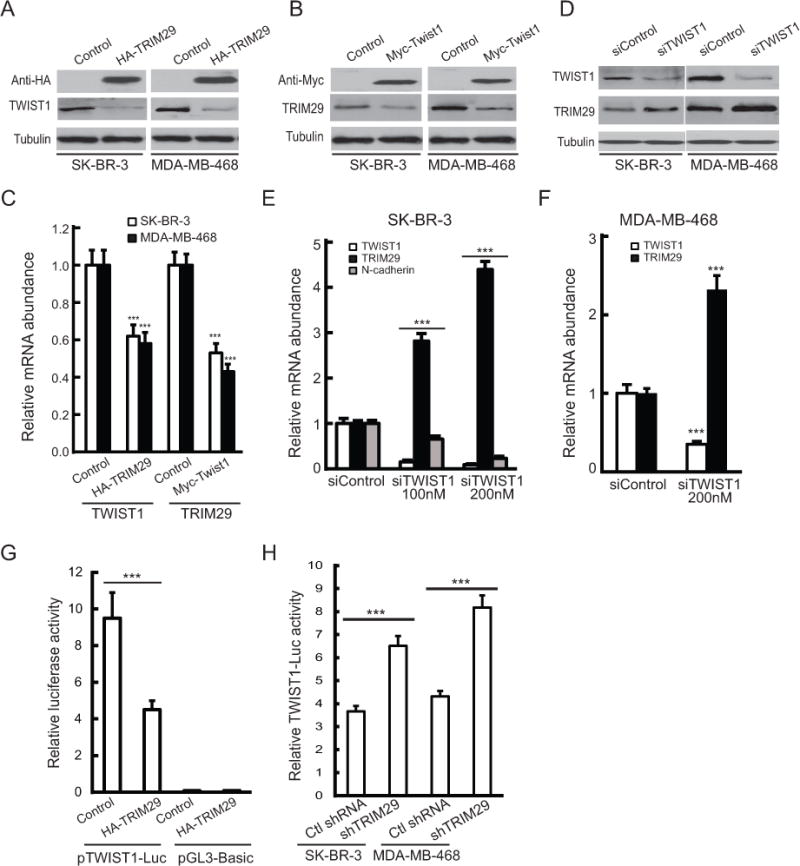
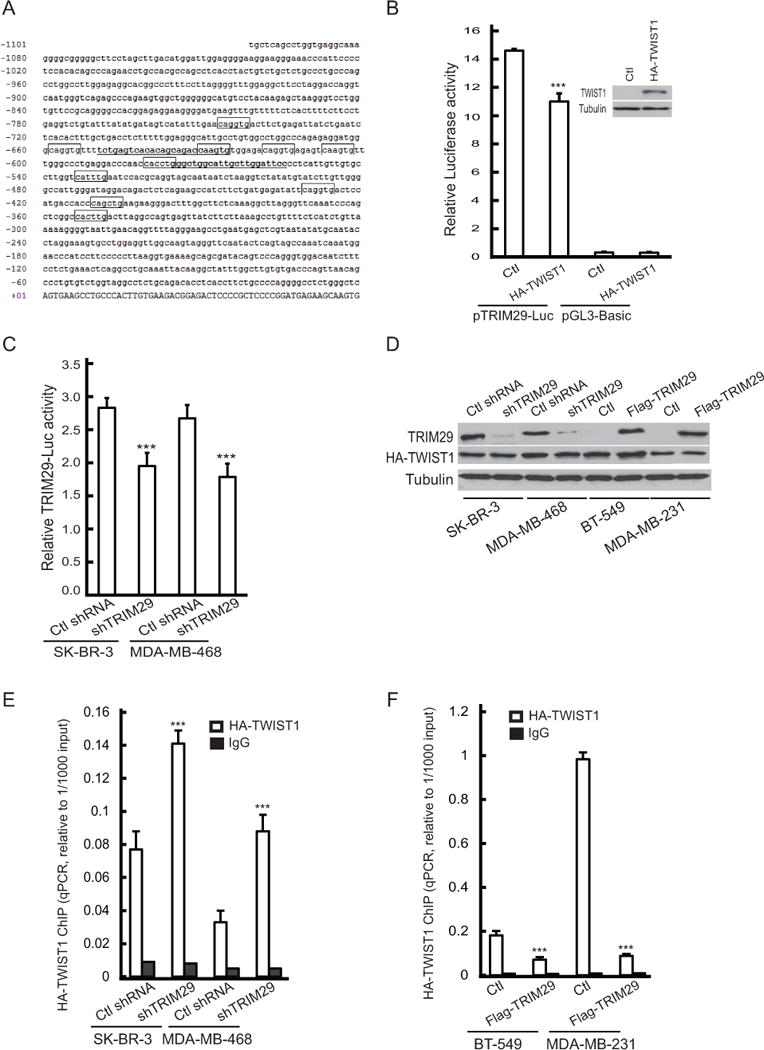
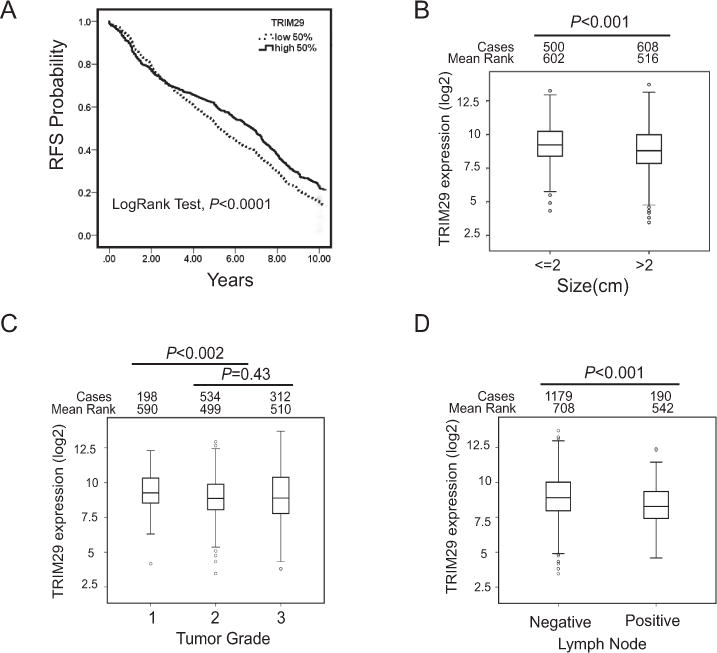
TRIM29 (ATDC) exhibits a contextual function in cancer, but seems to exert a tumor-suppressor role in breast cancer. Here, we show that TRIM29 is often silenced in primary breast tumors and cultured tumor cells as a result of aberrant gene hypermethylation. RNAi-mediated silencing of TRIM29 in breast tumor cells increased their motility, invasiveness, and proliferation in a manner associated with increased expression of mesenchymal markers (N-cadherin and vimentin), decreased expression of epithelial markers (E-cadherin and EpCAM), and increased expression and activity of the oncogenic transcription factor TWIST1, an important driver of the epithelial-mesenchymal transition (EMT). Functional investigations revealed an inverse relationship in the expression of TRIM29 and TWIST1, suggesting the existence of a negative regulatory feedback loop. In support of this relationship, we found that TWIST1 inhibited TRIM29 promoter activity through direct binding to a region containing a cluster of consensus E-box elements, arguing that TWIST1 transcriptionally represses TRIM29 expression. Analysis of a public breast cancer gene-expression database indicated that reduced TRIM29 expression was associated with reduced relapse-free survival, increased tumor size, grade, and metastatic characteristics. Taken together, our results suggest that TRIM29 acts as a tumor suppressor in breast cancer through its ability to inhibit TWIST1 and suppress EMT.


Conflict of interest statement

The authors disclose no potential conflicts of interest

Figures

Figure 1
Figure 1. TRIM29 expression is epigenetically silenced in breast cancer cell lines
A. Immunoblot analysis of lysates prepared from indicated breast tumor and non-turmorigenic lines probed with anti-TRIM29 and Tubulin (loading control). B. Cell lines were assayed for relative TRIM29 transcript abundance by qRT-PCR. C. Structure of the 5′ flank and exon 1 of the human TRIM29 gene. Indicated is the transcriptional start site (TSS), the translational start site (ATG), and associated CpG island. D. MCF7, MDA-MB-231, or MDA-MB-468 cells were untreated (open bars), or treated with 5-azadC for three (shaded bars) or five (filled bars) days and TRIM29 mRNA measured by qRT-PCR. E. MCF7, MDA-MB-231, and MDA-MB-468 cells were cultured with or without 5-azadC for 5 days and extracts immunoblotted for TRIM29 or Tubulin. F. Genomic DNA harvested from MCF-10A cells or human genomic DNA methylated in vitro was bisulfite modified and analyzed for TRIM29 gene methylation by pyrosequencing. Shown are representative pyrograms, % methylation at each CpG analyzed, and the mean % methylation over the region analyzed. G. Genomic DNA was harvested from SK-BR-3 and MDA-MB-468 cells and analyzed by pyrosequencing. H. Genomic DNA was harvested from untreated (UT) MDA-MB-231 and MCF7 cells or after culture with 5-azadC for 5 days and analyzed by pyrosequencing. I. Representative bisulfite sequencing results from MDA-MB-231 and SK-BR-3 cells; filled=methylated CpG, open=unmethylated CpG. Indicated is the region covered by pyrosequencing (top), and bisulfite conversion efficiency (right). Error bars = 1.0 SE; (*** indicates P<0.001, Student’s t-test).
Figure 2
Figure 2. Aberrant hypermethylation of the TRIM29 gene is associated with reduced expression in primary breast tumors
A. Genomic DNA was harvested from normal mammary tissues (Br-N7, Br-N10) and primary breast tumor specimens (Br-T8, Br-T16, Br-T18) and analyzed by pyrosequencing. B. TRIM29 gene methylation was measured in normal breast tissues and primary breast tumors by pyrosequencing. C. Normal breast tissue and primary breast tumors were assayed for relative TRIM29 mRNA abundance by qRT-PCR. D. Shown is a scatterplot graphing relative TRIM29 mRNA abundance and TRIM29 gene methylation measured within the group of 18 breast tumors with low relative TRIM29 mRNA levels. Regression line was drawn using exponential regression, indicated is the coefficient of determination (R2) and calculated P value (Spearman correlation).
Figure 3
Figure 3. TRIM29 knockdown in breast tumor and control lines increases cell motility, invasiveness, and growth
A. SK-BR-3, MDA-MB-468, MCF-10A, and HMEC cells were transduced with lentivirus prepared from empty pLKO.1 plasmid (shRNA Ctl) or plasmid encoding a TRIM29-specific shRNA sequence (shTRIM29) and following selection were immunoblotted with anti-TRIM29 or Tubulin. B. Representative phase-contrast images of SK-BR-3 and MDA-MB-468 cells transduced with shRNA Ctl or two independent shTRIM29 vectors (#1, #2). Note that these two different breast cancer cell lines show similar cell morphology changes (a mesenchymal-like phenotype) when TRIM29 is knocked down with two independent shRNAs. C. Cultures were wounded with a pipette tip and photographed directly (0 hr) and 48 hr after wounding. Scale bar=350 μm. D. Representative micrographs of control and TRIM29 knockdown cells that have invaded through a Matrigel membrane. E. Invaded cells were counted in control (open bars) and TRIM29 knockdown (filled bars) lines in ten randomly chosen fields, average cells/field is graphed. F. Relative growth rates of control (open bars) and TRIM29 knockdown (filled bars) lines were determined using CellTiter Blue Reagent. Error bars = 1.0 SE. (* indicates P<0.05; ** indicates P<0.01, *** indicates P<0.001, Student’s t-test).
Figure 4
Figure 4. TRIM29 knockdown alters gene expression patterns and increased expression of TWIST1
A. Indicated control and TRIM29 knockdown lines were immunoblotted for E-cadherin, EpCAM, N-cadherin, Vimentin, and Tubulin. B. qRT-PCR analysis of relative mRNA abundance of indicated marker genes in control (open bars) and TRIM29 knockdown (filled bars) lines. C. Immunoblot analysis of TWIST1, TRIM29, and Tubulin in indicated control and TRIM29 knockdown cell lines. D. Relative TWIST1 transcript abundance was measured in indicated control (open bars) and TRIM29 knockdown (filled bars) cell lines. Error bars = 1.0 SE. (** indicates P<0.01, *** indicates P<0.001, Student’s t-test).
Figure 5
Figure 5. TWIST1 and TRIM29 exhibit a reciprocal relationship
A. SK-BR-3 or MDA-MB-468 cells were transiently transfected with empty pcDNA 3.1 (control) or plasmid encoding HA-tagged TRIM29 and immunoblotted with anti-HA, TWIST1, or Tubulin. B. SK-BR-3 or MDA-MB-468 cells were transiently transfected with Myc-GFP-pCS3 (control) or plasmid encoding Myc-tagged Twist1. Lysates were immunoblotted with anti-Myc, TRIM29, or Tubulin. C. SK-BR-3 (open bars) and MDA-MB-468 (filled bars) cells were transfected with respective control plasmid, plasmid encoding HA-tagged TRIM29 or Myc-tagged Twist1. 48 hr post-transfection cells were harvested, RNA isolated, and analyzed by qRT-PCR for TWIST1 or TRIM29 mRNA abundance. D. SK-BR-3 or MDA-MB-468 cells were transfected with 200 nM control (siControl) or TWIST1-specific siRNA (siTWIST1) and 48 hr post-transfection cells were harvested, lysed and immunoblotted for TWIST1, TRIM29, or Tubulin. E. SK-BR-3 cells were transfected with control, 100 nM, or 200 nM TWIST1-specific siRNA, and 48 hr post-transfection cells harvested, total RNA isolated, and qRT-PCR conducted to analyze TWIST1 (open bars), TRIM29 (filled bars), or N-cadherin (shaded bars) mRNA abundance. F. MDA-MB-468 cells were transfected with control or TWIST1-specific siRNA and qRT-PCR conducted to analyze TWIST1 (open bars) or TRIM29 (filled bars) mRNA abundance. G. HEK-293T cells were transfected with either pGL3-TWIST-Luc or empty pGL3-Basic, and co-transfected with either pcDNA 3.1 (control) or plasmid encoding HA-tagged TRIM29. Lysates were measured for both firefly and Renilla luciferase and relative firefly luciferase signal calculated. H. Control and TRIM29 knockdown SK-BR-3 and MDA-MB-468 cells were transfected with pGL3-TWIST-Luc and 24 hrs post-transfection the relative luciferase signal was measured. Error bars = 1.0 SE. (*** indicates P<0.001, Student’s t-test).
Figure 6
Figure 6. TWIST1 associates with the TRIM29 promoter and represses its activity
A. Sequence of the 5′ flank of the human TRIM29 gene. Illustrated is the transcriptional start site (nt # +01), canonical E-box elements are boxed, location of primers used in ChIP are underlined. B. pTRIM29-Luc or pGL3-Basic was co-transfected into HEK-293T along with plasmid encoding recombinant HA-TWIST1 or empty pcDNA 3.1 (Ctl). Inset: Immunoblot showing transient TWIST1 expression in cells transfected with indicated plasmid. C. SK-BR-3 and MDA-MB-468 cells with and without TRIM29 knockdown were transfected with pTRIM29-Luc and relative luciferase activity measured 24 hrs post-transfection. D. SK-BR-3 and MDA-MB-468 cells with and without TRIM29 knockdown, or BT-549 and MDA-MB-231 control cells or those stably expressing Flag-tagged TRIM29 were transiently transfected with a plasmid encoding HA-tagged TWIST1. Cell extracts were assayed by immunoblotting with anti-TRIM29, anti-HA, and anti-Tubulin. E. Chromatin was harvested from HA-TWIST1 expressing SK-BR-3 and MDA-MB-468 cells with and without TRIM29 knockdown and ChIP conducted with anti-HA (open bars) or non-specific mouse IgG (filled bars) and qPCR performed. F. Chromatin was harvested from HA-TWIST1 expressing BT-549 and MDA-MB-231 control and Flag-tagged TRIM29 expressing cells. Chromatin was immunoprecipitated with anti-HA (open bars) or non-specific mouse IgG (filled bars) and qPCR conducted. Error bars = 1.0 SE. (*** indicates P<0.001, Student’s t-test).
Figure 7
Figure 7. Reduced TRIM29 expression is associated with poorer survival and more aggressive breast cancer behavior
A. A public breast cancer database was queried to examine the association between breast cancer patient relapse-free survival (RFS) and TRIM29 gene expression. Indicated is LogRank P value, n=1,809. TRIM29 expression (log2 values) was compared in breast tumors grouped by indicated size (B), tumor grade (C), and lymph node metastasis (D). Number of cases in each group is given as well as the calculated Mean Rank and P value (Mann-Whitney test).

References

    1. Short KM, Cox TC. Subclassification of the RBCC/TRIM superfamily reveals a novel motif necessary for microtubule binding. J Biol Chem. 2006;281:8970–80. - PubMed
    1. Hatakeyama S. TRIM proteins and cancer. Nat Rev Cancer. 2011;11:792–804. - PubMed
    1. Reymond A, Meroni G, Fantozzi A, Merla G, Cairo S, Luzi L, et al. The tripartite motif family identifies cell compartments. EMBO J. 2001;20:2140–51. - PMC - PubMed
    1. Napolitano LM, Meroni G. TRIM family: Pleiotropy and diversification through homomultimer and heteromultimer formation. IUBMB Life. 2012;64:64–71. - PubMed
    1. Ozato K, Shin DM, Chang TH, Morse HC., 3rd TRIM family proteins and their emerging roles in innate immunity. Nat Rev Immunol. 2008;8:849–60. - PMC - PubMed

Publication types

MeSH terms