. 2014 Jun 20:3:e02786.
doi: 10.7554/eLife.02786.

G-protein-coupled receptor signaling and polarized actin dynamics drive cell-in-cell invasion

Affiliations

G-protein-coupled receptor signaling and polarized actin dynamics drive cell-in-cell invasion

Vladimir Purvanov et al. Elife. .

Abstract

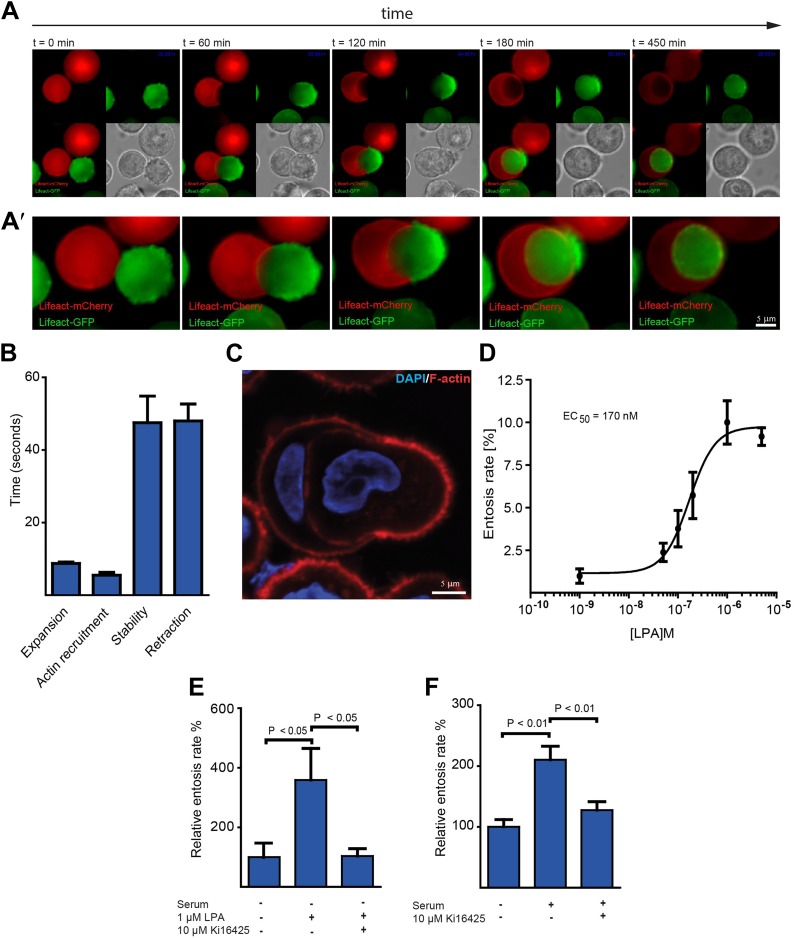
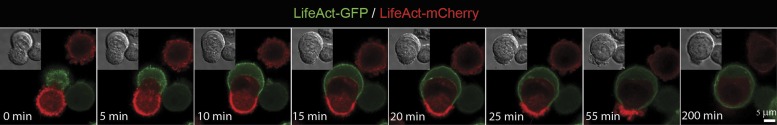
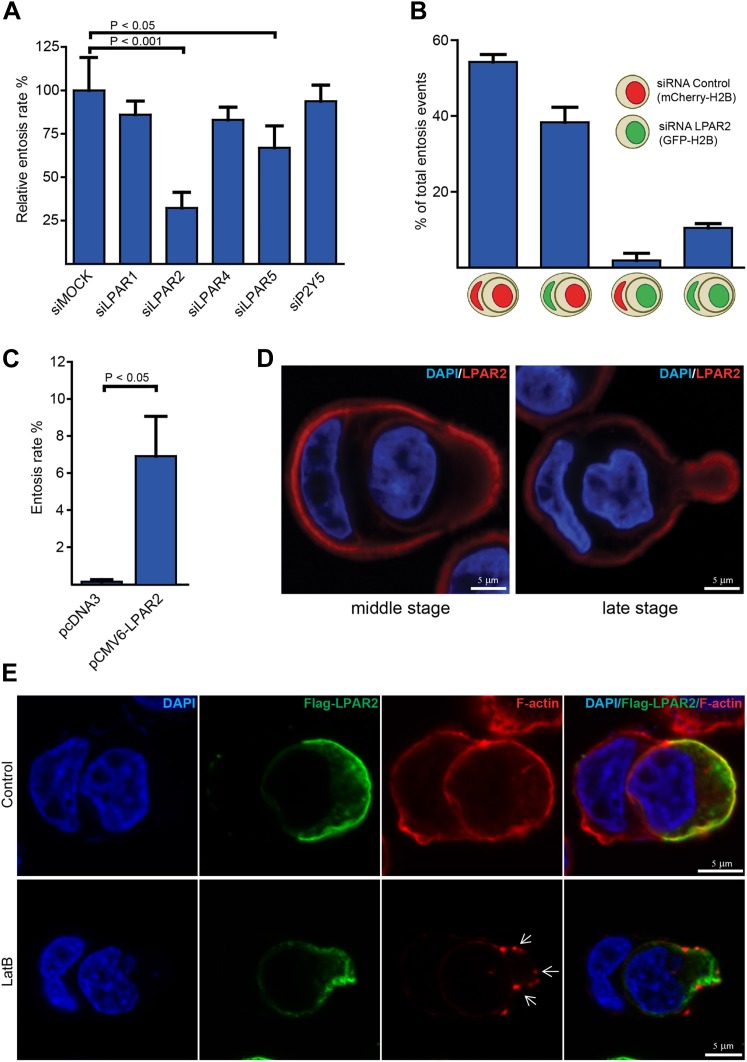
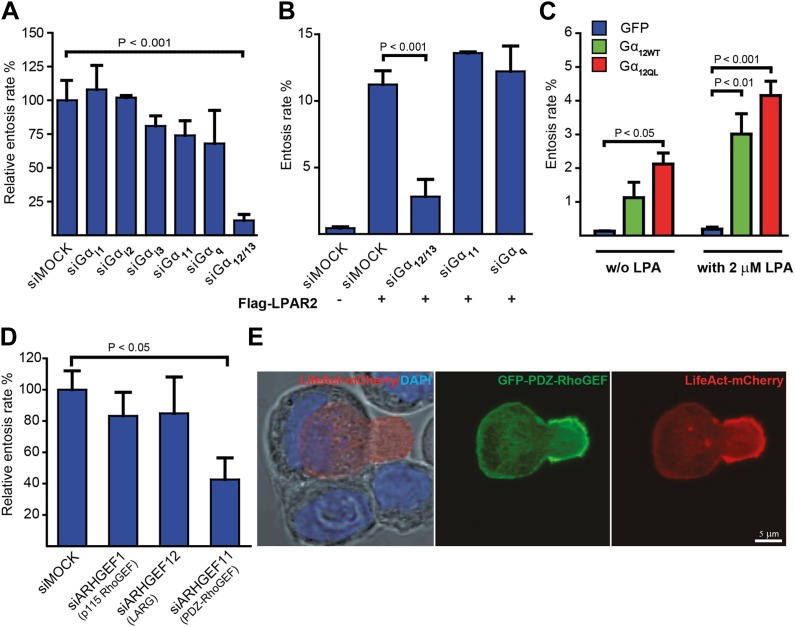
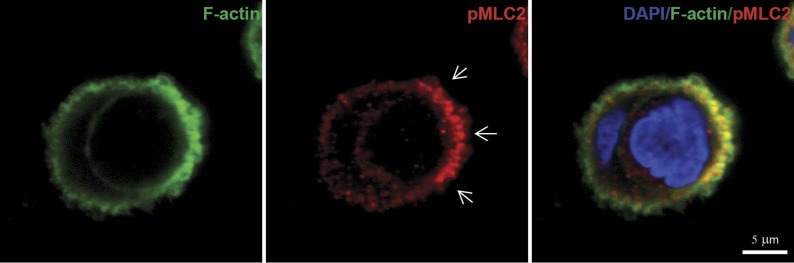
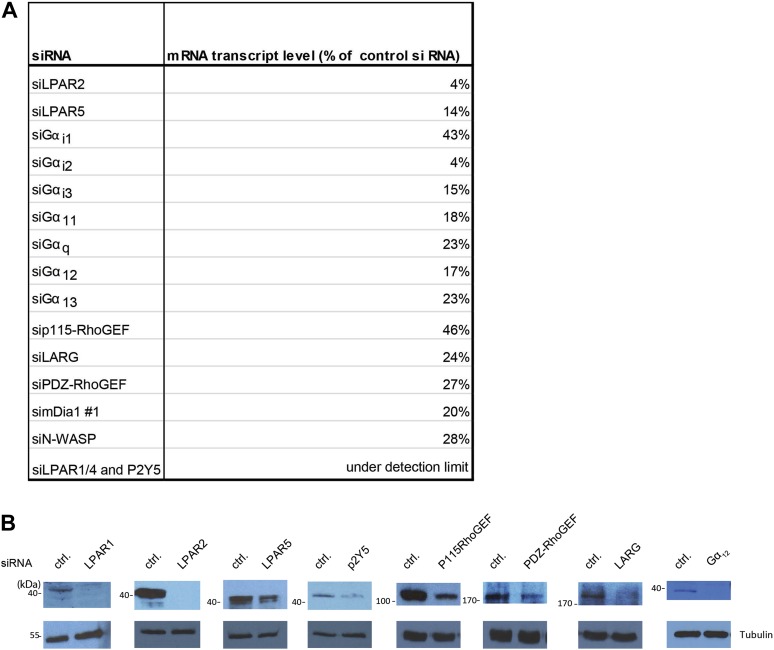
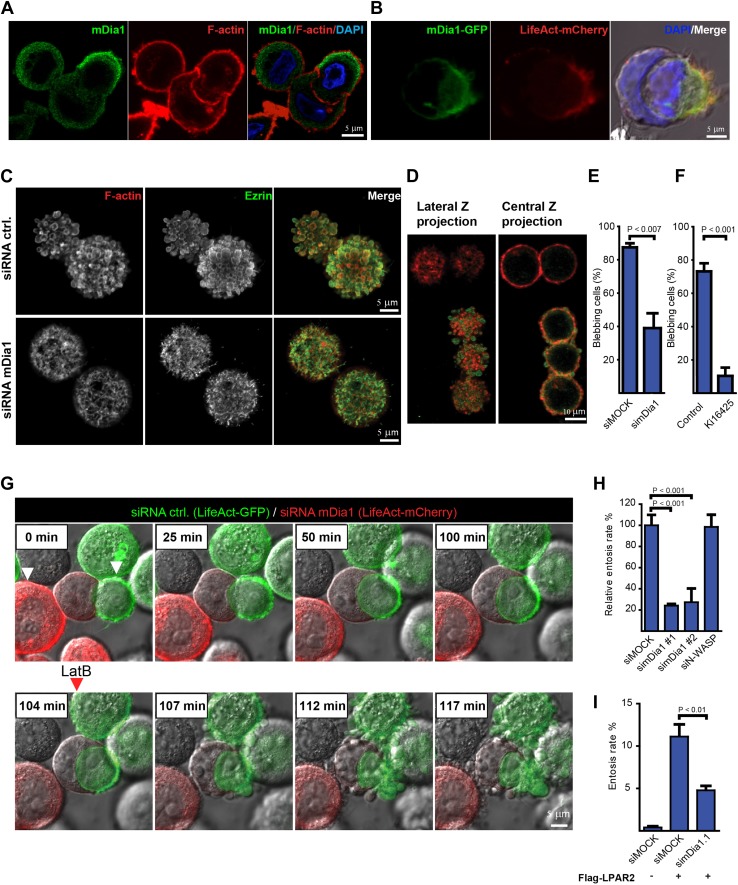
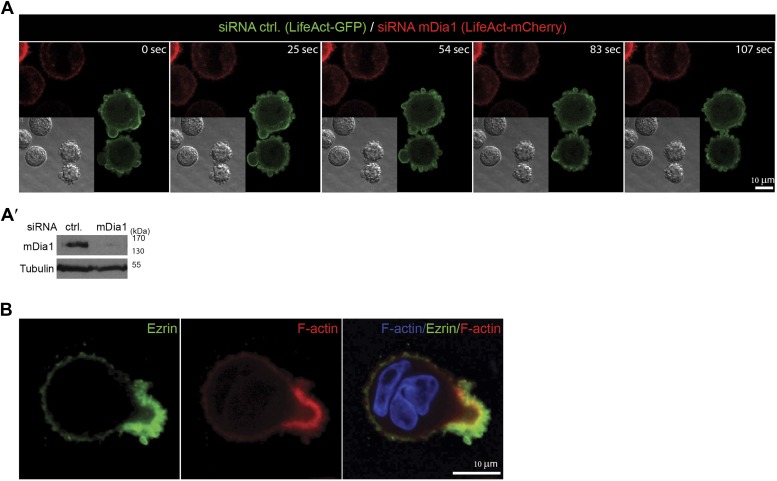
Homotypic or entotic cell-in-cell invasion is an integrin-independent process observed in carcinoma cells exposed during conditions of low adhesion such as in exudates of malignant disease. Although active cell-in-cell invasion depends on RhoA and actin, the precise mechanism as well as the underlying actin structures and assembly factors driving the process are unknown. Furthermore, whether specific cell surface receptors trigger entotic invasion in a signal-dependent fashion has not been investigated. In this study, we identify the G-protein-coupled LPA receptor 2 (LPAR2) as a signal transducer specifically required for the actively invading cell during entosis. We find that G12/13 and PDZ-RhoGEF are required for entotic invasion, which is driven by blebbing and a uropod-like actin structure at the rear of the invading cell. Finally, we provide evidence for an involvement of the RhoA-regulated formin Dia1 for entosis downstream of LPAR2. Thus, we delineate a signaling process that regulates actin dynamics during cell-in-cell invasion.

Keywords: GPCR, LPA-receptor; actin dynamics; blebbing; cell biology; cell-in-cell invasion; entosis; human; mDia1 formin.


Conflict of interest statement

The authors declare that no competing interests exist.

Figures

Figure 1.
Figure 1.. Actin dynamics during entotic invasion and stimulation of entosis by LPA.
(A and A′) MCF10A cells expressing LifeAct-mCherry (red) or LifeAct-GFP (green) were monitored over time (Video 2) as indicated to visualize actin polymerization during cell-in-cell invasion. Note the specific blebbing activity of the invading cell and the actin-rich structure at the cell rear (green). Differential interference contrast (DIC) is added for each frame. (B) Bleb-dynamics were analyzed from eight different live cells expressing LifeAct-GFP, ± SD. (C) Entotic MCF10A cells labeled for F-actin using phalloidin (red) and nuclei using DAPI (blue). Scale bar 5 μm. (D) Increasing concentrations of LPA stimulate entosis in MCF10A cells under serum-free conditions. (n = 4 ± SD). (E) Effects of adding the LPAR1, 2 and 3 receptor blocker Ki16425 on LPA-induced entosis in MCF10A cells (n = 3 ± SEM analyzed by one way ANOVA followed by Dunnett's post-tests compared with LPA-induced group). (F) Effects of adding the LPAR1, 2 and 3 receptor blocker Ki16425 on entosis in MCF10A cells after addition of 5% horse serum (n = 4 ± SEM analyzed by one way ANOVA followed by Dunnett's post-tests compared with serum-induced group). DOI: http://dx.doi.org/10.7554/eLife.02786.004
Figure 1—figure supplement 1.
Figure 1—figure supplement 1.. Formation of an actin-rich uorpod-like structure during entotic invasion.
MCF10A cells cultured on poly-Hema expressing LifeAct-mCherry (red) or LifeAct-GFP (green) were monitored over time as indicated to visualize actin polymerization during cell-in-cell invasion. Each time frame represents a confocal scan using a LSM 700 (Zeiss). Differential interference contrast (DIC) is added for each frame. DOI: http://dx.doi.org/10.7554/eLife.02786.005
Figure 2.
Figure 2.. LPAR2 triggers invasive motility during entosis.
(A) MCF10A cells treated with indicated siRNAs for 48 hr were analyzed for entosis (n = 3 ± SD analyzed by one way ANOVA followed by Dunnett's post-tests compared with siMOCK group). (B) MCF10A cells stably expressing mCherry-H2B or GFP-H2B were treated with indicated siRNAs before equal cell numbers were mixed and plated to analyze entotic invasion. (C) HEK293 cells were transfected with LPAR2 cDNA before analyzation for entosis (n = 3 ± SD, p<0.05, t test). (D) Immunolabeling of endogenous LPAR2 (red) and nuclei (DAPI) of MCF10A cells fixed at different stages during entosis as indicated. Scale bar 5 μm. (E) Immunolabeling of transfected Flag-tagged LPAR2 (green), F-actin (phalloidin, red), and nuclei (DAPI) of invading HEK293 cells undergoing entosis with or without 5 min addition of 100 nM latrunculin B (LatB) before fixation. Arrows indicate disassembled F-actin. Scale bar 5 μm. DOI: http://dx.doi.org/10.7554/eLife.02786.008
Figure 3.
Figure 3.. Gα12/13 and PDZ-RhoGEF are required for entosis.
(A) MCF10A cells treated with indicated siRNAs for 48 hr were analyzed for relative entosis rates (n = 5 ± SD analyzed by one way ANOVA followed by Dunnett's post-tests compared with siMOCK group). (B) HEK293 cells expressing Flag-LPAR2 were treated with indicated siRNAs for 48 hr before analyzing entosis rate (n = 3 ± SD analyzed by one way ANOVA followed by Dunnett's post-tests compared with Flag-LPAR2-expressing siMOCK group). (C) HEK293 cells expressing indicated proteins were analyzed for entosis in lipid-depleted medium with or without (w/o) the addition of LPA as indicated. (n = 3 ± SD analyzed by two way ANOVA followed by Bonferroni post-tests). (D) MCF10A cells treated with indicated siRNAs for 48 hr were analyzed for entosis (n = 3 ± SD analyzed by one way ANOVA followed by Dunnett's post-tests compared with siMOCK group). (E) Localization of GFP-PDZ-RhoGEF (green), DAPI (blue), and LifeAct-mCherry (red) expressed in MCF-7 cells was analyzed by confocal microscopy. Bright-field image merged with DAPI and LifeAct is shown to reveal the cell-in-cell structure (left panel). Note the accumulation of PDZ-RhoGEF at the actin-rich uropod-like structure of the invading cell. Scale bar 5 μm. DOI: http://dx.doi.org/10.7554/eLife.02786.009
Figure 3—figure supplement 1.
Figure 3—figure supplement 1.. Myosin II activity is present at the actin-rich cup at the invading cell rear.
Immunolabeling of endogenous phospho-MLC2 (red) and phalloidin staining of F-actin (green) of a MCF10A cell undergoing entosis. Nuclei are labeled by DAPI (blue). Scale bar 5 μm. Arrows point at p-MLC enrichment at the trailing cell rear. DOI: http://dx.doi.org/10.7554/eLife.02786.010
Figure 3—figure supplement 2.
Figure 3—figure supplement 2.. Analysis of siRNA treatments.
(A) RT-PCR quantifications for indicated siRNA treatments in MCF10A cells. (B) Western blot analysis of MCF10 cell lysates of cell treated with the indicated siRNAs. DOI: http://dx.doi.org/10.7554/eLife.02786.011
Figure 4.
Figure 4.. The formin mDia1 mediates cell-in-cell invasion downstream of LPAR2.
(A) Immunolabeling of endogenous mDia1 (green) and phalloidin staining of F-actin (red) of a MCF10A cell undergoing entosis. Nuclei are labeled by DAPI (blue). Scale bar 5 μm. (B) Visualization of mDia1-GFP (green) and mCherry-LifeAct (red) localization at the invading cell rear in fixed and non-permeabilized HEK293 cells co-transfected with LPAR2 to trigger cell-in-cell invasion events. Merged image including bright-field and DAPI (blue) is shown in the right panel. Scale bar 5 μm. (C) Immunolabeling of endogenous Ezrin (green) and F-actin (red) of control and mDia1 siRNA-treated MCF10A cells. (D) MCF10A cell population after incomplete siRNA treatment against mDia1 showing mDia1 knockdown of the upper two cells (red only) and endogenous mDia1 detection of the lower three cells were labeled for mDia1 (green) and F-actin (red). Note the presence of mDia1 on cellular blebs, while the two upper mDia1-negative cells fail to bleb. 2 frames are shown from a confocal z-scan using a LSM 700 (Zeiss). (E) MCF10A cells treated with indicated siRNAs were analyzed for the number of blebbing cells (n = 3 ± SD, p<0.007, t test). (F) MCF10A cells pretreated for 40 min with 20 μM of the LPAR inhibitor Ki16425 before analysis of the number of blebbing cells (n = 3 ± SD, p<0.001, t test). (G) MCF10A cells expressing LifeAct-GFP (green) or LifeAct-mCherry (red) silenced for control or mDia1 respectively. White arrowheads in the first frame indicate red (siDia1) and green (siMOCK) cell in contact with a host cell. Red arrowhead indicates addition of 100 nM Latrunculin B (LatB) at time frame 104 min. (H) MCF10A cells treated with indicated siRNAs for 48 hr were analyzed for entosis (n = 3 ± SD analyzed by one way ANOVA followed by Dunnett's post-tests compared with siMOCK group). (I) HEK293 cells expressing Flag-LPAR2 to trigger cell-in-cell invasion events were treated with indicated siRNAs for 48 hr before analyzing entosis rates (n = 3 ± SD analyzed by One way ANOVA followed by Dunnett's post-tests compared with Flag-LPAR2 expressing siMOCK group). DOI: http://dx.doi.org/10.7554/eLife.02786.012
Figure 4—figure supplement 1.
Figure 4—figure supplement 1.. mDia1 is required for blebbing.
(A) MCF10A cells cultured on polyHEMA expressing LifeAct-mCherry (red) or LifeAct-GFP (green) silenced for mDia1 or control respectively were monitored over time as indicated to visualize actin polymerization during blebbing. Each time frame represents a confocal scan using a LSM 700 (Zeiss). Differential interference contrast (DIC) is added for each frame. Note that mDia1 silenced cells fail to display any bleb activity (red). (A′) Western analysis for mDia1 siRNA treatment. (B) Immunolabeling of endogenous Ezrin (green) and phalloidin staining of F-actin (red) of a MCF10A cell undergoing entosis. Nuclei are labeled by DAPI (blue). Scale bar 10 μm. DOI: http://dx.doi.org/10.7554/eLife.02786.013

References

    1. Charras GT, Hu CK, Coughlin M, Mitchison TJ. 2006. Reassembly of contractile actin cortex in cell blebs. The Journal of Cell Biology 175:477–490. doi: 10.1083/jcb.200602085 - DOI - PMC - PubMed
    1. Choi JW, Herr DR, Noguchi K, Yung YC, Lee CW, Mutoh T, Lin ME, Teo ST, Park KE, Mosley AN, Chun J. 2010. LPA receptors: subtypes and biological actions. Annual Review of Pharmacology and Toxicology 50:157–186. doi: 10.1146/annurev.pharmtox.010909.105753 - DOI - PubMed
    1. Fackler OT, Grosse R. 2008. Cell motility through plasma membrane blebbing. The Journal of Cell Biology 181:879–884. doi: 10.1083/jcb.200802081 - DOI - PMC - PubMed
    1. Florey O, Kim SE, Sandoval CP, Haynes CM, Overholtzer M. 2011. Autophagy machinery mediates macroendocytic processing and entotic cell death by targeting single membranes. Nature Cell Biology 13:1335–1343. doi: 10.1038/ncb2363 - DOI - PMC - PubMed
    1. Florey O, Krajcovic M, Sun Q, Overholtzer M. 2010. Entosis. Current Biology 20:R88–R89. doi: 10.1016/j.cub.2009.11.020 - DOI - PubMed

Publication types