. 2014 Jun 19;6(7):1635-51.
doi: 10.1093/gbe/evu135.

Evolution of the vertebrate Pax4/6 class of genes with focus on its novel member, the Pax10 gene

Affiliations

Evolution of the vertebrate Pax4/6 class of genes with focus on its novel member, the Pax10 gene

Nathalie Feiner et al. Genome Biol Evol. .

Abstract

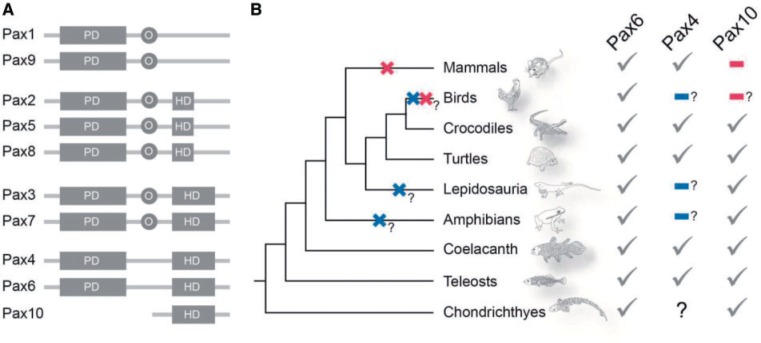
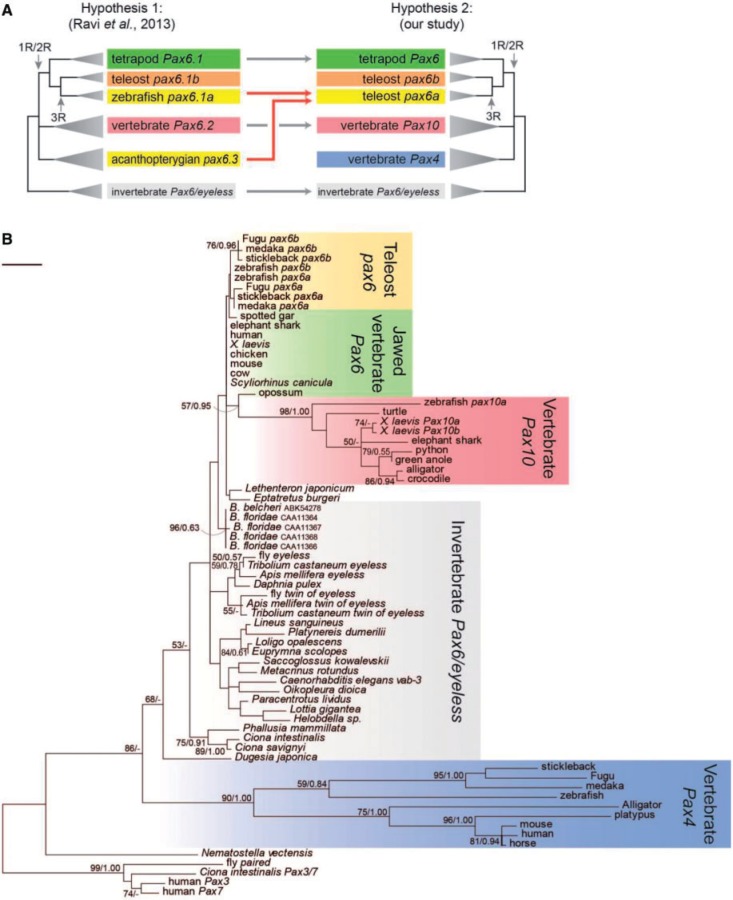
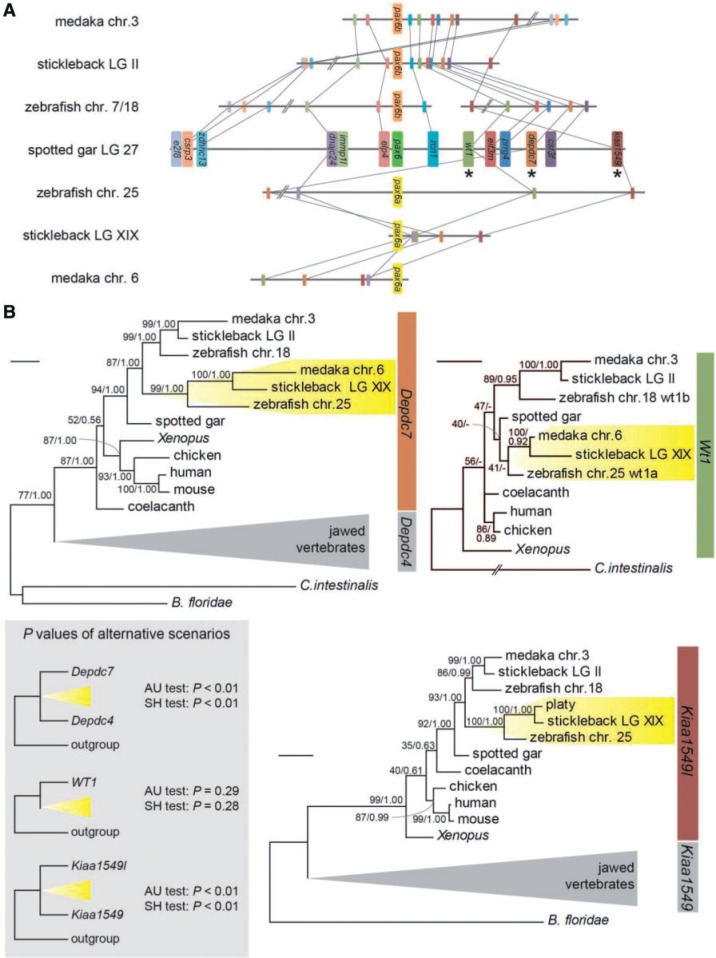
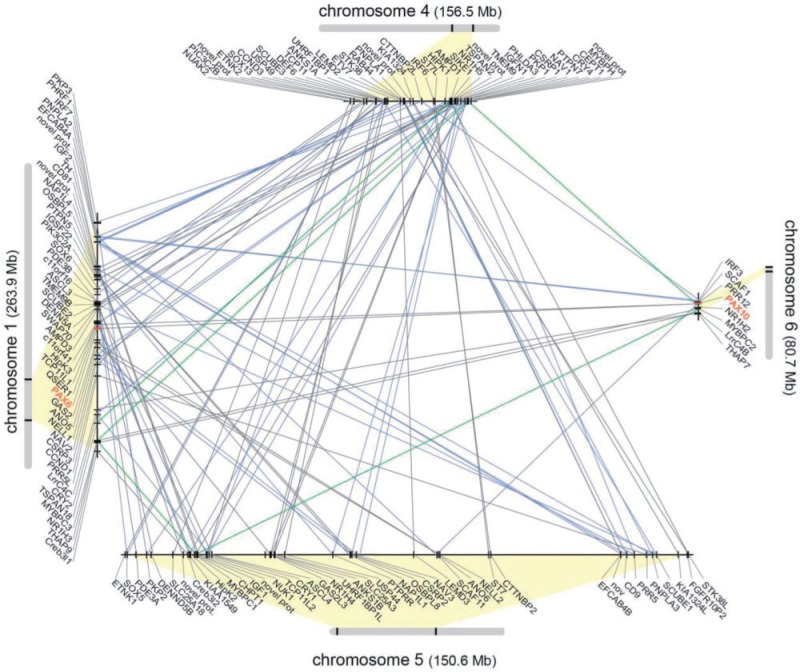
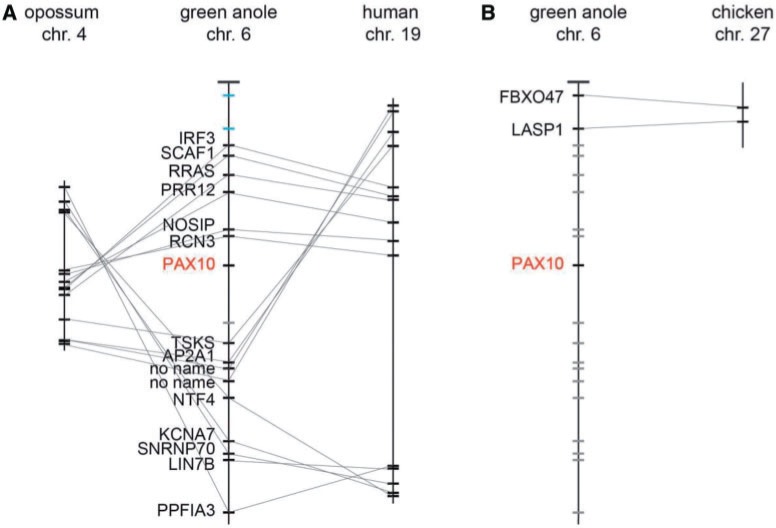
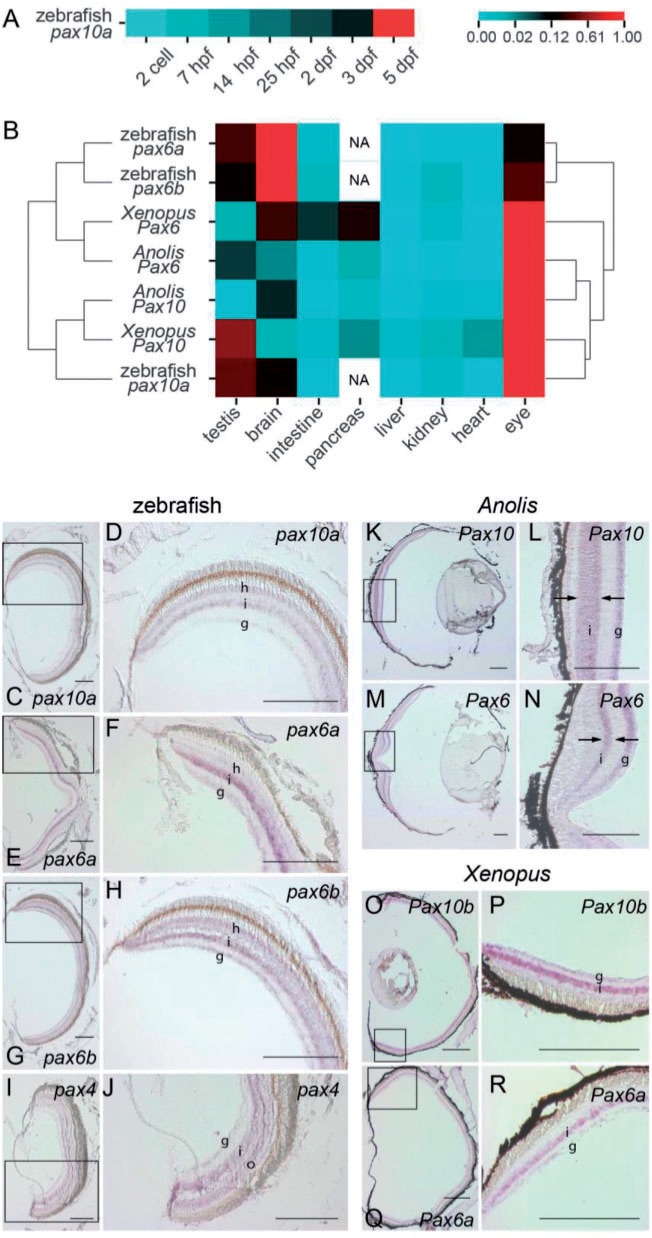
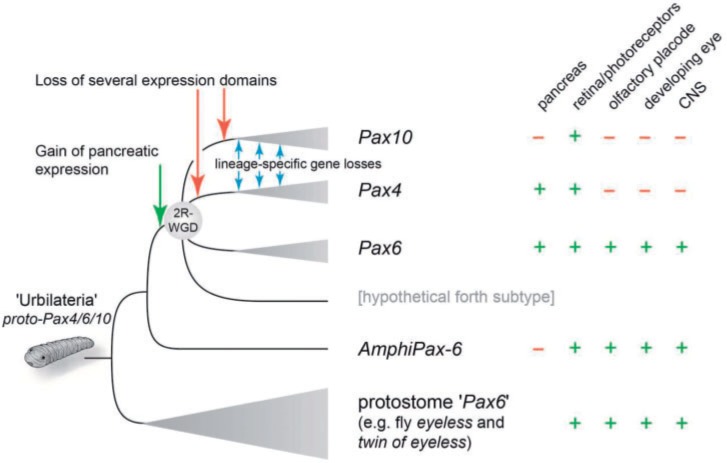
The members of the paired box (Pax) family regulate key developmental pathways in many metazoans as tissue-specific transcription factors. Vertebrate genomes typically possess nine Pax genes (Pax1-9), which are derived from four proto-Pax genes in the vertebrate ancestor that were later expanded through the so-called two-round (2R) whole-genome duplication. A recent study proposed that pax6a genes of a subset of teleost fishes (namely, acanthopterygians) are remnants of a paralog generated in the 2R genome duplication, to be renamed pax6.3, and reported one more group of vertebrate Pax genes (Pax6.2), most closely related to the Pax4/6 class. We propose to designate this new member Pax10 instead and reconstruct the evolutionary history of the Pax4/6/10 class with solid phylogenetic evidence. Our synteny analysis showed that Pax4, -6, and -10 originated in the 2R genome duplications early in vertebrate evolution. The phylogenetic analyses of relationships between teleost pax6a and other Pax4, -6, and -10 genes, however, do not support the proposed hypothesis of an ancient origin of the acanthopterygian pax6a genes in the 2R genome duplication. Instead, we confirmed the traditional scenario that the acanthopterygian pax6a is derived from the more recent teleost-specific genome duplication. Notably, Pax6 is present in all vertebrates surveyed to date, whereas Pax4 and -10 were lost multiple times in independent vertebrate lineages, likely because of their restricted expression patterns: Among Pax6-positive domains, Pax10 has retained expression in the adult retina alone, which we documented through in situ hybridization and quantitative reverse transcription polymerase chain reaction experiments on zebrafish, Xenopus, and anole lizard.

Keywords: Pax10; Pax4; Pax6; conserved synteny; gene duplication; gene loss.


Figures

F<sc>ig</sc>. 1.—
Fig. 1.—
Domain structure of vertebrate Pax proteins and phylogenetic distribution of Pax4, -6, and -10 genes across jawed vertebrates. (A) Presences of paired domains (PD), homeodomains (HD), and octapeptides (O) for all vertebrate Pax subtypes. No paired box has been identified in any of the Pax10 genes, and thus, mature Pax10 proteins presumably lack a paired domain. (B) Phylogeny of major vertebrate taxa with indicated patterns of presence and presumed absence of Pax4, -6, and -10 genes. The presence of these genes was investigated using exhaustive Blast searches in publicly available whole-genome sequences (see supplementary table S1, Supplementary Material online, for details). The chondrichthyan Pax10 gene was reported by Ravi et al. (2013). Inferred secondary gene losses are indicated with red and blue crosses and mapped onto the generally accepted jawed vertebrate phylogeny. Question marks indicate uncertainties about the absence of genes because of insufficient sequence information of the respective taxa. The phylogenetic position of turtles is based on molecular phylogenetic studies (Zardoya and Meyer 1998; Rest et al. 2003; Iwabe et al. 2005; Chiari et al. 2012; Crawford et al. 2012; Wang et al. 2013).
F<sc>ig</sc>. 2.—
Fig. 2.—
Phylogenetic relationships within the Pax4/6/10 class of genes. (A) Schematic presentations of two scenarios of the evolution of the Pax4/6/10 class of genes. Hypothesis 1, proposed by Ravi et al. (2013), assumes an ancient origin of one group of acanthopterygian pax6 genes, namely pax6.3. In addition, this hypothesis does not take the group of Pax4 genes into account. Hypothesis 2 is proposed based on our phylogenetic analysis, and it postulates the origin of both groups of teleost pax6 genes, namely pax6a and -6b, in the TSGD. The gene nomenclature in Hypothesis 1 is adopted from Ravi et al. (2013). (B) ML tree showing phylogenetic relationships among vertebrate genes belonging to the Pax4/6/10 class, with Pax3 and -7 genes as outgroup. Exact names of the genes are included only when they experienced additional lineage-specific duplications. Support values are shown for each node in order, bootstrap probabilities in the ML and Bayesian posterior probabilities. Only bootstrap probabilities above 50 are shown. The inference is based on 99 amino acid residues, assuming the JTT+Γ4 model (shape parameter of the gamma distribution α = 0.57). The scale bar on the upper left indicates 0.2 substitutions per site.
F<sc>ig</sc>. 3.—
Fig. 3.—
Evolutionary origins of pax6-neighboring genes in teleost genomes. (A) Conserved synteny between the genomic regions of the gar Pax6 ortholog and the two teleost pax6 subtypes. Co-orthologs to the spotted gar genes located within 1 Mb flanking the pax6 gene that are harbored in the vicinity of pax6a and/or -6b of selected teleosts are shown in the same color (see supplementary table S9, Supplementary Material online, for accession IDs). Asterisks mark names of the selected gene families that retained both duplicates derived from the TSGD. (B) Molecular phylogenetic trees of selected gene families. ML trees of three gene families are shown, and statistical support values (P values) of alternative scenarios assuming a more ancient origin of the pax6a-linked genes (compatible with Hypothesis 1 in fig. 2A) are given in the grey box on the lower left as inset. The Depdc7 phylogeny is based on 321 amino acid residues and the JTT+Γ4 model (shape parameter of the gamma distribution α = 1.39) was assumed. The ML tree of Wt1 genes was inferred from 331 amino acid residues assuming the JTT+F+Γ4 model (shape parameter of the gamma distribution α = 1.45). The Kiaa1549l phylogenetic analysis used an alignment of 295 amino acid residues and the JTT+Γ4 model (shape parameter of the gamma distribution α = 1.30). Bootstrap probabilities are provided for each node. The scale bars on the upper left of each phylogenetic tree indicate 0.2 substitutions per site.
F<sc>ig</sc>. 4.—
Fig. 4.—
Intragenomic conserved synteny between Pax6 and -10 containing regions in the green anole lizard. Outer grey bars represent chromosomes 1 and 6 of the green anole that harbor Pax6 and -10 (shown in red), respectively, and their paralogous regions on chromosomes 4 and 5. Magnifications of the genomic regions indicated on the chromosomes (gray bars) are shown in the center. Gene-by-gene paralogies among the four members of the quartet are highlighted with diagonal lines: Gray lines for paralogy of gene families with two paralogs, blue lines for three paralogs, and green line for four paralogs.
F<sc>ig</sc>. 5.—
Fig. 5.—
Conserved synteny between the Pax10-containing region in the green anole and its orthologous regions in mammals and birds. A 1-Mb region flanking the green anole Pax10 gene, shown in red, was analyzed and gene-by-gene orthologies are indicated with gray lines. (A) Conserved synteny between the green anole Pax10-containing region and its orthologous regions in the opossum and human genomes. The dense pattern of one-to-one orthologies suggests a small-scale deletion of Pax10 in the lineage leading to eutherians, before the split of the marsupial lineage. (B) Synteny between the green anole Pax10-containing region and the chicken genome. The lack of one-to-one orthologies in the region around the green anole Pax10 gene is best explained by a large-scale deletion in the avian lineage. Green anole genes whose orthologs are located elsewhere in the opossum, human, or chicken genome are indicated with blue bars, whereas green anole genes lacking orthologs in these genomes are shown with grey bars. Exact genomic locations and accession IDs of the identified orthologs are included in supplementary tables S7 and S8, Supplementary Material online. chr., chromosome.
F<sc>ig</sc>. 6.—
Fig. 6.—
Expression profiles of Pax4, -6, and -10 in zebrafish, Xenopus, and green anole. (A) Expression levels of pax10a in a developmental series of zebrafish with semiquantitative RT-PCRs. Heat map indicates upregulation of pax10a in late developmental stages reaching a plateau at 5 dpf. Color scale at the right indicates the relative expression levels normalized to values between 0 and 1 for no expression (blue) and for the highest observed expression level (red), respectively. (B) Heat map visualizing expression levels of Pax6 and -10 in individual organs of adult zebrafish, Xenopus, and green anole. In adult zebrafish, pax6a, -6b, and -10a transcripts were detected in the brain, testis, and eye. High levels of Pax6 expression were detected in Xenopus laevis brain and eye, and low levels in pancreas and intestine, whereas Pax10 expression signals were found in the eye and testis. In green anole, Pax6 transcripts were detected in the eye, brain, and testis and at low concentrations in pancreas, and Pax10 expression was detected in the eye and brain. It should be noted that the zebrafish pancreas was not analyzed (NA) because its anatomical structure was not precisely identified. The phylogram on the left reflects the phylogenetic relationships of the genes inferred in figure 2B, whereas that on the right shows the clustering based on their expression levels in various organs. (C–R) In situ hybridizations of Pax4, -6, and -10 orthologs in the retinas of adult zebrafish, Xenopus, and the green anole. C–J show expression patterns in the retinas of an albino zebrafish, K–N of a green anole, and O–R of a X. laevis. D, F, H, J, L, N, P, and R are magnifications of the rectangles in A, C, E, G, I, K, M, and O, respectively. All investigated genes were strongly expressed in the inner nuclear layer (i) and weakly in the ganglion cell layer (g). Zebrafish pax6a, -6b, and -10a also showed weak expressions in the horizontal cell layer (h in D, F, and H) and zebrafish pax4 transcripts were detected in the outer nuclear layer (o in J). It was evident from the results for Anolis carolinensis that the Pax6 expression is nested within that of Pax10 in the inner nuclear layer of the retina (arrows in L and N). Scale bar: 200 µm.
F<sc>ig</sc>. 7.—
Fig. 7.—
Evolutionary scenario focusing on the functional diversification of the Pax4/6/10 class of genes. Expression domains identified in this study are mapped with those previously described onto a simplified gene tree of the Pax4/6/10 class. Based on parsimonious reconstruction, a proto-Pax4/6/10 gene at the last common ancestor of protostomes and deuterostomes, the so-called Urbilateria, was most likely expressed in photoreceptors, olfactory placode, developing the eye and CNS. Secondary modification, such as the gain of a pancreatic expression before the 2R-WGD or the loss of several Pax4 and -10 expression domains, led to the functional differentiation among Pax4, -6, and -10.

Similar articles

Cited by

References

    1. Amemiya CT, et al. The African coelacanth genome provides insights into tetrapod evolution. Nature. 2013;496:311–316. - PMC - PubMed
    1. Amores A, Catchen J, Ferrara A, Fontenot Q, Postlethwait JH. Genome evolution and meiotic maps by massively parallel DNA sequencing: spotted gar, an outgroup for the teleost genome duplication. Genetics. 2011;188:799–808. - PMC - PubMed
    1. Amores A, et al. Zebrafish hox clusters and vertebrate genome evolution. Science. 1998;282:1711–1714. - PubMed
    1. Anisimova M, et al. State-of the art methodologies dictate new standards for phylogenetic analysis. BMC Evol Biol. 2013;13:161. - PMC - PubMed
    1. Begemann G, Schilling TF, Rauch GJ, Geisler R, Ingham PW. The zebrafish neckless mutation reveals a requirement for raldh2 in mesodermal signals that pattern the hindbrain. Development. 2001;128:3081–3094. - PubMed

Publication types

MeSH terms

LinkOut - more resources