

Extensive local gene duplication and functional divergence among paralogs in Atlantic salmon
- PMID: 24951567
- PMCID: PMC4122929
- DOI: 10.1093/gbe/evu131
Extensive local gene duplication and functional divergence among paralogs in Atlantic salmon
Abstract
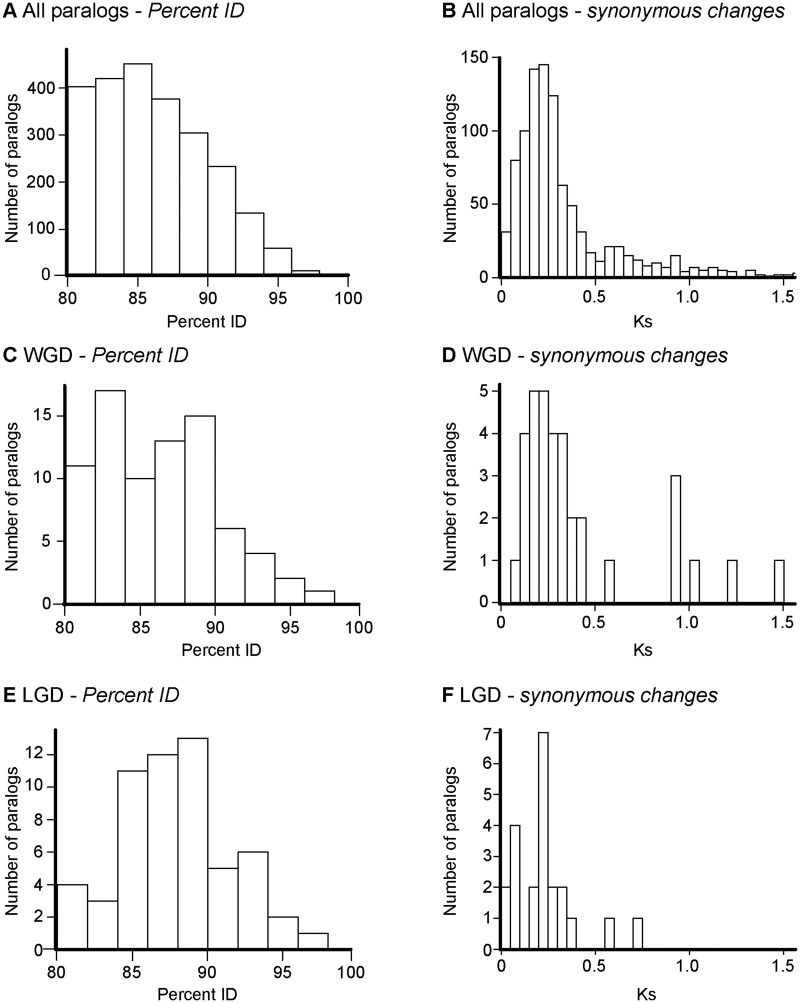
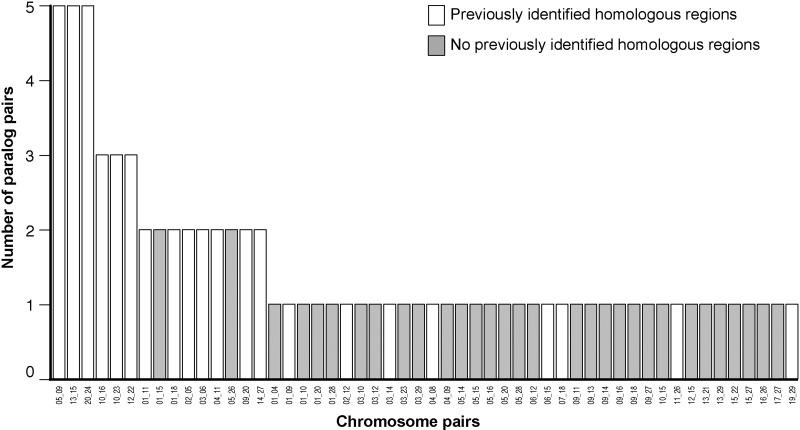
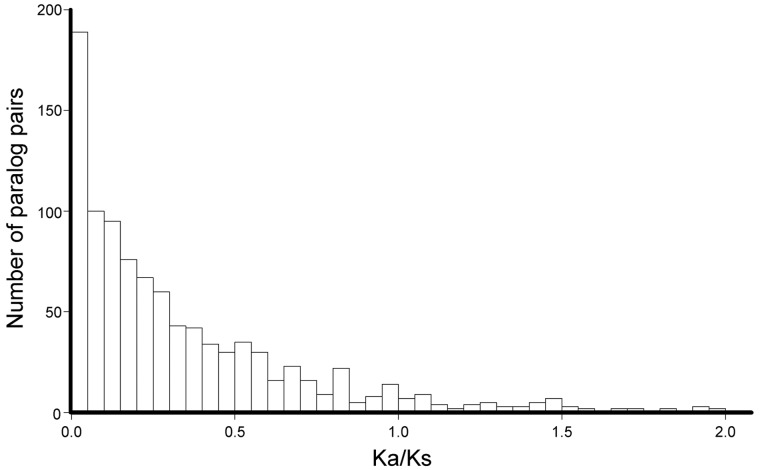
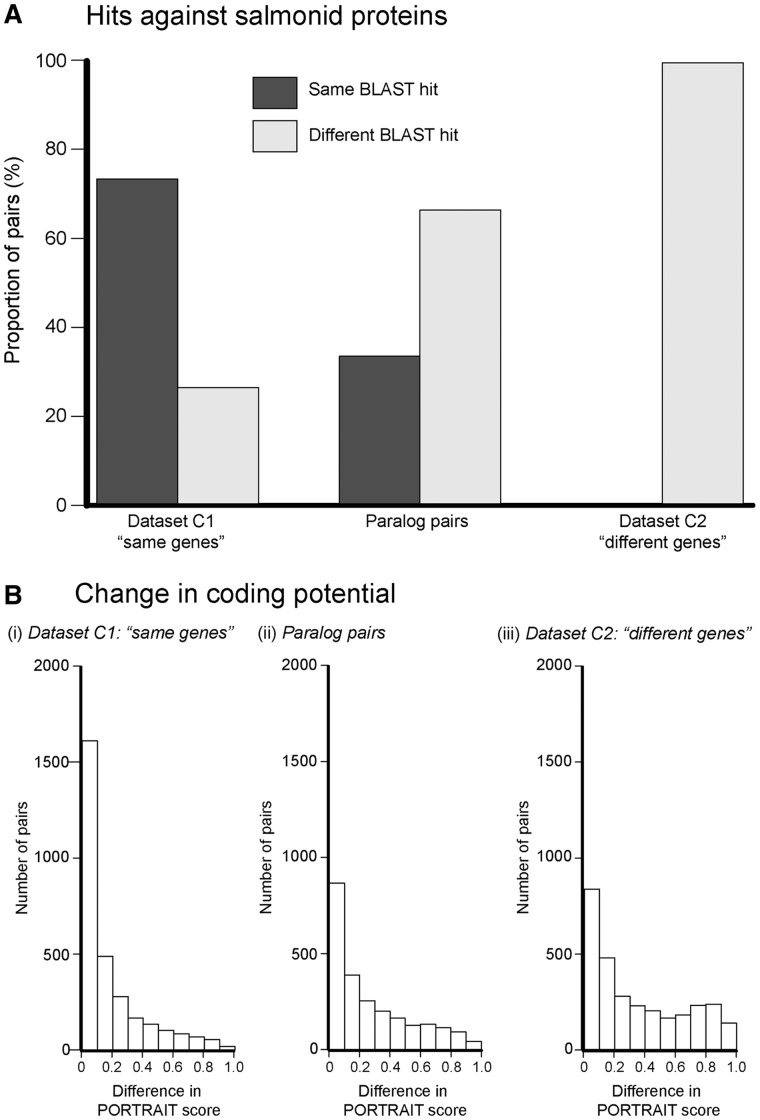
Many organisms can generate alternative phenotypes from the same genome, enabling individuals to exploit diverse and variable environments. A prevailing hypothesis is that such adaptation has been favored by gene duplication events, which generate redundant genomic material that may evolve divergent functions. Vertebrate examples of recent whole-genome duplications are sparse although one example is the salmonids, which have undergone a whole-genome duplication event within the last 100 Myr. The life-cycle of the Atlantic salmon, Salmo salar, depends on the ability to produce alternating phenotypes from the same genome, to facilitate migration and maintain its anadromous life history. Here, we investigate the hypothesis that genome-wide and local gene duplication events have contributed to the salmonid adaptation. We used high-throughput sequencing to characterize the transcriptomes of three key organs involved in regulating migration in S. salar: Brain, pituitary, and olfactory epithelium. We identified over 10,000 undescribed S. salar sequences and designed an analytic workflow to distinguish between paralogs originating from local gene duplication events or from whole-genome duplication events. These data reveal that substantial local gene duplications took place shortly after the whole-genome duplication event. Many of the identified paralog pairs have either diverged in function or become noncoding. Future functional genomics studies will reveal to what extent this rich source of divergence in genetic sequence is likely to have facilitated the evolution of extreme phenotypic plasticity required for an anadromous life-cycle.
Keywords: Atlantic salmon; gene duplication; genome evolution; transcriptome; whole-genome duplication.
© The Author(s) 2014. Published by Oxford University Press on behalf of the Society for Molecular Biology and Evolution.
Figures
Similar articles
-
Autopolyploidy genome duplication preserves other ancient genome duplications in Atlantic salmon (Salmo salar).PLoS One. 2017 Feb 27;12(2):e0173053. doi: 10.1371/journal.pone.0173053. eCollection 2017. PLoS One. 2017. PMID: 28241055 Free PMC article.
-
Genomic arrangement of salinity tolerance QTLs in salmonids: a comparative analysis of Atlantic salmon (Salmo salar) with Arctic charr (Salvelinus alpinus) and rainbow trout (Oncorhynchus mykiss).BMC Genomics. 2012 Aug 24;13:420. doi: 10.1186/1471-2164-13-420. BMC Genomics. 2012. PMID: 22916800 Free PMC article.
-
Atlantic salmon populations reveal adaptive divergence of immune related genes - a duplicated genome under selection.BMC Genomics. 2016 Aug 11;17(1):610. doi: 10.1186/s12864-016-2867-z. BMC Genomics. 2016. PMID: 27515098 Free PMC article.
-
Atlantic salmon (Salmo salar L.) genetics in the 21st century: taking leaps forward in aquaculture and biological understanding.Anim Genet. 2019 Feb;50(1):3-14. doi: 10.1111/age.12748. Epub 2018 Nov 14. Anim Genet. 2019. PMID: 30426521 Free PMC article. Review.
-
A critical review of adaptive genetic variation in Atlantic salmon: implications for conservation.Biol Rev Camb Philos Soc. 2007 May;82(2):173-211. doi: 10.1111/j.1469-185X.2006.00004.x. Biol Rev Camb Philos Soc. 2007. PMID: 17437557 Review.
Cited by
-
Investigating Diadromy in Fishes and Its Loss in an -Omics Era.iScience. 2020 Nov 20;23(12):101837. doi: 10.1016/j.isci.2020.101837. eCollection 2020 Dec 18. iScience. 2020. PMID: 33305191 Free PMC article. Review.
-
De Novo Transcriptome Characterization of a Sterilizing Trematode Parasite (Microphallus sp.) from Two Species of New Zealand Snails.G3 (Bethesda). 2017 Mar 10;7(3):871-880. doi: 10.1534/g3.116.037275. G3 (Bethesda). 2017. PMID: 28122948 Free PMC article.
-
Temporal stability in patterns of genetic diversity and structure of a marine foundation species (Zostera marina).Heredity (Edinb). 2017 Apr;118(4):404-412. doi: 10.1038/hdy.2016.114. Epub 2016 Dec 28. Heredity (Edinb). 2017. PMID: 28029151 Free PMC article.
-
Genome plasticity in Candida albicans is driven by long repeat sequences.Elife. 2019 Jun 7;8:e45954. doi: 10.7554/eLife.45954. Elife. 2019. PMID: 31172944 Free PMC article.
-
Construction of relatedness matrices using genotyping-by-sequencing data.BMC Genomics. 2015 Dec 9;16:1047. doi: 10.1186/s12864-015-2252-3. BMC Genomics. 2015. PMID: 26654230 Free PMC article.
References
-
- Alexandrou MA, Swartz BA, Matzke NJ, Oakley TH. Molecular phylogenetics and evolution genome duplication and multiple evolutionary origins of complex migratory behavior in Salmonidae. Mol Phylogenet Evol. 2013;69:514–523. - PubMed
-
- Allendorf FW, Thorgaard GH. Tetraploidy and the evolution of salmonid fishes. In: Turner BJ, editor. Evolutionary genetics of fishes. New York: Plenum Press; 1984. pp. 55–93.
Publication types
MeSH terms
Grants and funding
LinkOut - more resources
Full Text Sources
Other Literature Sources
Molecular Biology Databases
