. 2014 Aug 8;289(32):22258-67.
doi: 10.1074/jbc.M114.588046. Epub 2014 Jun 20.

Exosome uptake through clathrin-mediated endocytosis and macropinocytosis and mediating miR-21 delivery

Affiliations

Exosome uptake through clathrin-mediated endocytosis and macropinocytosis and mediating miR-21 delivery

Tian Tian et al. J Biol Chem. .

Abstract

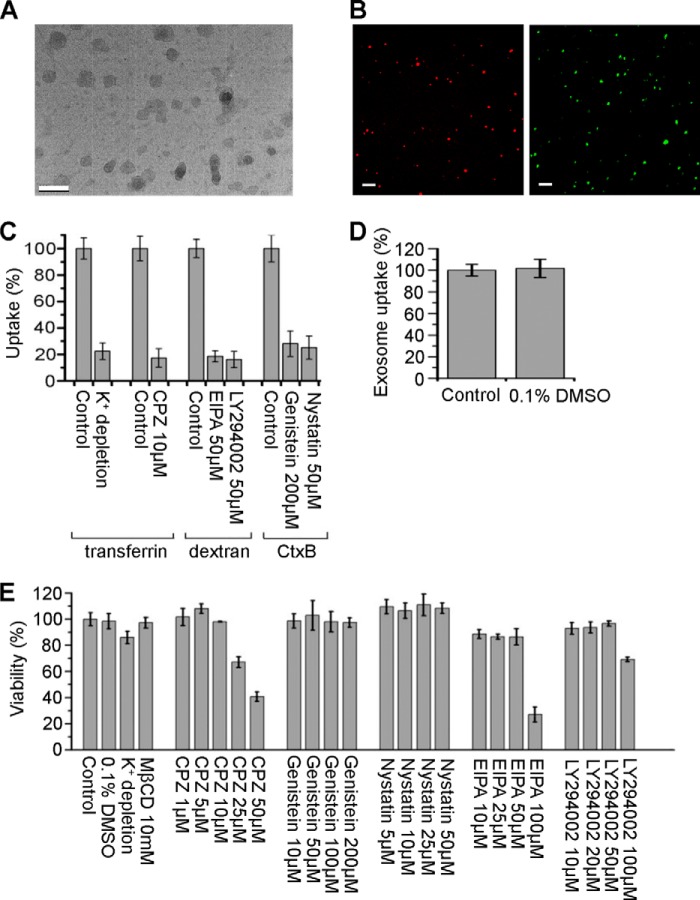
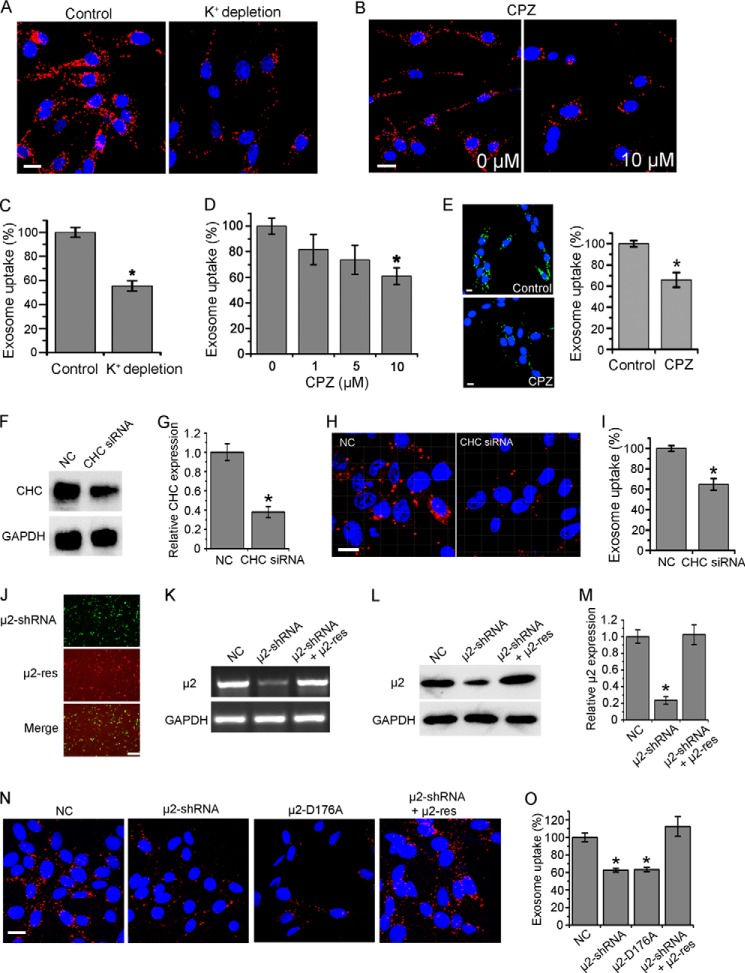
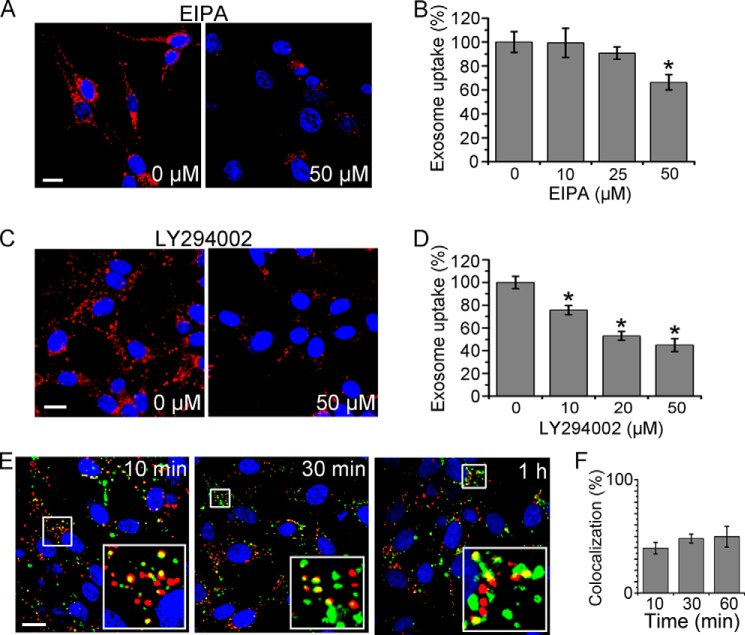
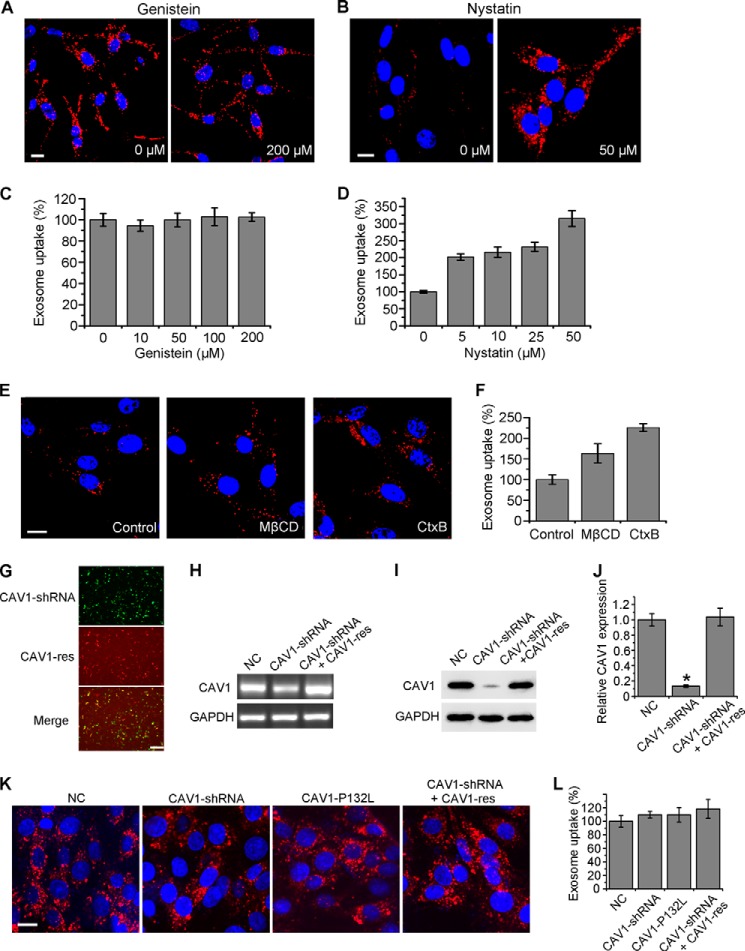
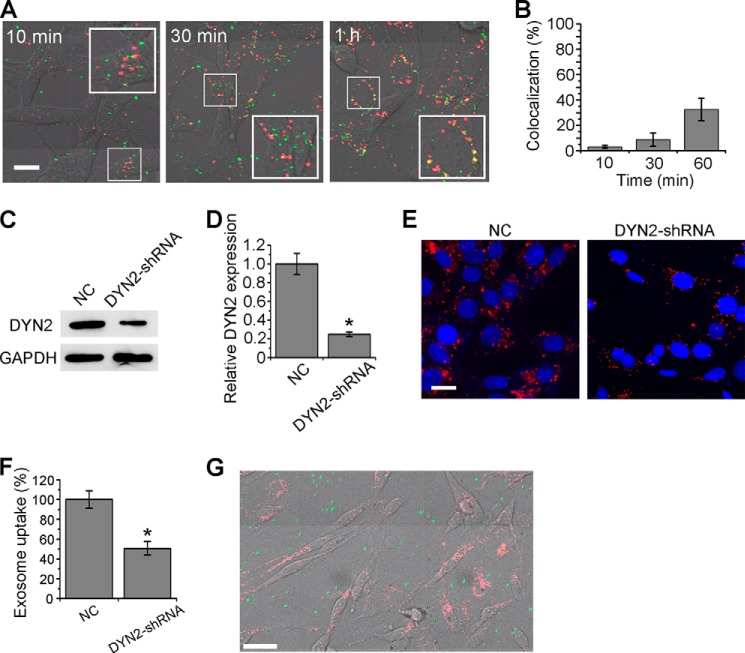
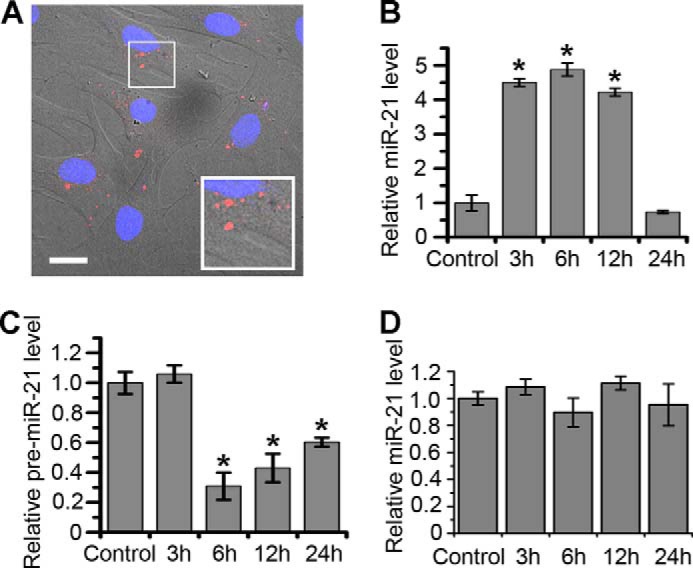
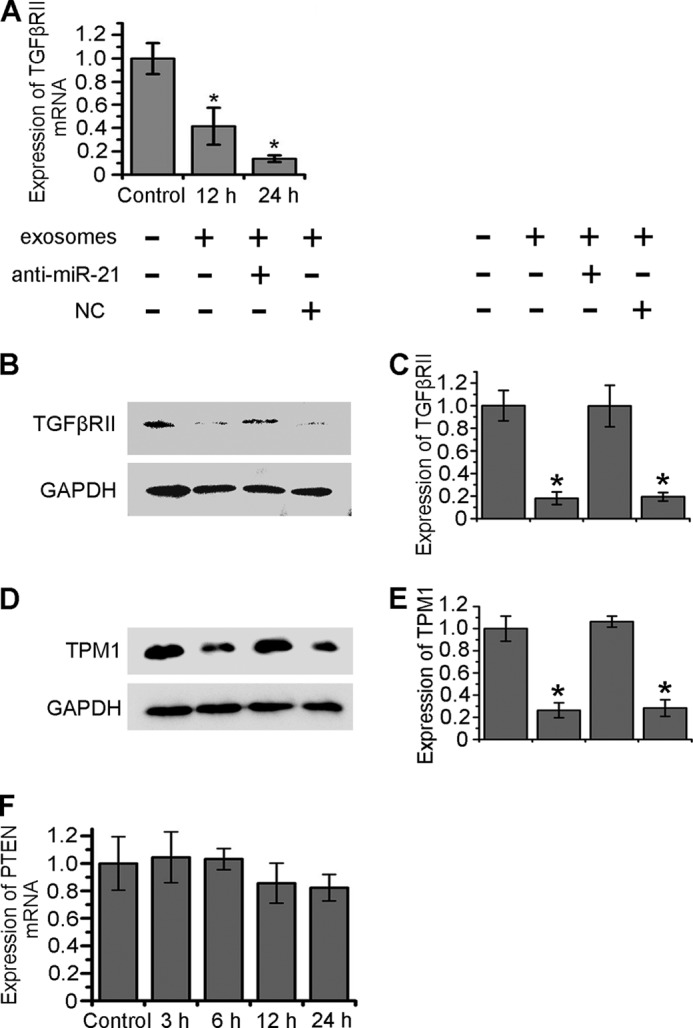
Exosomes are nanoscale membrane vesicles secreted from many types of cells. Carrying functional molecules, exosomes transfer information between cells and mediate many physiological and pathological processes. In this report, utilizing selective inhibitors, molecular tools, and specific endocytosis markers, the cellular uptake of PC12 cell-derived exosomes was imaged by high-throughput microscopy and statistically analyzed. It was found that the uptake was through clathrin-mediated endocytosis and macropinocytosis. Furthermore, PC12 cell-derived exosomes can enter and deliver microRNAs (miRNAs) into bone marrow-derived mesenchymal stromal cells (BMSCs), and decrease the expression level of transforming growth factor β receptor II (TGFβRII) and tropomyosin-1 (TPM1) through miR-21. These results show the pathway of exosome internalization and demonstrate that tumor cell-derived exosomes regulate target gene expression in normal cells.

Keywords: Cell-Cell Interaction; Endocytosis; Exosome; Extracellular Vesicles; microRNA (miRNA).


Figures

FIGURE 1.
FIGURE 1.
Exosome images and control for pharmacological experiments. A, image of exosomes under electron microscope (scale bar, 200 nm). (B) DiD (red) or CFSE (green)-labeled exosomes detected by fluorescence microscopy (scale bars, 2 μm). C, PC12 cells were pretreated with various inhibitors or not (as control), and then incubated with FITC-transferrin, FITC-dextran, or FITC-CtxB. Uptake was quantified by determining the fluorescence intensity. D, PC12 cells were incubated with exosomes at 37°C for 3 h in the presence or absence (as control) of 0.1% DMSO. Exosome uptake was quantified by determining the fluorescence intensity. E, viability of PC12 cells under the presence or absence (as control) of various treatments at 37°C for 4 h determined by fluorescence intensity of calcein AM. The values are normalized to the control. Mean ± SD of three independent experiments is shown.
FIGURE 2.
FIGURE 2.
Role of clathrin-mediated endocytosis in exosome uptake. A, confocal images of PC12 cells incubated with DiD-labeled exosomes at 37 °C for 3 h in K+ depletion buffer with (as control) or without KCl. B, confocal images of PC12 cells pretreated with CPZ or not for 30 min, and then incubated with exosomes at 37 °C for 3 h. C and D, exosome uptake under various treatments and control was quantified by determining the fluorescence intensity. E, confocal images of PC12 cells pretreated with 10 μm CPZ or not for 30 min, and then incubated with CFSE-labeled exosomes at 37 °C for 3 h. Exosome uptake was quantified by determining the fluorescence intensity. All scale bars above, 15 μm. F, Western blots of CHC after 48 h of treatment of corresponding siRNA. G, CHC expression level was quantified by determining the gray value. H, confocal images of cells pretreated with siRNA against CHC or NC for 48 h, and then incubated with exosomes at 37 °C for 3 h. Scale bar, 20 μm. I, exosome uptake was quantified by determining the fluorescence intensity. J, fluorescence images of PC12 cells transfected with μ2-shRNA (GFP tagged), μ2-res (mCherry tagged), and merged together. Scale bar, 50 μm. PCR (K) and Western blot (L) results of μ2 48 h after transfection of NC, μ2-shRNA, or μ2-shRNA and μ2-res together. M, μ2 expression level was quantified by determining the gray value. N, confocal images of cells 48 h after transfection of NC, μ2-shRNA, μ2-D176A, or μ2-shRNA and μ2-res together, and then incubated with exosomes at 37 °C for 3 h. Scale bar, 20 μm. O, exosome uptake was quantified by determining the fluorescence intensity. In all the confocal images, red refers to DiD-labeled exosomes, and blue indicates nuclei. All the values are normalized to the control. For all the quantification plots, mean ± S.D. of three independent experiments is shown. Values significantly different (p < 0.05) from control are marked with asterisks.
FIGURE 3.
FIGURE 3.
Role of macropinocytosis in exosome uptake. A and C, confocal images of PC12 cells pretreated with various concentrations of EIPA (A) or LY294002 (C) for 30 min, and then incubated with exosomes at 37 °C for 3 h. B and D, exosome uptake under various treatments and control was quantified by determining the fluorescence intensity. The values are normalized to the control. E, confocal images of PC12 cells incubated with DiD-labeled exosomes (red) and FITC-dextran (green) for 10 min, 30 min, or 1 h. Yellow indicates the colocalization of exosomes and dextran. F, quantification of the colocalization of exosomes and dextran at various time points. In all the images, red refers to DiD-labeled exosomes, and blue indicates nuclei. For all the quantification plots, mean ± SD of three independent experiments is shown. Values significantly different (p < 0.05) from control are marked with asterisks. All the scale bars are 15 μm.
FIGURE 4.
FIGURE 4.
Role of caveolae-mediated endocytosis in exosome uptake. A and B, confocal images of PC12 cells pretreated with various concentrations of genistein for 30 min (A), or nystatin for 1 h and washing (B), and then incubated with exosomes at 37 °C for 3 h. The exposure time for B was shortened to prevent overexposure. C and D, exosome uptake under various treatments was quantified by determining the fluorescence intensity. The values are normalized to the control. E, cells were pretreated with 10 mm MβCD or 0.1 mg/mL CtxB for 1 h and washing, or without any pretreatment (as control), and then incubated with exosomes at 37 °C for 3 h. Confocal imaging was performed afterward. All the scale bars above, 15 μm. F, exosome uptake under various treatments and control was quantified by determining the fluorescence intensity. The values are normalized to the control. G, fluorescence images of PC12 cells transfected with CAV1-shRNA (GFP tagged), CAV1-res (mCherry tagged), and merged together. Scale bar, 50 μm. PCR (H) and Western blot (I) results of CAV1 48 h after transfection of NC, CAV1-shRNA or CAV1-shRNA and CAV1-res together. J, CAV1 expression level was quantified by determining the gray value. K, confocal images of cells 48 h after transfection of NC, CAV1-shRNA, CAV1-P132L, or CAV1-shRNA and CAV1-res together, and then incubated with exosomes at 37 °C for 3 h. Scale bar, 20 μm. L, exosome uptake was quantified by determining the fluorescence intensity. In all the confocal images, red refers to DiD-labeled exosomes, and blue indicates nuclei. For all the quantification plots, mean ± S.D. of three independent experiments is shown. Values significantly different (p < 0.05) from control are marked with asterisks.
FIGURE 5.
FIGURE 5.
Colocalization test with CtxB, role of DYN2 and phagocytosis in exosome uptake. A, merging of bright-field images and confocal images of PC12 cells incubated with exosomes and FITC-CtxB (green) for 10 min, 30 min, or 1 h. Yellow indicates the colocalization of exosomes and CtxB (scale bars, 15 μm). B, quantification of the colocalization of exosomes and CtxB at various time points. C, Western blot results of DYN2 48 h after transfection of NC or DYN2-shRNA. D, DYN2 expression level was quantified by determining the gray value. E, confocal images of cells transfected with NC or DYN2-shRNA for 48 h, and then incubated with exosomes at 37 °C for 3 h. Scale bar, 20 μm. F, exosome uptake was quantified by determining the fluorescence intensity. G, merging of bright-field images and confocal images of PC12 cells incubated with exosomes and FITC-labeled latex beads (green) at 37 °C for 3 h. Scale bar, 50 μm. In all the images, red refers to DiD-labeled exosomes, and blue indicates nuclei. For all the quantification plots, mean ± S.D. of three independent experiments is shown.
FIGURE 6.
FIGURE 6.
Delivery of miR-21 into BMSCs through exosomes. A, merging of bright-field images and confocal images of BMSCs incubated with DiD-labeled exosomes for 3 h. Red refers to exosomes, and blue indicates nuclei (scale bar, 20 μm). B and C, miR-21 and pre-miR-21 levels in BMSCs incubated with PC12 cell-derived exosomes for 0 (as control), 3, 6, 12, and 24 h according to RT-PCR results. D, miR-21 levels in BMSCs incubated with H9C2 cell-derived exosomes for 0 (as control), 3, 6, 12, and 24 h according to RT-PCR results. For all the quantification plots, values are normalized to the control, and mean ± S.D. of three independent experiments is shown. Values significantly different (p < 0.05) from control are marked with asterisks.
FIGURE 7.
FIGURE 7.
Reduction of TGFβRII and TPM1 expression level in BMSCs through exosomes. A, TGFβRII mRNA levels in BMSCs incubated with exosomes for 0 (as control), 3, 6, 12, and 24 h according to RT-PCR results. B and D, 24 h after transfection of NC or anti-miR-21, Western Blot was performed to analyze the expression of TGFβRII and TPM1 in BMSCs incubated with PC12 cell-derived exosomes at 37 °C for 24 h. C and E, TGFβRII and TPM1 expression levels were quantified by determining the gray value. F, PTEN mRNA levels in BMSCs incubated with exosomes for 0 (as control), 12, and 24 h according to RT-PCR results. For all the quantification plots, values are normalized to the control, and mean ± S.D. of three independent experiments is shown. Values significantly different (p < 0.05) from control are marked with asterisks.

References

    1. Stoorvogel W., Kleijmeer M. J., Geuze H. J., Raposo G. (2002) The biogenesis and functions of exosomes. Traffic 3, 321–330 - PubMed
    1. Mathivanan S., Ji H., Simpson R. J. (2010) Exosomes: extracellular organelles important in intercellular communication. J. Proteomics 73, 1907–1920 - PubMed
    1. de Gassart A., Géminard C., Hoekstra D., Vidal M. (2004) Exosome secretion: the art of reutilizing nonrecycled proteins? Traffic 5, 896–903 - PubMed
    1. Zhang F., Sun S., Feng D., Zhao W. L., Sui S. F. (2009) A novel strategy for the invasive toxin: hijacking exosome-mediated intercellular trafficking. Traffic 10, 411–424 - PubMed
    1. Chen X., Gao C., Li H., Huang L., Sun Q., Dong Y., Tian C., Gao S., Dong H., Guan D., Hu X., Zhao S., Li L., Zhu L., Yan Q., Zhang J., Zen K., Zhang C. Y. (2010) Identification and characterization of microRNAs in raw milk during different periods of lactation, commercial fluid, and powdered milk products. Cell Res. 20, 1128–1137 - PubMed

Publication types

MeSH terms