

Association of levels of fasting glucose and insulin with rare variants at the chromosome 11p11.2-MADD locus: Cohorts for Heart and Aging Research in Genomic Epidemiology (CHARGE) Consortium Targeted Sequencing Study
- PMID: 24951664
- PMCID: PMC4066205
- DOI: 10.1161/CIRCGENETICS.113.000169
Association of levels of fasting glucose and insulin with rare variants at the chromosome 11p11.2-MADD locus: Cohorts for Heart and Aging Research in Genomic Epidemiology (CHARGE) Consortium Targeted Sequencing Study
Abstract
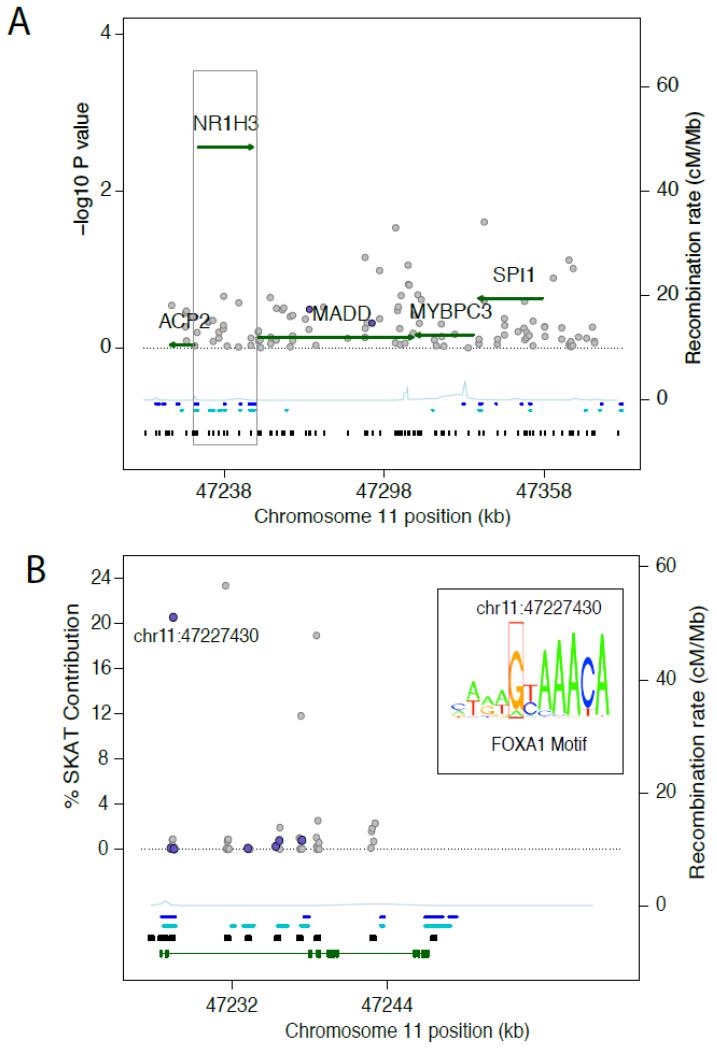
Background: Common variation at the 11p11.2 locus, encompassing MADD, ACP2, NR1H3, MYBPC3, and SPI1, has been associated in genome-wide association studies with fasting glucose and insulin (FI). In the Cohorts for Heart and Aging Research in Genomic Epidemiology Targeted Sequencing Study, we sequenced 5 gene regions at 11p11.2 to identify rare, potentially functional variants influencing fasting glucose or FI levels.
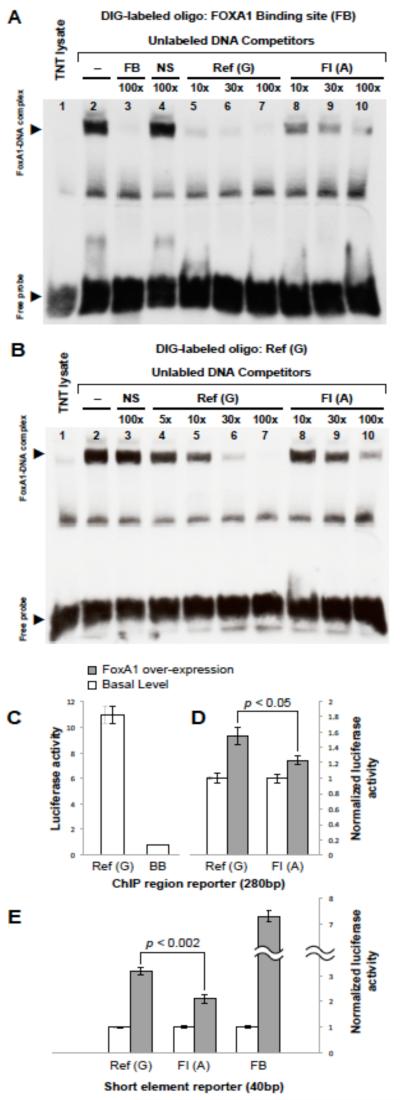
Methods and results: Sequencing (mean depth, 38×) across 16.1 kb in 3566 individuals without diabetes mellitus identified 653 variants, 79.9% of which were rare (minor allele frequency <1%) and novel. We analyzed rare variants in 5 gene regions with FI or fasting glucose using the sequence kernel association test. At NR1H3, 53 rare variants were jointly associated with FI (P=2.73×10(-3)); of these, 7 were predicted to have regulatory function and showed association with FI (P=1.28×10(-3)). Conditioning on 2 previously associated variants at MADD (rs7944584, rs10838687) did not attenuate this association, suggesting that there are >2 independent signals at 11p11.2. One predicted regulatory variant, chr11:47227430 (hg18; minor allele frequency=0.00068), contributed 20.6% to the overall sequence kernel association test score at NR1H3, lies in intron 2 of NR1H3, and is a predicted binding site for forkhead box A1 (FOXA1), a transcription factor associated with insulin regulation. In human HepG2 hepatoma cells, the rare chr11:47227430 A allele disrupted FOXA1 binding and reduced FOXA1-dependent transcriptional activity.
Conclusions: Sequencing at 11p11.2-NR1H3 identified rare variation associated with FI. One variant, chr11:47227430, seems to be functional, with the rare A allele reducing transcription factor FOXA1 binding and FOXA1-dependent transcriptional activity.
Keywords: genetic epidemiology; glucose; human genetics; insulin; molecular genetics.
© 2014 American Heart Association, Inc.
Figures
Similar articles
-
Sequence variation in TMEM18 in association with body mass index: Cohorts for Heart and Aging Research in Genomic Epidemiology (CHARGE) Consortium Targeted Sequencing Study.Circ Cardiovasc Genet. 2014 Jun;7(3):344-9. doi: 10.1161/CIRCGENETICS.13.000067. Circ Cardiovasc Genet. 2014. PMID: 24951660 Free PMC article.
-
ADAM19 and HTR4 variants and pulmonary function: Cohorts for Heart and Aging Research in Genomic Epidemiology (CHARGE) Consortium Targeted Sequencing Study.Circ Cardiovasc Genet. 2014 Jun;7(3):350-8. doi: 10.1161/CIRCGENETICS.113.000066. Circ Cardiovasc Genet. 2014. PMID: 24951661 Free PMC article.
-
Strategies to design and analyze targeted sequencing data: cohorts for Heart and Aging Research in Genomic Epidemiology (CHARGE) Consortium Targeted Sequencing Study.Circ Cardiovasc Genet. 2014 Jun;7(3):335-43. doi: 10.1161/CIRCGENETICS.113.000350. Circ Cardiovasc Genet. 2014. PMID: 24951659 Free PMC article.
-
Meta-analysis investigating associations between healthy diet and fasting glucose and insulin levels and modification by loci associated with glucose homeostasis in data from 15 cohorts.Am J Epidemiol. 2013 Jan 15;177(2):103-15. doi: 10.1093/aje/kws297. Epub 2012 Dec 19. Am J Epidemiol. 2013. PMID: 23255780 Free PMC article. Review.
-
Recent advances in understanding the genetic architecture of type 2 diabetes.Hum Mol Genet. 2015 Oct 15;24(R1):R85-92. doi: 10.1093/hmg/ddv264. Epub 2015 Jul 9. Hum Mol Genet. 2015. PMID: 26160912 Free PMC article. Review.
Cited by
-
Shared genetic architecture between metabolic traits and Alzheimer's disease: a large-scale genome-wide cross-trait analysis.Hum Genet. 2019 Mar;138(3):271-285. doi: 10.1007/s00439-019-01988-9. Epub 2019 Feb 25. Hum Genet. 2019. PMID: 30805717 Free PMC article.
-
A mutation in LXRα uncovers a role for cholesterol sensing in limiting metabolic dysfunction-associated steatohepatitis.Nat Commun. 2025 Jan 28;16(1):1102. doi: 10.1038/s41467-025-56565-8. Nat Commun. 2025. PMID: 39875396 Free PMC article.
-
The Roles of White Adipose Tissue and Liver NADPH in Dietary Restriction-Induced Longevity.Antioxidants (Basel). 2024 Jul 8;13(7):820. doi: 10.3390/antiox13070820. Antioxidants (Basel). 2024. PMID: 39061889 Free PMC article. Review.
-
A Novel Mutation in LXRα Uncovers a Role for Cholesterol Sensing in Limiting Metabolic Dysfunction-Associated Steatohepatitis (MASH).bioRxiv [Preprint]. 2024 May 15:2024.05.13.593869. doi: 10.1101/2024.05.13.593869. bioRxiv. 2024. Update in: Nat Commun. 2025 Jan 28;16(1):1102. doi: 10.1038/s41467-025-56565-8. PMID: 38798597 Free PMC article. Updated. Preprint.
-
Retinal microvascular calibre and risk of diabetes mellitus: a systematic review and participant-level meta-analysis.Diabetologia. 2015 Nov;58(11):2476-85. doi: 10.1007/s00125-015-3717-2. Epub 2015 Aug 2. Diabetologia. 2015. PMID: 26232097 Free PMC article.
References
-
- Lumley T, Dupuis J, Rice KM, Barbalic M, Bis JC, Cupples LA, et al. Two-phase subsampling designs for genomic resequencing studies. submitted.
Publication types
MeSH terms
Substances
Grants and funding
- 5RC2HL102419/HL/NHLBI NIH HHS/United States
- HHSN268201100010C/HL/NHLBI NIH HHS/United States
- HHSN268201100011I/HL/NHLBI NIH HHS/United States
- R01 HL087652/HL/NHLBI NIH HHS/United States
- R01 HL105756/HL/NHLBI NIH HHS/United States
- K24 DK080140/DK/NIDDK NIH HHS/United States
- R01 HL080295/HL/NHLBI NIH HHS/United States
- HHSN268201100007I/HL/NHLBI NIH HHS/United States
- N01 HC085081/HL/NHLBI NIH HHS/United States
- R01 DK078616/DK/NIDDK NIH HHS/United States
- HHSN268201100012C/HL/NHLBI NIH HHS/United States
- HHSN268201000010C/HL/NHLBI NIH HHS/United States
- N02-HL-6-4278/HL/NHLBI NIH HHS/United States
- N01-HC-25195/HC/NHLBI NIH HHS/United States
- RC2 HL102419/HL/NHLBI NIH HHS/United States
- HHSN268201100001I/HL/NHLBI NIH HHS/United States
- HHSN268201100009I/HL/NHLBI NIH HHS/United States
- N01 HC085080/HL/NHLBI NIH HHS/United States
- HHSN268201100008C/HL/NHLBI NIH HHS/United States
- U01 HL080295/HL/NHLBI NIH HHS/United States
- R01DK078616/DK/NIDDK NIH HHS/United States
- HHSN268201100008I/HL/NHLBI NIH HHS/United States
- HHSN268201100005G/HL/NHLBI NIH HHS/United States
- N01 HC085082/HL/NHLBI NIH HHS/United States
- HHSN268201100007C/HL/NHLBI NIH HHS/United States
- HL105756/HL/NHLBI NIH HHS/United States
- HHSN268200800007C/HL/NHLBI NIH HHS/United States
- N01 HC085086/HL/NHLBI NIH HHS/United States
- N01 HC085083/HL/NHLBI NIH HHS/United States
- HL087652/HL/NHLBI NIH HHS/United States
- UL1 TR000124/TR/NCATS NIH HHS/United States
- U54 HG003273/HG/NHGRI NIH HHS/United States
- P30 DK063491/DK/NIDDK NIH HHS/United States
- HHSN268201100006C/HL/NHLBI NIH HHS/United States
- HHSN268201200036C/HL/NHLBI NIH HHS/United States
- N01 HC025195/HL/NHLBI NIH HHS/United States
- N01 HC055222/HL/NHLBI NIH HHS/United States
- HHSN268201100005I/HL/NHLBI NIH HHS/United States
- N01 HC085079/HL/NHLBI NIH HHS/United States
- HHSN268201100002C/WH/WHI NIH HHS/United States
- HHSN268201100009C/HL/NHLBI NIH HHS/United States
- HHSN268201100005C/HL/NHLBI NIH HHS/United States
- HHSN268201100002I/HL/NHLBI NIH HHS/United States
- HL080295/HL/NHLBI NIH HHS/United States
- HHSN268201000012C/HL/NHLBI NIH HHS/United States
- R01 AG023629/AG/NIA NIH HHS/United States
- AG023629/AG/NIA NIH HHS/United States
- R56 AG023629/AG/NIA NIH HHS/United States
- HHSN268201100001C/WH/WHI NIH HHS/United States
LinkOut - more resources
Full Text Sources
Other Literature Sources
Medical
Miscellaneous
