Voxel-based dipole orientation constraints for distributed current estimation
- PMID: 24951674
- PMCID: PMC4203378
- DOI: 10.1109/TBME.2014.2312713
Voxel-based dipole orientation constraints for distributed current estimation
Abstract
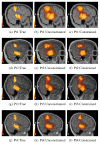
Distributed electroencephalography source localization is a highly ill-posed problem. With measurements on the order of 10(2), and unknowns in the range of 10(4)-10(5), the range of feasible solutions is quite large. One approach to reducing ill-posedness is to intelligently reduce the number of unknowns. Restricting solutions to gray matter is one approach. A further step is to use the anatomy of each patient to identify and constrain the orientation of the dipole within each voxel. While dipole orientation constraints for cortical patch-based approaches have been proposed, to our knowledge, no solutions for full volumetric localizations have been presented. Patch techniques account for patch surface area, but place dipoles only on the surface, rather than throughout the cortex. Variability in human cortical thickness means that thicker regions of cortex will potentially contribute more to the EEG signal, and should be accounted for in modeling. Additionally, patch models require cortical surface identification techniques, which can separate them from the extensive literature on voxel-based MR image processing, and require additional adaptation to incorporate more complex information. We present a volumetric approach for computing voxel-based distributed estimates of cortical activity with constrained dipole orientations. Using a tissue thickness estimation approach, we obtain estimates of the cortical surface normal at each voxel. These let us constrain the inverse problem, and yield localizations with reduced spatial blurring and better identification of signal magnitude within the cortex. This is demonstrated for a series of simulated and experimental data using patient-specific bioelectric models.
Figures


Similar articles
-
Dipole estimation errors due to differences in modeling anisotropic conductivities in realistic head models for EEG source analysis.Phys Med Biol. 2008 Apr 7;53(7):1877-94. doi: 10.1088/0031-9155/53/7/005. Epub 2008 Mar 10. Phys Med Biol. 2008. PMID: 18364544
-
On noninvasive source imaging of the human K-complex.Clin Neurophysiol. 2013 May;124(5):941-55. doi: 10.1016/j.clinph.2012.10.022. Epub 2012 Nov 29. Clin Neurophysiol. 2013. PMID: 23200316
-
Anisotropic partial volume CSF modeling for EEG source localization.Neuroimage. 2012 Sep;62(3):2161-70. doi: 10.1016/j.neuroimage.2012.05.055. Epub 2012 May 29. Neuroimage. 2012. PMID: 22652021 Free PMC article.
-
Mapping human brain function with MEG and EEG: methods and validation.Neuroimage. 2004;23 Suppl 1:S289-99. doi: 10.1016/j.neuroimage.2004.07.014. Neuroimage. 2004. PMID: 15501098 Review.
-
Development of volume conductor and source models to localize epileptic foci.J Clin Neurophysiol. 2007 Apr;24(2):101-19. doi: 10.1097/WNP.0b013e318038fb3e. J Clin Neurophysiol. 2007. PMID: 17414966 Review.
Cited by
-
A Novel Bayesian Approach for EEG Source Localization.Comput Intell Neurosci. 2020 Oct 30;2020:8837954. doi: 10.1155/2020/8837954. eCollection 2020. Comput Intell Neurosci. 2020. PMID: 33178259 Free PMC article.
-
Lesion-Constrained Electrical Source Imaging: A Novel Approach in Epilepsy Surgery for Tuberous Sclerosis Complex.J Clin Neurophysiol. 2020 Jan;37(1):79-86. doi: 10.1097/WNP.0000000000000615. J Clin Neurophysiol. 2020. PMID: 31261349 Free PMC article.
-
Multi-Resolution Graph Based Volumetric Cortical Basis Functions From Local Anatomic Features.IEEE Trans Biomed Eng. 2019 Dec;66(12):3381-3392. doi: 10.1109/TBME.2019.2904473. Epub 2019 Mar 13. IEEE Trans Biomed Eng. 2019. PMID: 30872218 Free PMC article.
-
Dynamic Electrical Source Imaging (DESI) of Seizures and Interictal Epileptic Discharges Without Ensemble Averaging.IEEE Trans Med Imaging. 2017 Jan;36(1):98-110. doi: 10.1109/TMI.2016.2595329. Epub 2016 Jul 27. IEEE Trans Med Imaging. 2017. PMID: 27479957 Free PMC article.
References
-
- Kaiboriboon K, Lüders HO, Hamaneh M, Turnbull J, Lhatoo SD. EEG source imaging in epilepsy–practicalities and pitfalls. Nature reviews Neurology. 2012 Sep;8(9):498–507. - PubMed
-
- Ebersole JS. EEG dipole modeling in complex partial epilepsy. Brain topography. 1991;4(2):113–123. - PubMed
-
- Ebersole JS. Non-invasive localization of the epileptogenic focus by EEG dipole modeling. Acta neurologica Scandinavica Supplementum. 1994;152:20–28. - PubMed
-
- Rose S, Ebersole JS. Advances in spike localization with EEG dipole modeling. Clinical EEG and neuroscience: official journal of the EEG and Clinical Neuroscience Society (ENCS) 2009 Oct;40(4):281–287. - PubMed
Publication types
MeSH terms
Grants and funding
LinkOut - more resources
Full Text Sources
Other Literature Sources

