

Comparative evaluation of registration algorithms in different brain databases with varying difficulty: results and insights
- PMID: 24951685
- PMCID: PMC4371548
- DOI: 10.1109/TMI.2014.2330355
Comparative evaluation of registration algorithms in different brain databases with varying difficulty: results and insights
Abstract
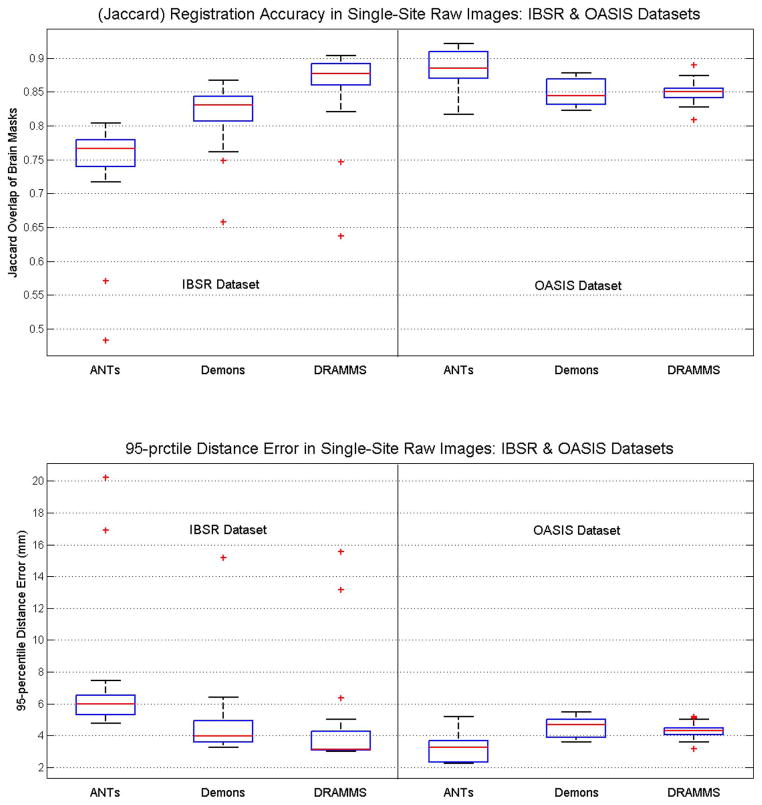
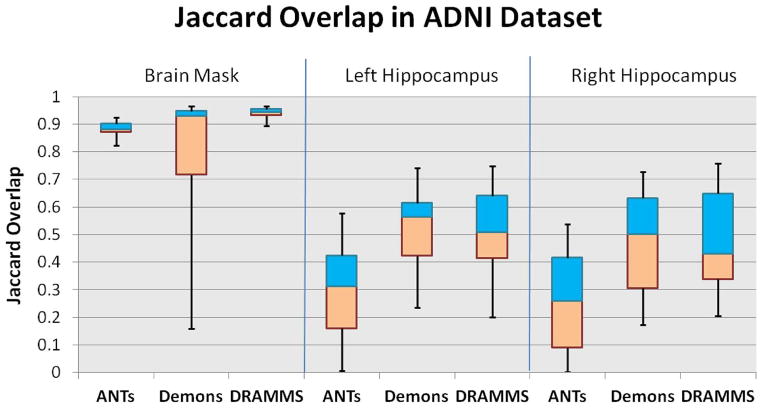
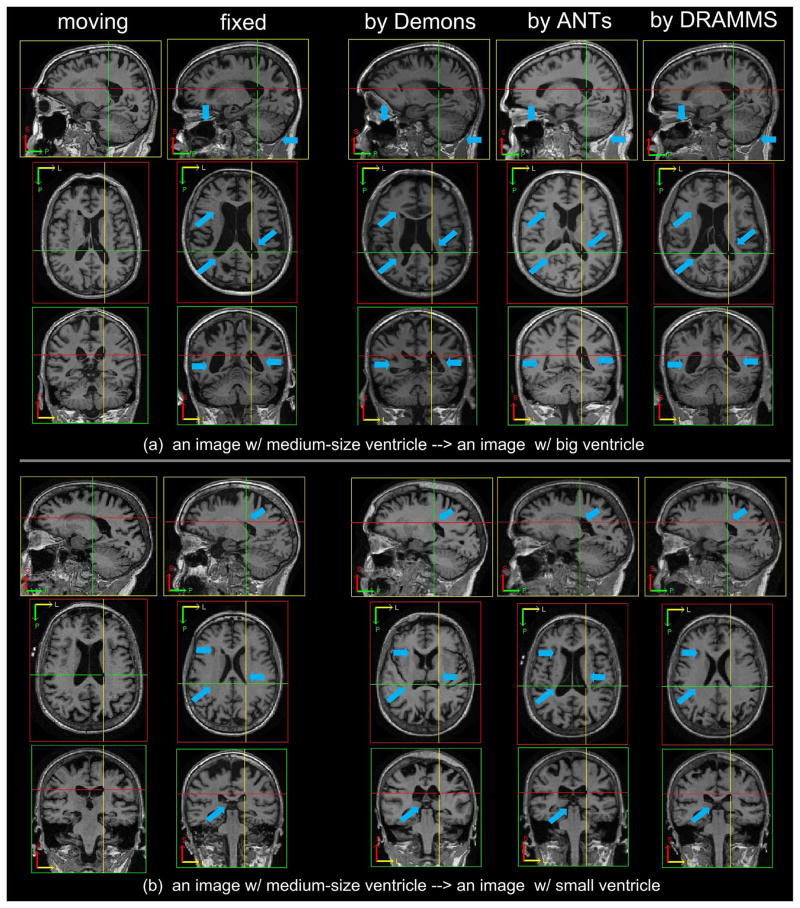
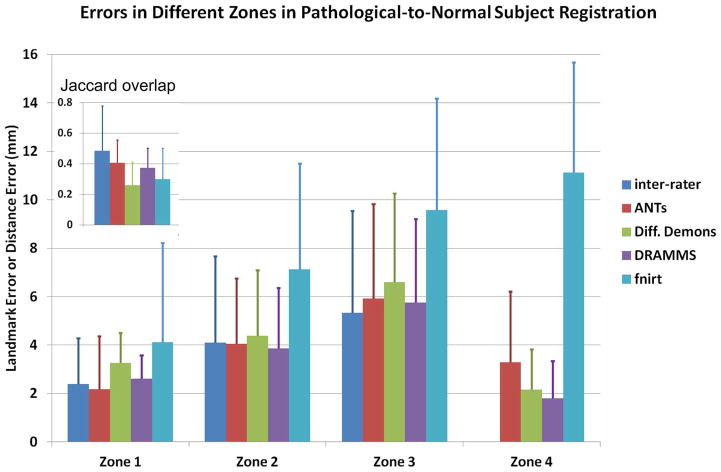
Evaluating various algorithms for the inter-subject registration of brain magnetic resonance images (MRI) is a necessary topic receiving growing attention. Existing studies evaluated image registration algorithms in specific tasks or using specific databases (e.g., only for skull-stripped images, only for single-site images, etc.). Consequently, the choice of registration algorithms seems task- and usage/parameter-dependent. Nevertheless, recent large-scale, often multi-institutional imaging-related studies create the need and raise the question whether some registration algorithms can 1) generally apply to various tasks/databases posing various challenges; 2) perform consistently well, and while doing so, 3) require minimal or ideally no parameter tuning. In seeking answers to this question, we evaluated 12 general-purpose registration algorithms, for their generality, accuracy and robustness. We fixed their parameters at values suggested by algorithm developers as reported in the literature. We tested them in 7 databases/tasks, which present one or more of 4 commonly-encountered challenges: 1) inter-subject anatomical variability in skull-stripped images; 2) intensity homogeneity, noise and large structural differences in raw images; 3) imaging protocol and field-of-view (FOV) differences in multi-site data; and 4) missing correspondences in pathology-bearing images. Totally 7,562 registrations were performed. Registration accuracies were measured by (multi-)expert-annotated landmarks or regions of interest (ROIs). To ensure reproducibility, we used public software tools, public databases (whenever possible), and we fully disclose the parameter settings. We show evaluation results, and discuss the performances in light of algorithms' similarity metrics, transformation models and optimization strategies. We also discuss future directions for the algorithm development and evaluations.
Figures
Similar articles
-
Deformable MRI-Ultrasound registration using correlation-based attribute matching for brain shift correction: Accuracy and generality in multi-site data.Neuroimage. 2019 Nov 15;202:116094. doi: 10.1016/j.neuroimage.2019.116094. Epub 2019 Aug 22. Neuroimage. 2019. PMID: 31446127 Free PMC article.
-
Registration of images with varying topology using embedded maps.IEEE Trans Med Imaging. 2012 Mar;31(3):749-65. doi: 10.1109/TMI.2011.2178609. Epub 2011 Dec 20. IEEE Trans Med Imaging. 2012. PMID: 22194239
-
Automatic MRI 2D brain segmentation using graph searching technique.Int J Numer Method Biomed Eng. 2013 Sep;29(9):887-904. doi: 10.1002/cnm.2498. Epub 2012 Jun 27. Int J Numer Method Biomed Eng. 2013. PMID: 23757180
-
An open, multi-vendor, multi-field-strength brain MR dataset and analysis of publicly available skull stripping methods agreement.Neuroimage. 2018 Apr 15;170:482-494. doi: 10.1016/j.neuroimage.2017.08.021. Epub 2017 Aug 12. Neuroimage. 2018. PMID: 28807870 Review.
-
Integrating Morphological Edge Detection and Mutual Information for Nonrigid Registration of Medical Images.Curr Med Imaging Rev. 2019;15(3):292-300. doi: 10.2174/1573405614666180103163430. Curr Med Imaging Rev. 2019. PMID: 31989880 Review.
Cited by
-
Predicting pediatric optic pathway glioma progression using advanced magnetic resonance image analysis and machine learning.Neurooncol Adv. 2020 Aug 1;2(1):vdaa090. doi: 10.1093/noajnl/vdaa090. eCollection 2020 Jan-Dec. Neurooncol Adv. 2020. PMID: 32885166 Free PMC article.
-
Metabolic and physiologic magnetic resonance imaging in distinguishing true progression from pseudoprogression in patients with glioblastoma.NMR Biomed. 2022 Jul;35(7):e4719. doi: 10.1002/nbm.4719. Epub 2022 Mar 15. NMR Biomed. 2022. PMID: 35233862 Free PMC article. Review.
-
Anatomical brain structures normalization for deep brain stimulation in movement disorders.Neuroimage Clin. 2020;27:102271. doi: 10.1016/j.nicl.2020.102271. Epub 2020 Apr 25. Neuroimage Clin. 2020. PMID: 32446242 Free PMC article.
-
Maternal Childhood Abuse Versus Neglect Associated with Differential Patterns of Infant Brain Development.Res Child Adolesc Psychopathol. 2023 Dec;51(12):1919-1932. doi: 10.1007/s10802-023-01041-4. Epub 2023 May 9. Res Child Adolesc Psychopathol. 2023. PMID: 37160577 Free PMC article.
-
Evaluation of MRI to Ultrasound Registration Methods for Brain Shift Correction: The CuRIOUS2018 Challenge.IEEE Trans Med Imaging. 2020 Mar;39(3):777-786. doi: 10.1109/TMI.2019.2935060. Epub 2019 Aug 13. IEEE Trans Med Imaging. 2020. PMID: 31425023 Free PMC article.
References
-
- Sotiras A, Ou Y, Paragios N, Davatzikos C. Graph-based deformable image registration. In: Paragios N, Duncan J, Ayache N, editors. Handbook of Biomedical Imaging; Methodologies and Clinical Research. New York: Springer; 2015.
-
- Maintz JBA, Viergever MA. A survey of medical image registration. Med Image Anal. 1998;2(1):1–36. - PubMed
-
- Lester H, Arridge S. A survey of hierarchical non-linear medical image registration. Pattern Recognit. 1999;32(1):129–149.
-
- Hill DL, Batchelor PG, Holden M, Hawkes DJ. Medical image registration. Phys Med Biol. 2001;46(3):1–45. - PubMed
MeSH terms
Grants and funding
LinkOut - more resources
Full Text Sources
Other Literature Sources
Medical
