. 2014 Aug 15;307(4):L302-10.
doi: 10.1152/ajplung.00106.2014. Epub 2014 Jun 20.

In situ determination of alveolar septal strain, stress and effective Young's modulus: an experimental/computational approach

Affiliations

In situ determination of alveolar septal strain, stress and effective Young's modulus: an experimental/computational approach

Carrie E Perlman et al. Am J Physiol Lung Cell Mol Physiol. .

Abstract

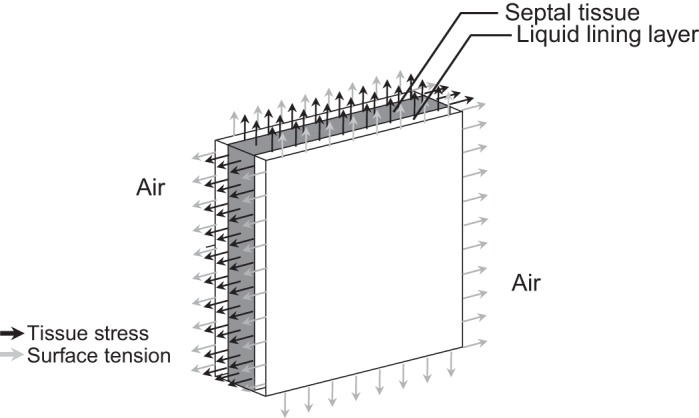
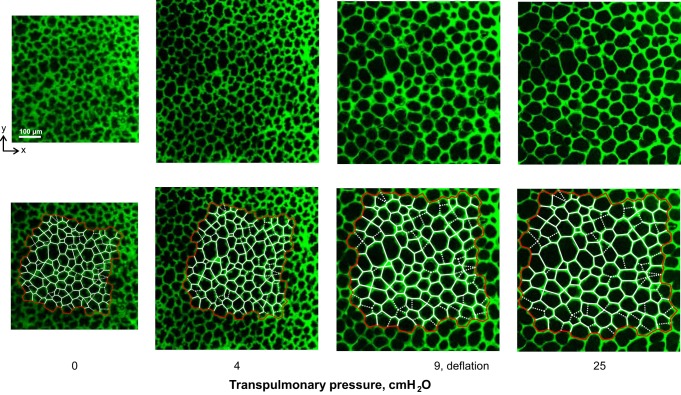
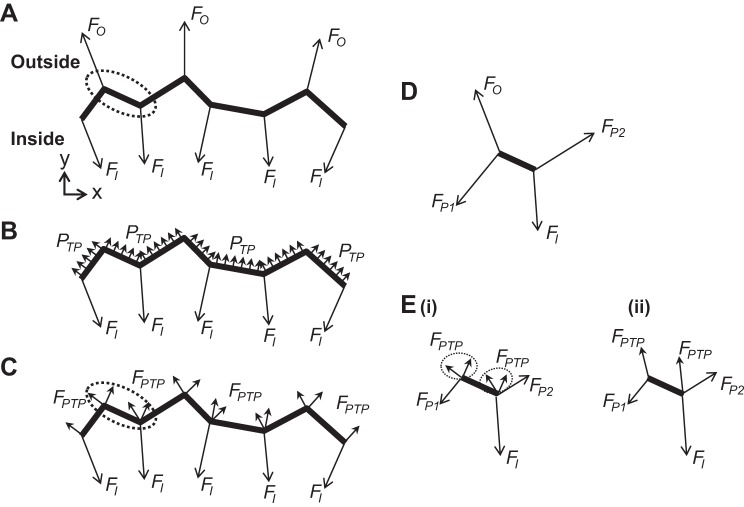
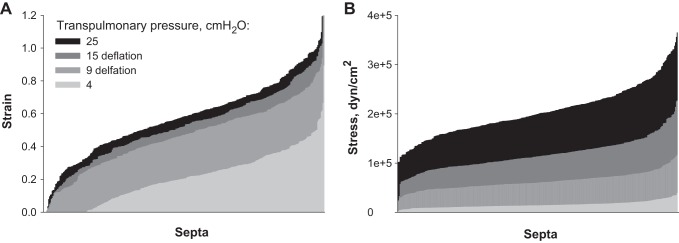
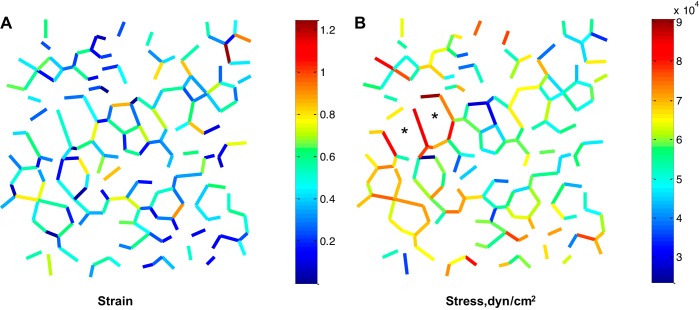
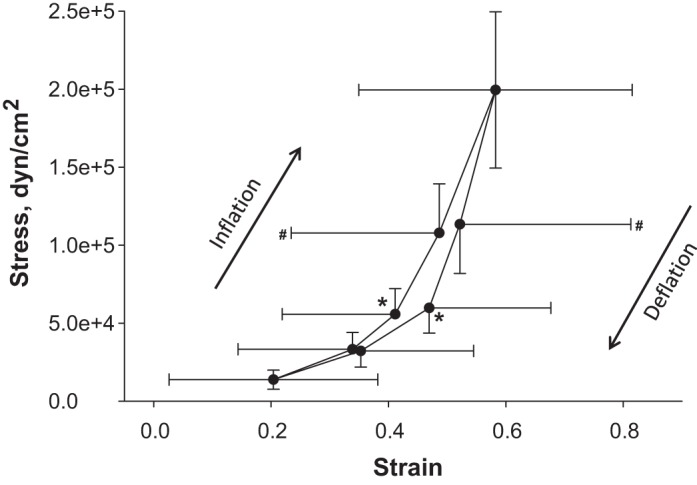
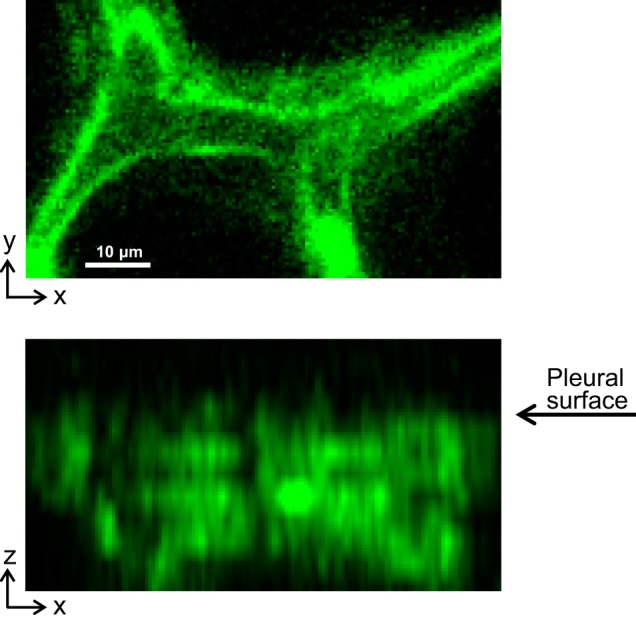
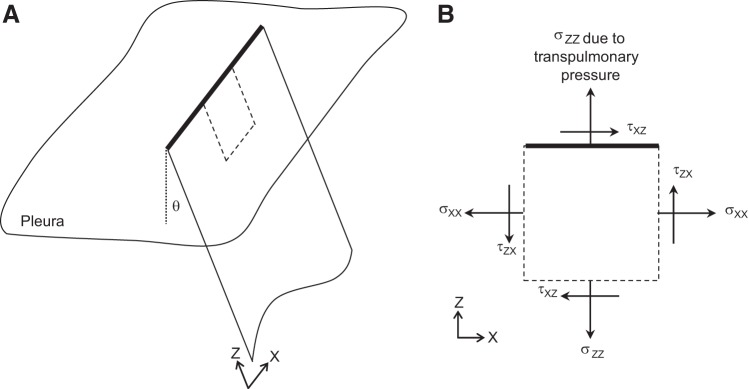
Alveolar septa, which have often been modeled as linear elements, may distend due to inflation-induced reduction in slack or increase in tissue stretch. The distended septum supports tissue elastic and interfacial forces. An effective Young's modulus, describing the inflation-induced relative displacement of septal end points, has not been determined in situ for lack of a means of determining the forces supported by septa in situ. Here we determine such forces indirectly according to Mead, Takishima, and Leith's classic lung mechanics analysis (J Appl Physiol 28: 596-608, 1970), which demonstrates that septal connections transmit the transpulmonary pressure, PTP, from the pleural surface to interior regions. We combine experimental septal strain determination and computational stress determination, according to Mead et al., to calculate effective Young's modulus. In the isolated, perfused rat lung, we label the perfusate with fluorescence to visualize the alveolar septa. At eight PTP values around a ventilation loop between 4 and 25 cmH2O, and upon total deflation, we image the same region by confocal microscopy. Within an analysis region, we measure septal lengths. Normalizing by unstressed lengths at total deflation, we calculate septal strains for all PTP > 0 cmH2O. For the static imaging conditions, we computationally model application of PTP to the boundary of the analysis region and solve for septal stresses by least squares fit of an overdetermined system. From group septal strain and stress values, we find effective septal Young's modulus to range from 1.2 × 10(5) dyn/cm(2) at low P(TP) to 1.4 × 10(6) dyn/cm(2) at high P(TP).

Keywords: alveolar septum; intact lung; modulus; strain; stress.


Figures

Fig. 1.
Fig. 1.
Forces acting on a section of in situ alveolar septum. Alveolar septal tissue (gray) is lined on each side by a thin liquid layer (white). The combined tissue/liquid structure is surrounded by air. At sections through the septum (all 4 edges), tissue stress acts throughout the tissue and surface tension at the air-liquid interface.
Fig. 2.
Fig. 2.
Septal element model. Top: confocal microscopy images of fluorescently labeled vasculature in subpleural alveoli of isolated, perfused rat lung, at 4 transpulmonary pressure, PTP, values, on deflation. At PTP of 4 cmH2O, subpleural depth is 24 μm. Bottom: same images with overlay of alveolar element model. Alveolar septa are represented by linear elements: red on periphery of region to be analyzed, white in interior. Dashed elements indicate cross-bridge structures that arch over the tops of alveoli.
Fig. 3.
Fig. 3.
Subpleural septal morphology. Alveoli imaged at PTP of 4 cmH2O. Top images show xy plane of analysis that is parallel to and 22 μm below the pleural surface. Bottom images show xz sections, with the pleural surface at their tops, constructed from z-stacks of xy optical sections. The xz sections intersect the xy sections along the long axes of the white dotted ovals in the xy sections. A: subpleural septa are typically oriented perpendicular to the pleural surface. Red arrows show capillary thickness, tC, of 4.2 μm. B: what look like cross bridges across some alveoli, as viewed in the xy plane, are arch structures across the tops of the alveoli, as viewed in the xz plane.
Fig. 4.
Fig. 4.
Modeling PTP application to the periphery of the analyzed interior lung region. Heavy line indicates periphery of analyzed lung region. A: according to Mead et al. (12), alveolar septa connecting to the outside of an internal lung region and supporting forces FO transmit PTP to the interior lung region. Septa within the interior region apply forces FI to the periphery of the region. B: as forces FO transmit PTP to the interior region, we replace them, in our analysis, with application of PTP directly to the periphery of the interior region. C: for each peripheral element in our linear element model, we calculate the force FPTP due to pressure acting on the element and apply half of the force at each end point of the element. D: forces acting on peripheral element enclosed by dotted oval in A. Upper left end point is loaded by FO and also FP1 from the connecting peripheral element to left. Lower right end point is loaded by FI and also FP2 from the connecting peripheral element to right. E: forces acting on peripheral element enclosed by dotted oval in C. Force FO at upper left end point of the element in D has been replaced by 4 forces due to PTP, split between both end points (Ei). The 2 forces due to PTP at each end point may be summed (Eii). Replacement of FO at 1 end point of the analyzed peripheral element by FPTP split between its 2 end points reduces loading of the analyzed peripheral element in E compared with that in D.
Fig. 5.
Fig. 5.
Septal strain and stress. Sorted strain (A) and stress (B) data at 4 PTP values on deflation. Data presented for n = 322 septa. Peripheral septa, cross bridges, and septa with an unstressed length L0 < 20 μm are omitted.
Fig. 6.
Fig. 6.
Septal strain and stress values in an imaged/modeled lung region at PTP of 9 cmH2O on deflation. Peripheral septa, cross bridges, and septa with an unstressed length L0 < 20 μm are omitted. *Large alveoli lacking cross bridges.
Fig. 7.
Fig. 7.
Septal stress-strain relation. Median stress vs. median strain at 8 PTP around the ventilation loop, for n = 322 septa. Peripheral septa, cross bridges, and septa with an unstressed length L0 < 20 μm are omitted. Strain and stress both differ significantly (P < 0.05) between the end points of each segment of the stress-strain loop, excepting that there is no difference in strain between PTP of 25 cmH2O and 15 cmH2O on deflation. At PTP of 9 cmH2O (*), strain (P < 0.01) and stress (P < 0.01) are greater on deflation than on inflation. At PTP of 15 cmH2O (#), strain (P < 0.01) is greater on deflation than on inflation.
Fig. A1.
Fig. A1.
A subpleural septum imaged in a perfused (12 ml/min) lung without use of a coverslip at PTP of 15 cmH2O. Top: xy section through septum. Bottom: xz section shows linear border at top of septum where septum intersects with pleural surface. Fluorescence is dye calcein AM loaded into alveolar epithelium.
Fig. A2.
Fig. A2.
Stresses determined in xy analysis plane are principal stresses. Left: schematic of planar subpleural septum and its linear junction with the pleural surface. Although subpleural septa typically meet the pleural surface at an angle, θ, of 90°, analysis (see appendix text) is not restricted to any particular θ value. Right: detail of portion of subpleural septum enclosed by dotted line on left. Normal (σ) and shear (τ) stresses act on each edge of the section, with normal stress σzz on the top edge attributable to application of the PTP to the pleural surface. Because the top edge cannot support a shear stress (see text), all shear stresses are zero and normal stresses σxx and σzz are principal stresses. The xy plane of our stress-strain analysis is aligned the axis of the principal stress σxx.

References

    1. Bachofen H, Schürch S, Urbinelli M, Weibel ER. Relations among alveolar surface tension, surface area, volume, and recoil pressure. J Appl Physiol 62: 1878–1887, 1987 - PubMed
    1. Cavalcante FSA, Ito S, Brewer K, Sakai H, Alencar AM, Almeida MP, Andrade JS, Jr, Majumdar A, Ingenito EP, Suki B. Mechanical interactions between collagen and proteoglycans: implications for the stability of lung tissue. J Appl Physiol 98: 672–679, 2005 - PubMed
    1. Coughlin MF, Stamenović D. A prestressed cable network model of the adherent cell cytoskeleton. Biophys J 84: 1328–1336, 2003 - PMC - PubMed
    1. Fukaya H, Martin CJ, Young AC, Katsura S. Mechanical properties of alveolar walls. J Appl Physiol 25: 689–695, 1968 - PubMed
    1. Fung YC. Biomechanics: Mechanical Properties of Living Tissues (2nd ed.) New York: Springer-Verlag, 1993

Publication types

LinkOut - more resources