. 2014 Oct;70(100):53-68.
doi: 10.1016/j.nbd.2014.06.006. Epub 2014 Jun 18.

Loss of CDKL5 impairs survival and dendritic growth of newborn neurons by altering AKT/GSK-3β signaling

Affiliations

Loss of CDKL5 impairs survival and dendritic growth of newborn neurons by altering AKT/GSK-3β signaling

Claudia Fuchs et al. Neurobiol Dis. 2014 Oct.

Abstract

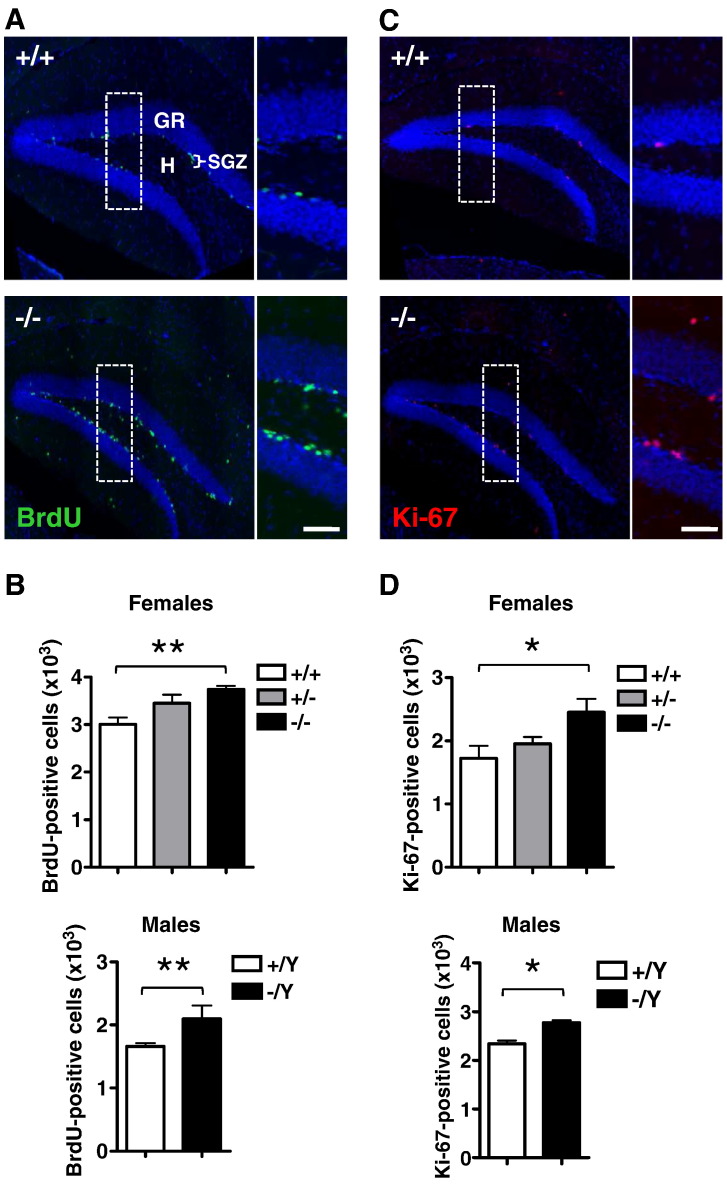
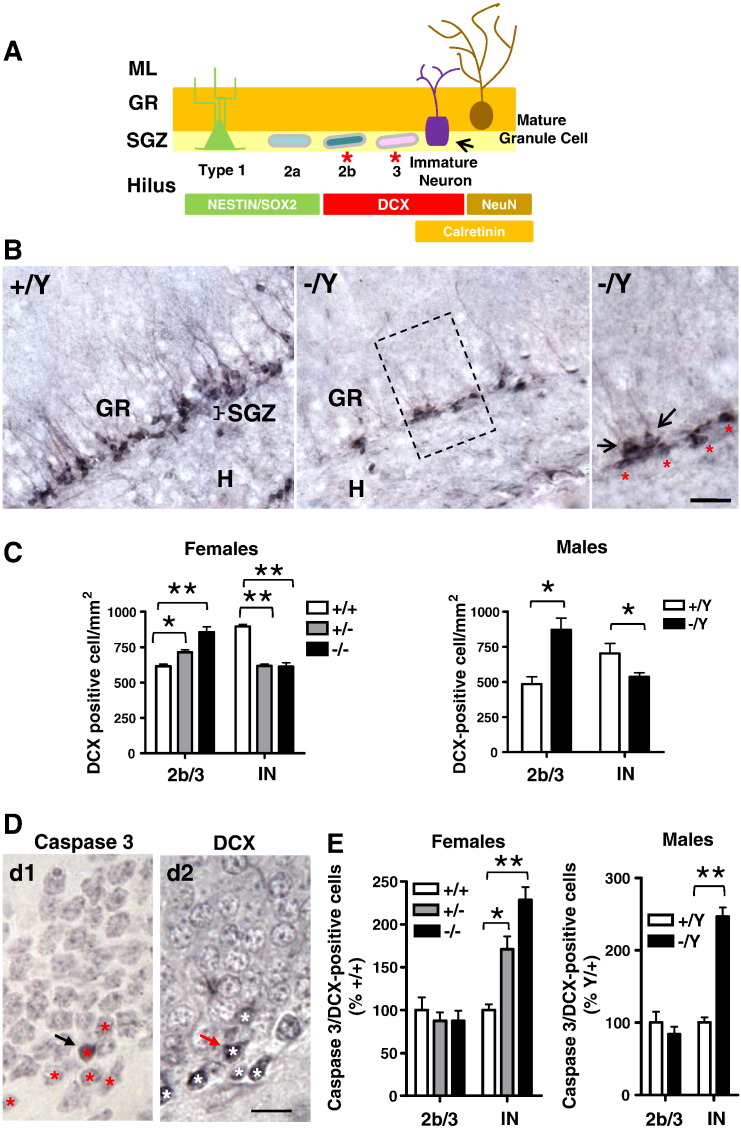
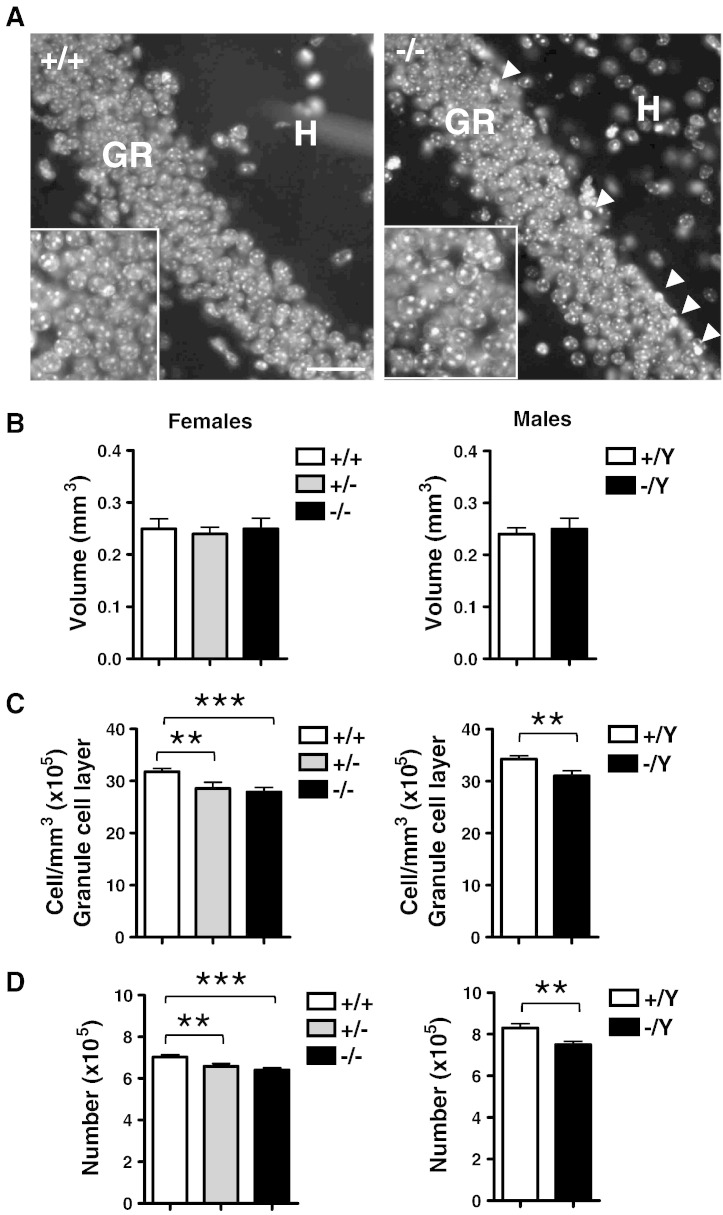
Mutations in the X-linked cyclin-dependent kinase-like 5 (CDKL5) gene have been identified in a neurodevelopmental disorder characterized by early-onset intractable seizures, severe developmental delay, intellectual disability, and Rett's syndrome-like features. Since the physiological functions of CDKL5 still need to be elucidated, in the current study we took advantage of a new Cdkl5 knockout (KO) mouse model in order to shed light on the role of this gene in brain development. We mainly focused on the hippocampal dentate gyrus, a region that largely develops postnatally and plays a key role in learning and memory. Looking at the process of neurogenesis, we found a higher proliferation rate of neural precursors in Cdkl5 KO mice in comparison with wild type mice. However, there was an increase in apoptotic cell death of postmitotic granule neuron precursors, with a reduction in total number of granule cells. Looking at dendritic development, we found that in Cdkl5 KO mice the newly-generated granule cells exhibited a severe dendritic hypotrophy. In parallel, these neurodevelopmental defects were associated with impairment of hippocampus-dependent memory. Looking at the mechanisms whereby CDKL5 exerts its functions, we identified a central role of the AKT/GSK-3β signaling pathway. Overall our findings highlight a critical role of CDKL5 in the fundamental processes of brain development, namely neuronal precursor proliferation, survival and maturation. This evidence lays the basis for a better understanding of the neurological phenotype in patients carrying mutations in the CDKL5 gene.

Keywords: AKT/GSK-3β signaling; CDKL5 disorder; Dendritic development; Neurodevelopmental disorders; Neurogenesis impairment; Rett's syndrome.


Figures

Fig. 1
Fig. 1
Neuronal precursor proliferation in the dentate gyrus of Cdkl5 KO mice. A, B: Animals were injected with BrdU for five consecutive days and sacrificed 24 h after the last BrdU injection on P45. Examples of sections processed for fluorescent immunostaining for BrdU from the dentate gyrus (DG) of wild type (+/+) and homozygous (−/−) Cdkl5 KO female mice (A). Scale bars = 200 μm (lower magnification) and 80 μm (higher magnification). The dotted boxes indicate the regions shown at a higher magnification. Number of BrdU positive cells in the granule cell layer (GR) plus subgranular zone (SGZ) plus hilus (H) of homozygous (−/−; n = 6), heterozygous (+/−; n = 6) and wild type (+/+; n = 5) Cdkl5 KO female mice and hemizygous (−/Y; n = 6) and wild type (+/Y; n = 6) Cdkl5 KO male mice (B). C: Examples of sections processed for fluorescent immunostaining for Ki-67 from the DG of wild type (+/+) and homozygous (−/−) Cdkl5 KO female mice. Scale bars = 200 μm (lower magnification) and 80 μm (higher magnification). D: Number of Ki-67 positive cells in the GR + SGZ + H of the same animals as in B. Values in B to D represent totals for one DG (mean ± SD). (*)p < 0.07; *p < 0.05; **p < 0.01 (Bonferroni's test after ANOVA).
Fig. 2
Fig. 2
Survival of neuronal precursors in the dentate gyrus of Cdkl5 KO mice. A: Examples of sections processed for fluorescent immunostaining for BrdU from the dentate gyrus (DG) of wild type (+/+) and homozygous (−/−) Cdkl5 KO female mice (upper panels). These animals were injected with BrdU for five consecutive days and sacrificed 1 month after the last BrdU injection (on P75). Scale bar = 50 μm. Number of BrdU positive cells in the granule cell layer (GR) plus subgranular zone (SGZ) plus hilus (H) of homozygous (−/−; n = 5), heterozygous (+/−; n = 4) and wild type (+/+; n = 4) Cdkl5 KO female mice and hemizygous (−/Y; n = 4) and wild type (+/Y; n = 4) Cdkl5 KO male mice. B: Examples of sections processed for fluorescent immunostaining for cleaved caspase-3 from the DG of wild type (+/+) and homozygous (−/−) Cdkl5 KO female mice. Scale bars = 40 μm. Number of caspase-3 positive cells in the GR + SGZ + H of homozygous (−/−; n = 6), heterozygous (+/−; n = 6) and wild type (+/+; n = 6) Cdkl5 KO female mice and hemizygous (−/Y; n = 6) and wild type (+/Y; n = 5). Values in A and B represent totals for one DG (mean ± SD). **p < 0.01; ***p < 0.001 (Bonferroni's test after ANOVA).
Fig. 3
Fig. 3
Phenotype of the surviving cells in the dentate gyrus of Cdkl5 KO mice. A, B: Absolute number of surviving cells with a neuronal phenotype (NeuN/BrdU), an astrocytic phenotype (GFAP/BrdU) and an undetermined phenotype (Other; NeuN −/GFAP −/Brdu + cells) in the dentate gyrus (DG) of homozygous (−/−; n = 4), heterozygous (+/−; n = 4) and wild type (+/+; n = 4) Cdkl5 KO female mice (A) and hemizygous (−/Y; n = 4) and wild type (+/Y; n = 4) Cdkl5 KO male mice (B). These animals were injected for five consecutive days with BrdU and sacrificed 1 month after the last BrdU injection (on P75). Values in A and B represent totals for one DG (mean ± SD). **p < 0.01; ***p < 0.001 (Bonferroni's after ANOVA).
Fig. 4
Fig. 4
Survival of postmitotic neurons in the dentate gyrus of Cdkl5 KO mice. A: Diagram of hippocampal neurogenesis. During the mitotic phase, two types of progenitors proliferate in the subgranular zone (SGZ) of the dentate gyrus (DG): primary progenitor cells (type 1 cells, expressing Nestin and Sox2) and intermediate progenitor cells (type 2a/b and type 3 cells). Before becoming postmitotic, type 2b and type 3 intermediate progenitors commit to a neuronal fate and begin expressing DCX. In the postmitotic phase, DCX positive newborn neurons derived from type 3 cells undergo a morphological and physiological maturing process with the sequential expression of calretinin and NeuN upon final maturation. B: Examples of sections processed for DCX immunostaining from the DG of wild type (+/Y) and hemizygous (−/Y) Cdkl5 KO male mice. The high magnification photomicrograph (panel on the right) shows immature DXC positive neurons (vertical orientation with apical processes; black arrows) in the innermost portion of the granule cell layer (GR) and type 2b/3 DCX positive precursor cells (orientation parallel to the GR; red asterisks) in the subgranular zone (SGZ). The dotted box indicates the region shown at a higher magnification on the right. Scale bars = 60 μm (lower magnification images) and 15 μm (higher magnification image). C: Number of DCX positive cells in the DG of homozygous (−/−; n = 5), heterozygous (+/−; n = 4) and wild type (+/+; n = 4) Cdkl5 KO female mice and hemizygous (−/Y; n = 4) and wild type (+/Y; n = 4) Cdkl5 KO male mice. Type 2b/3 (2b/3) cells and immature neurons (IN) were counted separately. Data are expressed as number of cells/mm2. D: Examples of cleaved caspase-3 positive cells (d1, black arrow) and DCX positive cells (d2, white asterisks) detected in ultra thin adjacent sections processed for immunostaining for cleaved caspase-3 or DCX, from the DG of a wild type (+/+) female mouse. Computer-based image overlay of two adjacent ultra thin sections immunostained for either cleaved caspase-3 or DCX allowed us to identify the same cells. The red asterisks in d1 indicate cells corresponding to the DCX positive cells, identified in the section in d2. Likewise, the red arrow in d2 indicates the cleaved caspase positive cell identified in d1. Scale bars = 15 μm. E: Number of cleaved caspase-3/DCX positive cells, identified as shown in D, in the DG of homozygous (−/−; n = 4), heterozygous (+/−; n = 3) and wild type (+/+; n = 3) Cdkl5 KO female mice and hemizygous (−/Y; n = 4) and wild type (+/Y; n = 3) Cdkl5 KO male mice. Type 2b/3 cells (2b/3) and immature neurons (IN) were counted separately. Data are expressed as percentages in comparison with wild type mice. Values in C and E are mean ± SD. *p < 0.05; **p < 0.01 (Bonferroni's test after ANOVA).
Fig. 5
Fig. 5
Stereology of the dentate gyrus of Cdkl5 KO mice. A: Examples of Hoechst-stained sections from the dentate gyrus of wild type (+/+) and homozygous (−/−) Cdkl5 KO female mice. The white arrowheads indicate pyknotic cells. Scale bar = 80 μm (lower magnification) and 20 μm (higher magnification). B–D: Volume of the granule cell layer (B), density of granule cells (C) and total number of granule cells (D) in homozygous (−/−; n = 6), heterozygous (+/−; n = 6) and wild type (+/+; n = 6) Cdkl5 KO female mice and hemizygous (−/Y; n = 6) and wild type (+/Y; n = 6) Cdkl5 KO male mice aged 45 days. Values (mean ± SD) refer to one dentate gyrus. **p < 0.01; ***p < 0.001 (Bonferroni's test after ANOVA). Abbreviations: GR, granule cell layer; H, hilus.
Fig. 6
Fig. 6
Dendritic architecture of newborn granule cells of Cdkl5 KO mice. A–B: Mean total dendritic length (A) and mean number of dendritic segments (B) in homozygous (−/−; n = 5), heterozygous (+/−; n = 4) and wild type (+/+; n = 4) Cdkl5 KO female mice (panels on the left) and hemizygous (−/Y; n = 4) and wild type (+/Y; n = 4) Cdkl5 KO male mice (panels on the right). C–D: Quantification of the mean length (C) and mean number (D) of branches of the different orders in the same animals as in A. The arrows indicate the absence of branches in Cdkl5 KO mice. E: Images of sections processed for synaptophysin (SYN) immunofluorescence from the dentate gyrus of homozygous (−/−) and wild type (+/+) Cdkl5 KO female mice. Scale bar = 50 μm. G: Optical density of SYN immunoreactivity in the outer (O), middle (M) and inner (I) third of the molecular layer of the same animals as in A. Data are given as fold difference compared to the corresponding zone of the molecular layer of wild type mice. Values in A–D and F represent mean ± SD. *p < 0.05; **p < 0.01; ***p < 0.001 (Bonferroni's test after ANOVA).
Fig. 7
Fig. 7
AKT/GSK-3β pathway in the dentate gyrus of Cdkl5 KO mice. A: Diagram of the AKT/GSK-3β signaling cascade. The proteins indicated in red showed significantly altered phosphorylation or expression levels whereas the protein labeled in blue did not show a significant alteration in Cdkl5 KO in comparison with wild type mice. Lithium, an inhibitor of GSK-3β, is colored green. B–C: Western blot analysis of P-PDK1, P-AKT (Ser437, Thr308), P-ERK, P-GSK-3β, P-GSK-3β (Ser9), P-CREB (Ser133), P-CRMP2 (Thr514) and β-catenin levels in hippocampal homogenates of homozygous (−/−; n = 5), heterozygous (+/−; n = 5) and wild type (+/+; n = 6) Cdkl5 KO female mice and hemizygous (−/Y; n = 5) and wild type (+/Y; n = 6) Cdkl5 KO male mice. Western immunoblots in B are examples from animals of each experimental group. Histograms in C show P-AKT, P-ERK, P-GSK-3β, P-CREB and P-CRMP2 protein levels, normalized to corresponding total protein levels, and P-PDK1 and β-catenin levels, normalized to GAPDH. Data are expressed as fold difference in comparison with wild type mice. Values represent mean ± SD. *p < 0.05; **p < 0.01; ***p < 0.001 (Bonferroni's test after ANOVA).
Fig. 8
Fig. 8
Proliferation, apoptotic cell death and differentiation of cultured NPCs from the subventricular zone of Cdkl5 KO mice. A: Examples of NPCs, grown as neurospheres, from wild type (+/+) and Cdkl5 KO (−/−) mice showing BrdU-positive cells (red). Cell nuclei were stained using Hoechst dye (blue). BrdU (10 μM) was added for 16 h and thereafter cells were processed for BrdU immunohistochemistry. Scale bar = 40 μm. B: Number of BrdU-positive cells (left histogram) and cleaved caspase-3 positive cells (right histogram) over total cell number in wild type (+/+) and Cdkl5 KO (−/−) neurospheres and in Cdkl5 KO (−/−) neurospheres infected with CDKL5 adenovirus particles (MOI: 100). Example of a Western blot showing Cdkl5 expression in wild type (+/+), Cdkl5 KO (−/−) neurospheres and Cdkl5 KO (−/−) neurospheres infected with CDKL5 adenovirus particles are shown on the right. C: Images of cleaved caspase-3 positive cells in wild type (+/+) and Cdkl5 KO (−/−) NPCs after 1 day in differentiating culture conditions. Scale bar = 25 μm. Quantification of the number of cleaved caspase-3 positive cells in wild type (+/+) and Cdkl5 KO (−/−) NPCs and in Cdkl5 KO (−/−) NPCs infected with CDKL5 adenovirus particles (MOI: 100) or treated with lithium (Li; 2 mM). D: Phenotype and neuritic length of 6-days-differentiated wild type (+/+) and Cdkl5 KO (−/−) NPCs and Cdkl5 KO (−/−) NPCs infected with CDKL5 adenovirus particles (MOI: 100) or treated with lithium (2 mM). Double-fluorescence images of differentiated NPCs are reported for each experimental condition. Cells with a neuronal phenotype are immunopositive for β-tubulin III (red) and cells with an astrocytic phenotype are immunopositive for GFAP (green). Cell nuclei were stained using Hoechst dye (blue). Scale bar = 40 μm. The stacked column chart on the left represents the percentage of β-tubulin III positive cells, GFAP positive cells and cells with an undetermined phenotype (Other) over total cell number. The histogram on the right shows the quantification of neurite length. The symbol * indicates a significant difference in comparison with wild type cultures (***p < 0.001) and the symbol # indicates a significant difference in comparison with untreated Cdkl5 KO (#p < 0.05, ##p < 0.01); Bonferroni's test after ANOVA. E: Western blot quantification of P-AKT (Ser437) and P-GSK-3β (Ser9) levels, normalized to corresponding total protein levels, in 6 day-differentiated wild type (+/+) and Cdkl5 KO (−/−) NPCs and Cdkl5 KO (−/−) NPCs infected with CDKL5 adenovirus particles (MOI: 100) or treated with lithium (2 mM). Data in B, C and E are expressed as a percentage of wild type cultures. Values in B–E represent mean ± SE. *p < 0.05; **p < 0.01; ***p < 0.001 (Bonferroni's test after ANOVA).
Fig. 9
Fig. 9
Working memory test in Cdkl5 KO mice. A: Homozygous (−/−; n = 17), heterozygous (+/−; n = 11) and wild type (+/+; n = 5) Cdkl5 KO female mice and hemizygous (−/Y; n = 28) and wild type (+/Y; n = 6) Cdkl5 KO male mice were tested in a single trial Y maze task, to measure arm alternation. The percentage of spontaneous alternations is defined as (total alternations/total arm entries − 2) × 100. B: Motor activity during testing is shown as the distance traveled during the task. All data are presented as mean ± SEM. *p < 0.05; **p < 0.01; ***p < 0.001 (Dunnett's test after ANOVA).
Fig. 10
Fig. 10
Hypothetical model of CDKL5 function in postnatal hippocampus development. Top: In the normal dentate gyrus, primary progenitor cells (type 1) and intermediate progenitor cells (type 2a/b and type 3 cells) continue to proliferate, maintaining the normal progenitor pool. Postmitotic immature neurons differentiate into mature granule cells. Some of the immature neurons are committed to die. Bottom: A loss of Cdkl5 increases the proliferation rate of type 1, type 2a/b and type 3 cells but causes an increase in cell death of immature neurons, with a reduction in the final number of mature granule cells. Moreover immature neurons exhibit a hypotrophic dendritic tree.

References

    1. Aimone J.B., Deng W., Gage F.H. Adult neurogenesis: integrating theories and separating functions. Trends Cogn. Sci. 2010;14:325–337. - PMC - PubMed
    1. Amendola E., Zhan Y., Mattucci C., Castroflorio E., Calcagno E., Fuchs C., Lonetti G., Silingardi D., Farley D., Ciani E., Pizzorusso T., Giustetto M., Gross C.T. Mapping pathological phenotypes in a mouse model of CDKL5 disorder. PLoS One. 2014;16(9(5)):e91613. - PMC - PubMed
    1. Armstrong D.D., Dunn J.K., Schultz R.J., Herbert D.A., Glaze D.G., Motil K.J. Organ growth in Rett syndrome: a postmortem examination analysis. Pediatr. Neurol. 1999;20:125–129. - PubMed
    1. Bahi-Buisson N., Kaminska A., Boddaert N., Rio M., Afenjar A., Gerard M., Giuliano F., Motte J., Heron D., Morel M.A., Plouin P., Richelme C., des Portes V., Dulac O., Philippe C., Chiron C., Nabbout R., Bienvenu T. The three stages of epilepsy in patients with CDKL5 mutations. Epilepsia. 2008;49:1027–1037. - PubMed
    1. Bahi-Buisson N., Nectoux J., Rosas-Vargas H., Milh M., Boddaert N., Girard B., Cances C., Ville D., Afenjar A., Rio M., Heron D., N'Guyen Morel M.A., Arzimanoglou A., Philippe C., Jonveaux P., Chelly J., Bienvenu T. Key clinical features to identify girls with CDKL5 mutations. Brain. 2008;131:2647–2661. - PubMed

Publication types

MeSH terms

Substances