. 2014 Jun 21:11:115.
doi: 10.1186/1742-2094-11-115.

Glimepiride reduces CD14 expression and cytokine secretion from macrophages

Affiliations

Glimepiride reduces CD14 expression and cytokine secretion from macrophages

Victoria Ingham et al. J Neuroinflammation. .

Abstract

Background: Activated microglia are associated with deposits of aggregated proteins within the brains of patients with Alzheimer's disease (AD), Parkinson's disease (PD) and prion diseases. Since the cytokines secreted from activated microglia are thought to contribute to the pathogenesis of these neurodegenerative diseases, compounds that suppress cytokine production have been identified as potential therapeutic targets. CD14 is a glycosylphosphatidylinositol (GPI)- anchored protein that is part of a receptor complex that mediates microglial responses to peptides that accumulate in prion disease (PrP82-146), AD (amyloid-β (Aβ)42) and PD (α-synuclein (αSN)). As some GPI-anchored proteins are released from cells by treatment with glimepiride, a sulphonylurea used for the treatment of diabetes, the effects of glimepiride upon CD14 expression and cytokine production from cultured macrophages were studied.

Methods: RAW 264 cells and microglial cells were treated with glimepiride or phosphatidylinositol (PI)-phospholipase C (PLC) and the expression of cell receptors was analysed by ELISA and immunoblot. Treated cells were subsequently incubated with Aβ42, αSN, PrP82-146 or lipopolysaccharide (LPS) and the amounts of Toll-like receptor (TLR)-4, tumour necrosis factor (TNF), interleukin (IL)-1 and IL-6 measured.

Results: Glimepiride released CD14 from RAW 264 cells and microglial cells. Pre-treatment with glimepiride significantly reduced TNF, IL-1 and IL-6 secretion from RAW 264 and microglial cells incubated with LPS, Aβ42, αSN and PrP82-146. Glimepiride also reduced the LPS, Aβ42, αSN and PrP82-146-induced translocation of TLR-4 into membrane rafts that is associated with cell activation. These effects of glimepiride were also seen after digestion of RAW 264 cells with PI-phospholipase C (PLC). In addition, the effects of glimepiride were blocked by pharmacological inhibition of GPI-PLC. The cytokine production was CD14-dependent; it was reduced in microglia from CD14 knockout mice and was blocked by antiserum to CD14.

Conclusions: RAW 264 and microglial cell responses to Aβ1-42, αSN, PrP82-146 and LPS are dependent upon CD14 expression. Glimepiride induced the shedding of CD14 from cells by activation of GPI-PLC and consequently reduced cytokine production in response to Aβ42, αSN, PrP82-146 and LPS. These results suggest that glimepiride acts as a novel anti-inflammatory agent that could modify the progression of neurodegenerative diseases.


Figures
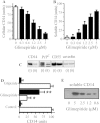
Figure 1
Figure 1
Glimepiride releases CD14 from RAW 264 cells. (A) The amounts of CD14 in RAW 264 cells treated for one hour with control medium (□) or glimepiride (■) as shown. Values are means ± SD, from triplicate experiments performed 4 times, n = 12. (B) The amounts of CD14 in supernatants from RAW 264 cells treated for one hour with control medium (□) or glimepiride as shown (■). Values are means ± SD, from triplicate experiments performed 4 times, n = 12. (C) Immunoblots showing the amounts of CD14, PrPC, CD55 and caveolin in extracts from RAW 264 cells treated for 1 hour with control medium (i) or 5 μM glimepiride (ii). (D) The amounts of CD14 in cells (□) or supernatants (■) from microglial cells treated for 1 hour with control medium, 5 μM glimepiride or 5 μM glipizide. Values are mean units CD14 ± SD, from triplicate experiments performed 3 times, n = 9. *Cellular CD14 significantly less than control cells. **supernatant CD14 significantly greater than control supernatants. (E) Blot showing the amounts of CD14 in supernatants from microglial cells treated with concentrations of glimepiride as shown for one hour.
Figure 2
Figure 2
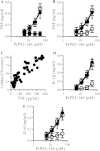
Glimepiride reduces cytokine secretion from RAW 264 cells incubated with PrP82-146. (A) The concentrations of TNF produced by RAW 264 cells incubated with PrP82-146 (●), PrP82-146scrambled (■) or PrP82-146 and 1 μg/ml polymyxin B (□). Values are means ± SD from triplicate experiments performed 4 times, n = 12. (B) The concentrations of TNF produced by RAW 264 cells pre-treated with control medium (●), 5 μM glimepiride (○) or 5 μM glipizide (□) and incubated with PrP82-146. Values are means ± SD from triplicate experiments performed 4 times, n = 12. (C) There was a significant correlation between the amounts of cellular CD14 of RAW 264 cells treated with glimepiride (0.3 to 5 μM) for 1 hour and TNF production after the addition of 50 μM PrP82-146, Pearson’s coefficient = 0.858, P < 0.01. (D) The concentrations of IL-1β produced by RAW 264 cells pre-treated with control medium (●), 5 μM glimepiride (○) or 5 μM glipizide (□) and incubated with PrP82-146. Values are means ± SD from triplicate experiments performed 4 times, n = 12. (E) The concentrations of IL-6 produced by RAW 264 cells pre-treated with control medium (●), 5 μM glimepiride (○) or 5 μM glipizide (□) and incubated with PrP82-146. Values are means ± SD from triplicate experiments performed 4 times, n = 12.
Figure 3
Figure 3
Glimepiride reduces cytokine secretion from RAW 264 cells incubated with Aβ. (A) The concentrations of TNF produced by RAW 264 cells incubated with Aβ1–42 (●), Aβ42–1 (■) or Aβ1–42 and 1 μg/ml polymyxin B (□). Values are means ± SD from triplicate experiments performed 4 times, n = 12. (B) The concentrations of TNF produced by RAW 264 cells pre-treated with control medium (●) 5 μM glimepiride (○) or 5 μM glipizide (□) and incubated with Aβ1–42. Values are means ± SD from triplicate experiments performed 4 times, n = 12. (C) The concentrations of IL-1β produced by RAW 264 cells pre-treated with control medium (●) 5 μM glimepiride (○) or 5 μM glipizide (□) and incubated with Aβ1–42. Values are means ± SD from triplicate experiments performed 4 times, n = 12. (D) The concentrations of IL-6 produced by RAW 264 cells pre-treated with control medium (●), 5 μM glimepiride (○) or 5 μM glipizide (□) and incubated with Aβ1–42. Values are means ± SD from triplicate experiments performed 4 times, n = 12.
Figure 4
Figure 4
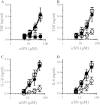
Glimepiride reduces cytokine secretion from RAW 264 cells incubated with αSN. (A) The concentrations of TNF produced by RAW 264 cells incubated with αSN (●), βSN (■) or αSN and 1 μg/ml polymyxin B (□). Values are means ± SD from triplicate experiments performed 4 times, n = 12. (B) The concentrations of TNF produced by RAW 264 cells pre-treated with control medium (●), 5 μM glimepiride (○) or 5 μM glipizide (□) and incubated with αSN. Values are means ± SD from triplicate experiments performed 4 times, n = 12. (C) The concentrations of IL-1β produced by RAW 264 cells pre-treated with control medium (●) or 5 μM glimepiride (○) or 5 μM glipizide (□) and incubated with αSN. Values are means ± SD from triplicate experiments performed 4 times, n = 12. (D) The concentrations of IL-6 produced by RAW 264 cells pre-treated with control medium (●), 5 μM glimepiride (○) or 5 μM glipizide (□) and incubated with αSN. Values are means ± SD from triplicate experiments performed 4 times, n = 12.
Figure 5
Figure 5
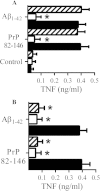
Glimepiride reduces cytokine secretion from microglial cells incubated with PrP82-146 or Aβ1–42. (A) The concentrations of TNF produced by microglial cells pre-treated for 1 hour with control medium (■), 5 μM glimepiride (□) or 5 μM glipizide (striped bars) and incubated with control medium, 50 μM PrP82-146 or 50 μM Aβ1–42 as shown. Values are means ± SD from triplicate experiments performed 3 times, n = 9. *TNF significantly less than control cells incubated with peptides. (B) The concentrations of TNF produced by microglial cells pre-treated with control medium (●) or 5 μM glimepiride for 1 hour (□), or pre-treated with 5 μM glimepirde for 1 hour and washed 3 times with PBS (striped bars) and incubated with 50 μM PrP82-146 or 50 μM Aβ1–42 as shown. Values are means ± SD from triplicate experiments performed 3 times, n = 9. *TNF significantly less than control cells incubated with peptides.
Figure 6
Figure 6
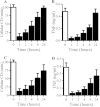
RAW264 and microglial cells recover from glimepiride-induced suppression of cytokine production. (A) The amounts of CD14 in RAW 264 cells treated with control medium (□) or 5 μM glimepiride for time periods as shown (■). Values are means ± SD from triplicate experiments performed twice, n = 6. (B) The concentrations of TNF produced by RAW 264 cells pre-treated with control medium (□) or 5 μM glimepiride for time periods as shown (■) and incubated with 50 μM PrP82-146 for 24 hours. Values are means ± SD from triplicate experiments performed twice, n = 6. (C) The amounts of CD14 in microglial cells treated with control medium (□) or 5 μM glimepiride for time periods as shown (■). Values are means ± SD from triplicate experiments performed twice, n = 6. (D) The concentrations of TNF produced by microglial cells pre-treated with control medium (□) or 5 μM glimepiride for time periods as shown (■) and incubated with 50 μM PrP82-146 for 24 hours. Values are means ± SD from triplicate experiments performed twice, n = 6.
Figure 7
Figure 7
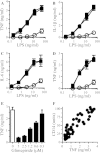
Glimepiride reduces lipopolysaccharide (LPS)-induced cytokine secretion. (A) The concentrations of TNF produced by RAW 264 cells pre-treated with control medium (●), 5 μM glimepiride (○) or 5 μM glipizide (■) and incubated with LPS. Values are means ± SD from triplicate experiments performed 4 times, n = 12. (B) The concentrations of IL-1β produced by RAW 264 cells pre-treated with control medium (●), 5 μM glimepiride (○) or 5 μM glipizide (■) and incubated with LPS. Values are means ± SD from triplicate experiments performed 4 times, n = 12. (C) The concentrations of IL-6 produced by RAW 264 cells pre-treated with control medium (●), 5 μM glimepiride (○) or 5 μM glipizide (■) and incubated with LPS. Values are means ± SD from triplicate experiments performed 4 times, n = 12. (D) The concentrations of TNF produced by microglial cells pre-treated with control medium (●), 5 μM glimepiride (○) or 5 μM glipizide (■) and incubated with LPS. Values are means ± SD from triplicate experiments performed 4 times, n = 12. (E) The concentrations of TNF produced by RAW 264 cells pre-treated with control medium (□) or glimepiride as shown (■) and incubated with 10 ng/ml LPS. Values are means ± SD from triplicate experiments performed 3 times, n = 9. (F) There was a significant correlation between the CD14 content of RAW 264 cells treated with glimepiride (0.3 to 5 μM) and the concentrations of TNF produced in response to 10 ng/ml LPS, Pearson’s coefficient = 0.886.
Figure 8
Figure 8
PI-PLC digestion reduced cytokine secretion from RAW 264 cells. (A) The concentrations of TNF produced by RAW 264 cells pre-treated with control medium (□) or PI-PLC (■) and incubated with 50 μM PrP82-146, Aβ1–42 or αSN. Values are means ± SD from triplicate experiments performed 4 times, n = 12. *TNF significantly less than control cells incubated with peptides. (B) The concentrations of IL-1β produced by RAW 264 cells pre-treated with control medium (□) or PI-PLC (■) and incubated with 50 μM PrP82-146, Aβ1–42 or αSN. Values are means ± SD from duplicate experiments performed 4 times, n = 8. *IL-1β significantly less than control cells incubated with peptides. (C) The concentrations of IL-6 produced by RAW 264 cells pre-treated with control medium (□) or PI-PLC (■) and incubated with 50 μM PrP82-146, Aβ1–42 or αSN. Values are means ± SD from duplicate experiments performed 4 times, n = 8. *IL-6 significantly less than control cells incubated with peptides. *IL-6 significantly less than control cells incubated with peptides.
Figure 9
Figure 9
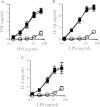
RAW 264 cells digested with PI-PLC are hyporesponsive to lipopolysaccharide (LPS). (A) The concentrations of TNF produced by RAW 264 cells pre-treated with control medium (●), PI-PLC (○) or heat-inactivated PI-PLC (■) and incubated with LPS. Values are means ± SD from triplicate experiments performed 4 times, n = 12. (B) The concentrations of IL-1β produced by RAW 264 cells pre-treated with control medium (●), PI-PLC (○) or heat-inactivated PI-PLC (■) and incubated with LPS. Values are means ± SD from triplicate experiments performed 4 times, n = 12. (C) The concentrations of IL-6 produced by RAW 264 cells pre-treated with control medium (●), PI-PLC (○) or heat-inactivated PI-PLC (■) and incubated with LPS. Values are means ± SD from triplicate experiments performed 4 times, n = 12.
Figure 10
Figure 10
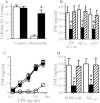
Glimepiride induced immunosuppression is reversed by pCMPS. (A) The amounts of CD14 in RAW 264 cells treated for 1 hour with control medium or 5 μM glimepiride in the presence of control medium (□) or 200 μM pCMPS (■). Values are means ± SD from triplicate experiments performed 4 times, n = 12. *CD14 significantly greater than those of cells treated with glimepiride. (B) The concentrations of TNF produced by RAW 264 cells pre-treated with control medium (□), 5 μM glimepiride (■), or 5 μM glimepiride and 200 μM pCMPS (striped bars) and incubated with 50 μM PrP82-146, 50 μM Aβ1–42 or 50 μM αSN. Values are means ± SD from triplicate experiments performed 4 times, n = 12. *TNF significantly less than control cells incubated with peptides. (C) The concentrations of TNF produced by RAW 264 cells pre-treated with control medium (●), 5 μM glimepiride (○) or 5 μM glimepiride and 200 μM pCMPS () and incubated with LPS as shown. Values are means ± SD from triplicate experiments performed 4 times, n = 12. (D) The concentrations of TNF produced by microglial cells pre-treated with control medium (□), 5 μM glimepiride (■), or 5 μM glimepiride and 200 μM pCMPS (striped bars) and incubated with 50 μM PrP82-146 or 50 μM Aβ1–42. Values are means ± SD from triplicate experiments performed twice, n = 6. *TNF significantly less than control cells incubated with peptides.
Figure 11
Figure 11
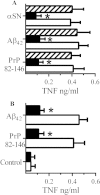
CD14 mediates cytokine secretion from peptide stimulated RAW 264 cells. (A) The concentrations of TNF produced by RAW 264 cells pre-treated with antiserum to CD14 (■), PrPC (□) or CD55 (striped bars) and incubated with 50 μM PrP82-146, Aβ1–42 or αSN. Values are means ± SD from triplicate experiments performed 3 times, n = 9. *TNF significantly less than those of control cells incubated with peptides. (B) The concentrations of TNF produced by microglial cells derived from CD14 wild type (□) or CD14 knockout (■) mice incubated with PrP82-146 or Aβ1–42. Values are means ± SD from triplicate experiments performed 3 times, n = 9. *TNF significantly less than those from CD14 wild type cells incubated with peptides.
Figure 12
Figure 12
PrP82-146 causes the translocation of Toll-like receptor (TLR)-4 into rafts. (A) The % of TLR-4 in DRMs derived from RAW 264 cells treated with PrP82-146 (●) or PrP82-146scrambled (○). Values are means ± SD from triplicate experiments performed 3 times, n = 9. (B) The % TLR-4 in DRMs derived from RAW 264 cells treated with control medium (□) or 50 μM Aβ1–42, Aβ42–1, αSN or βSN as shown (■). Values are means ± SD from triplicate experiments performed 3 times, n = 9. *TLR-4 significantly greater than those of control cells. (C) RAW 264 cells were incubated with PrP82-146 (○), Aβ1–42 (●) or αSN (□) (6 to 50 μM). There were significant correlations between % TLR-4 in rafts and TNF for PrP82-146, Pearson’s coefficient = 0.88, Aβ1–42, Pearson’s coefficient = 0.78 and αSN Pearson’s coefficient = 0.86. (D) There was a significant correlation between the % TLR-4 in rafts of RAW 264 cells incubated with lipopolysaccharide (LPS) (0.75 to 50 ng/ml) and TNF produced, Pearson’s coefficient = 0.887.
Figure 13
Figure 13
Glimepiride reduces the translocation of Toll-like receptor (TLR)-4 to rafts. (A) The % TLR-4 in rafts of RAW 264 cells pre-treated with control medium, 5 μM glimepiride or 5 μM glipizide and incubated with control medium (□) or 50 μM PrP82-146 (■). Values are means ± SD from triplicate experiments performed 4 times, n = 12. *TLR-4 significantly less than those of control cells incubated with PrP82-146. (B) The % TLR-4 in rafts of RAW 264 cells pre-treated with control medium, 5 μM glimepiride or 5 μM glipizide and incubated with control medium (□) or 50 μM Aβ1–42 (■). Values are means ± SD from triplicate experiments performed 4 times, n = 12. *TLR-4 significantly less than those of control cells incubated with Aβ1–42. (C) The % TLR-4 in rafts of RAW 264 cells pre-treated with control medium, 5 μM glimepiride or 5 μM glipizide and incubated with control medium (□) or 50 μM αSN (■). Values are means ± SD from triplicate experiments performed 4 times, n = 12. *TLR-4 significantly less than those of control cells incubated with αSN. (D) The % TLR-4 in rafts of RAW 264 cells pre-treated with control medium, 5 μM glimepiride or 5 μM glipizide as shown and incubated with control medium (□) or 10 ng/ml LPS (■). Values are means ± SD from triplicate experiments performed 4 times, n = 12. *TLR-4 significantly less than those of control cells incubated with lipopolysaccharide (LPS).

Similar articles

Cited by

References

    1. Schlachetzki JC, Hull M. Microglial activation in Alzheimer’s disease. Curr Alzheimer Res. 2009;6(6):554–563. - PubMed
    1. Stalder M, Phinney A, Probst A, Sommer B, Staufenbiel M, Jucker M. Association of microglia with amyloid plaques in brains of APP23 transgenic mice. Am J Pathol. 1999;154(6):1673–1684. - PMC - PubMed
    1. Zhang W, Wang T, Pei Z, Miller DS, Wu X, Block ML, Wilson B, Zhang W, Zhou Y, Hong J-S, Zhang J. Aggregated α-synuclein activates microglia: a process leading to disease progression in Parkinson’s disease. FASEB J. 2005;19(6):533–542. - PubMed
    1. Combs CK, Karlo JC, Kao SC, Landreth GE. β-Amyloid stimulation of microglia and monocytes results in TNFalpha-dependent expression of inducible nitric oxide synthase and neuronal apoptosis. J Neurosci. 2001;21(4):1179–1188. - PMC - PubMed
    1. Klegeris A, Walker DG, McGeer PL. Interaction of Alzheimer beta-amyloid peptide with the human monocytic cell line THP-1 results in a protein kinase C-dependent secretion of tumor necrosis factor-alpha. Brain Res. 1997;747(1):114–121. - PubMed

Publication types

MeSH terms