. 2014 Jun 21:7:45.
doi: 10.1186/1756-8722-7-45.

The Src homology-2 protein Shb modulates focal adhesion kinase signaling in a BCR-ABL myeloproliferative disorder causing accelerated progression of disease

Affiliations

The Src homology-2 protein Shb modulates focal adhesion kinase signaling in a BCR-ABL myeloproliferative disorder causing accelerated progression of disease

Karin Gustafsson et al. J Hematol Oncol. .

Abstract

Background: The Src homology-2 domain protein B (Shb) is an adapter protein operating downstream of several tyrosine kinase receptors and consequently Shb regulates various cellular responses. Absence of Shb was recently shown to reduce hematopoietic stem cell proliferation through activation of focal adhesion kinase (FAK) and thus we sought to investigate Shb's role in the progression of leukemia.

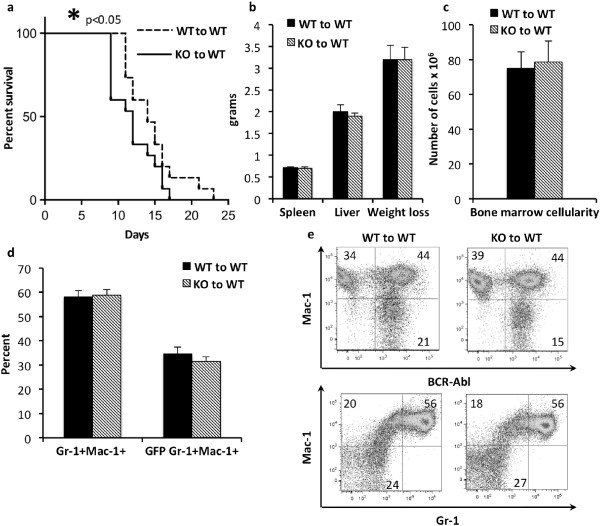
Methods: Wild type and Shb knockout bone marrow cells were transformed with a retroviral BCR-ABL construct and subsequently transplanted to wild type or Shb knockout recipients. Disease latency, bone marrow and peripheral blood cell characteristics, cytokine expression, signaling characteristics and colony formation were determined by flow cytometry, qPCR, western blotting and methylcellulose colony forming assays.

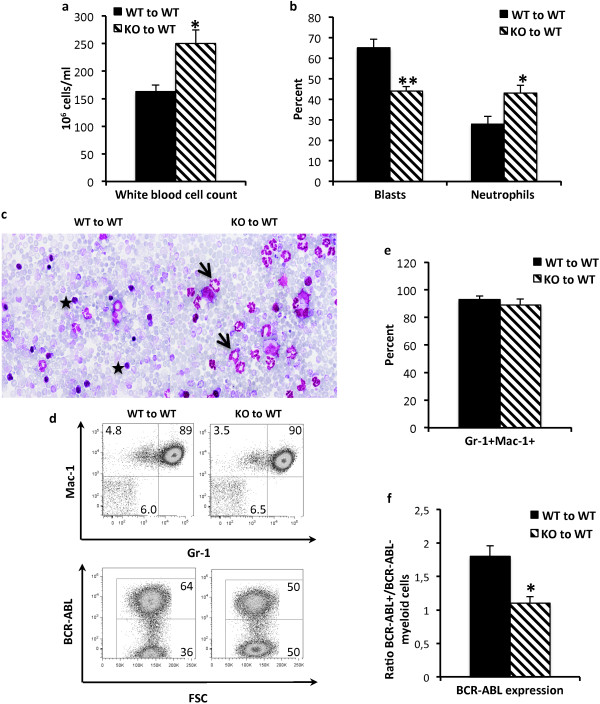
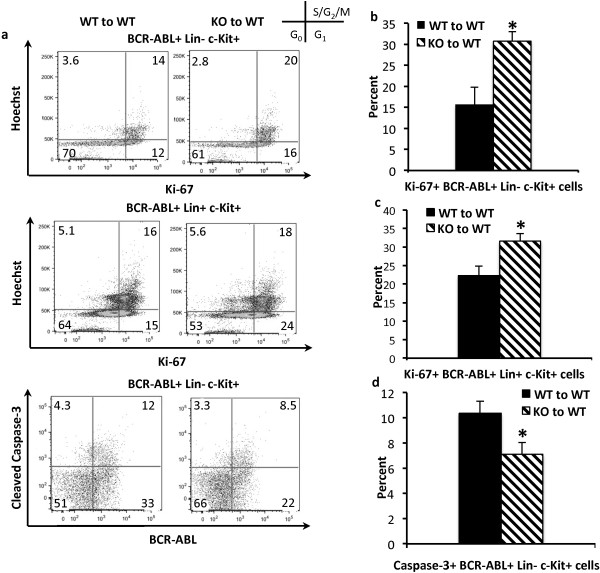
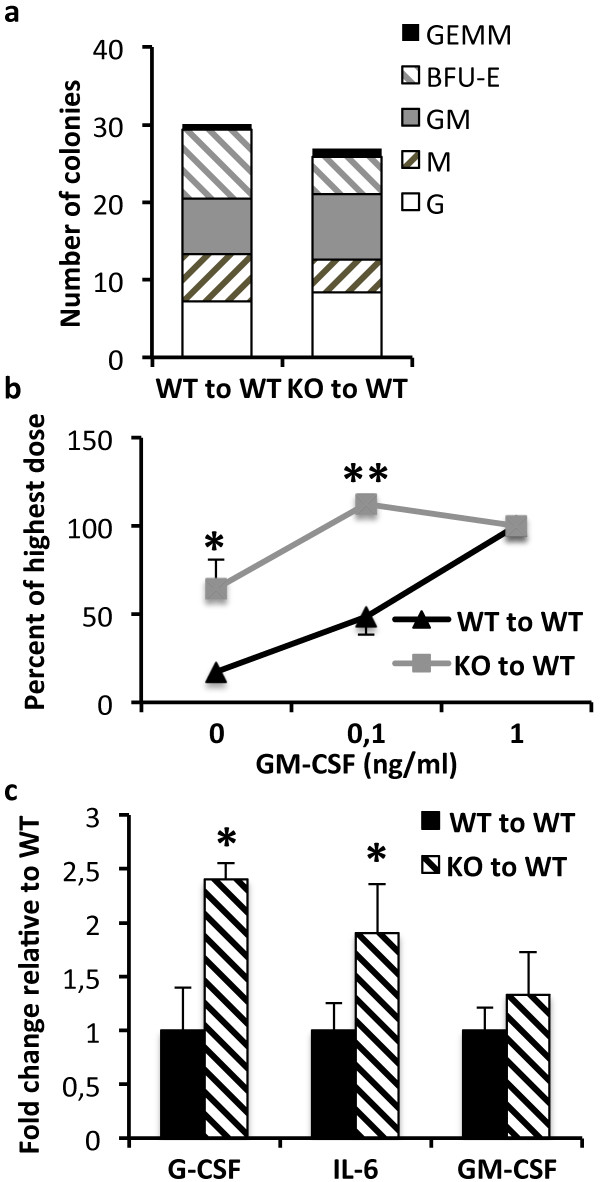
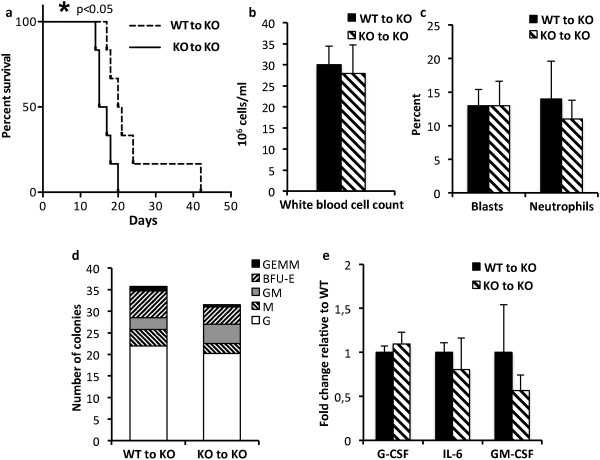
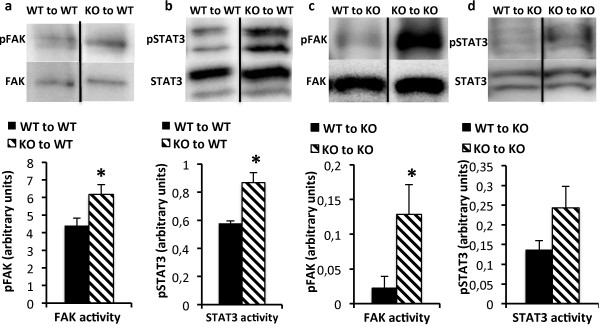
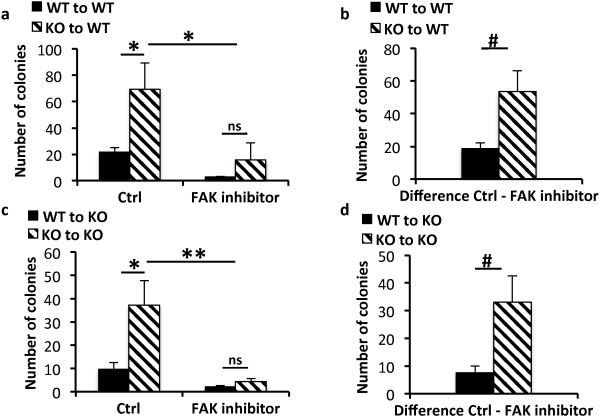
Results: It was observed that Shb knockout BCR-ABL-transformed bone marrow cells produced a disease with death occurring at earlier time points compared with corresponding wild type controls due to elevated proliferation of transformed bone marrow cells. Moreover, significantly elevated interleukin-6 and granulocyte colony-stimulation factor mRNA levels were observed in Shb knockout c-Kit + leukemic bone marrow cells providing a plausible explanation for the concurrent peripheral blood neutrophilia. Shb knockout leukemic bone marrow cells also showed increased ability to form colonies in methylcellulose devoid of cytokines that was dependent on the concomitantly observed increased activity of FAK. Transplanting BCR-ABL-transformed Shb knockout bone marrow cells to Shb knockout recipients revealed decreased disease latency without neutrophilia, thus implicating the importance of niche-derived cues for the increase of blood granulocytes.

Conclusions: Absence of Shb accelerates disease progression by exerting dual roles in BCR-ABL-induced leukemia: increased cell expansion due to elevated FAK activity and neutrophilia in peripheral blood, the latter dependent on the genetic background of the leukemic niche.


Figures

Figure 1
Figure 1
Effects of Shb deletion on disease progression in murine model of CML. (a) Kaplan-Meier curve demonstrating survival of mice receiving either wild type or Shb knockout BCR-ABL transformed bone marrow from 5-FU treated mice. (b) Analysis of various disease parameters including liver and spleen weight as well as weight loss at the end-stage of the disease. (c) Bone marrow cell numbers from the tibia, femur and the iliac bones were determined at the time of death. (d and e) Bone marrow cells were stained with fluorescently labeled antibodies directed against Gr-1 and Mac-1 and subsequently analyzed with FACS for GFP (BCR-ABL), Mac-1 and GR-1. Plots are representative of a typical experiment. Data are presented as mean ± SEM and based on 15 mice of each genotype from 5 independent experiments (retroviral transformation and transplantation occurring at 5 separate occasions). *denotes p < 0.05 as determined by Student’s t-test.
Figure 2
Figure 2
Evaluation of peripheral blood profile in leukemic wild type and Shb knockout mice. Peripheral blood smears were stained with May Grünwald-Giemsa; (a and c) the white blood cell count was established by differential counts and (b and c) the proportions of morphologically mature and immature cells were determined [stars point to blast cells and arrow to mature neutrophils]. (d and e) FACS analysis of Gr-1 and Mac-1 expression in peripheral blood. (d and f) The ratio of BCR-ABL+ and BCR-ABL- within the myeloid compartment was determined by evaluation of GFP+ expression using FACS analysis. The plots are representative of a typical experiment. The results are presented as mean values ± SEM from 9 mice of each genotype in 3 independent experiments. ** and * represents p < 0.01 and p < 0.05 respectively as determined by Student’s t-test.
Figure 3
Figure 3
Proliferation and apoptosis in BCR-ABL+hematopoietic progenitors assessed by flow cytometric analysis of Ki-67 and cleaved Caspase-3. (a, b and c) The cell cycle status in BCR-ABL+Lin-c-Kit+ and BCR-ABL+Lin+ bone marrow was examined by staining for proliferation marker Ki-67 in combination with the DNA binding dye Hoechst 33342. FACS plots are representative of an average experiment. (a and d) The staining for presence of cleaved Caspase-3 was used to determine the percentage of apoptotic cells within the BCR-ABL+Lin-c-Kit+ population. FACS plots are representative of a typical experiment. Data are presented as mean values ± SEM with 9 mice from each genotype from 3 independent experiments. *denotes p < 0.05 as determined by Student’s t-test.
Figure 4
Figure 4
Effects of Shb deficiency on hematopoietic colony formation ability and cytokine expression in BCR-ABL-transformed bone marrow. (a) Bone marrow cells were plated on M3434 semisolid medium containing cytokines supportive of myeloid and erythroid colony growth. The number and types of colonies were determined on day 10 of culture [Granulocyte Erythroid Monocyte Megakaryocyte (GEMM), Burst-forming Unit Erythroid (BFU-E), Granulocyte Monocyte (GM), Monocyte (M), Granulocyte (G)]. Data are means based on 3 mice of each genotype. (b) A gradient of 0, 0.1 and 1 ng/ml of GM-CSF was used to evaluate cytokine responsiveness in leukemic bone marrow cells. Results are presented as percentage of the highest GM-CSF dose. Means ± SEM are representative of 3 mice of each genotype. (c) The expression levels of various hematopoietic cytokines were determined by semi-quantitative real-time RT-PCR in samples isolated from c-Kit+ leukemic bone marrow. All Ct values were normalized to β-actin and Shb knockout samples were related to corresponding wild type values. Means are presented as 2-ΔCt ± SEM to demonstrate fold change in mRNA content. Data are based on 6 mice of each genotype from 2 independent experiments for c-Kit+ cells and 3 mice of each genotype from 1 experiment for unfractioned bone marrow. *denotes p < 0.05 respectively as determined by Student’s t-test.
Figure 5
Figure 5
Effects of Shb deletion on disease progression of BCR-ABL-transformed bone marrow cells transplanted to Shb knockout recipient mice. (a) Kaplan-Meier curve demonstrating survival of Shb knockout mice receiving either wild type or Shb knockout BCR-ABL-transformed bone marrow. (b) White blood cell counts in peripheral blood at the time of death. (c) Relative numbers of mature neutrophils and blasts in peripheral blood at the time of death. (d) Colony formation assay of c-Kit enriched bone marrow cells grown in cytokine-supplemented methylcellulose. (e) Cytokine mRNA levels in c-kit-enriched bone marrow cells.
Figure 6
Figure 6
Activity of FAK (a, c) and STAT3 (b, d) in c-Kit+bone marrow cells from leukemic mice. The phosphorylation status of FAK and STAT3 was determined by Western blot analysis. (a and b) show bone marrow cells from wild-type recipients, (c and d) show bone marrow cells from Shb knockout recipients. Activation was evaluated by immunoblotting for phospho- and total FAK and STAT3 respectively. Protein phosphorylation was related to total protein content on the same blot and signal strength was estimated by densitometric analysis. Means are presented in arbitrary units ± SEM and are based on 6 mice of each genotype in 2 independent experiments. * denotes p < 0.05 respectively as determined by Student’s t-test.
Figure 7
Figure 7
Effect of FAK inhibition on colony formation of wild-type and Shb knockout BCR-ABL-transformed bone marrow cells. c-Kit-enriched bone marrow cell (104) were plated in methylcellulose in the absence of cytokines in the absence or presence of 10 μM FAK inhibitor 14 and cultured for 5 days after which colony numbers were determined. (a) Colony formation of bone marrow cells isolated from wild-type recipients. (b) Inhibition of colony formation by inhibitor on bone marrow cells isolated from wild-type recipients. (c) Colony formation of bone marrow cells isolated from Shb knockout recipients. (d) Inhibition of colony formation by inhibitor on bone marrow cells isolated from Shb knockout recipients. The values in (b) and (d) were obtained by subtracting the inhibitor values from the corresponding control values. Means ± SEM for 6 dishes (three mice) each group are given. * and ** indicate p < 0.05 and 0.01, respectively with one way ANOVA (Bonferroni). # indicates p < 0.05 when compared with wild-type using a Students’ t-test. Ns = not statistically significant.

Similar articles

Cited by

References

    1. Renneville A, Roumier C, Biggio V, Nibourel O, Boissel N, Fenaux P, Preudhomme C. Cooperating gene mutations in acute myeloid leukemia: a review of the literature. Leukemia. 2008;22:915–931. doi: 10.1038/leu.2008.19. - DOI - PubMed
    1. Majeti R, Becker MW, Tian Q, Lee TL, Yan X, Liu R, Chiang JH, Hood L, Clarke MF, Weissman IL. Dysregulated gene expression networks in human acute myelogenous leukemia stem cells. Proc Natl Acad Sci U S A. 2009;106:3396–3401. doi: 10.1073/pnas.0900089106. - DOI - PMC - PubMed
    1. Cancer Genome Atlas Research N. Genomic and epigenomic landscapes of adult de novo acute myeloid leukemia. N Engl J Med. 2013;368:2059–2074. - PMC - PubMed
    1. Shtivelman E, Lifshitz B, Gale RP, Canaani E. Fused transcript of abl and bcr genes in chronic myelogenous leukaemia. Nature. 1985;315:550–554. doi: 10.1038/315550a0. - DOI - PubMed
    1. Thomas EK, Cancelas JA, Chae HD, Cox AD, Keller PJ, Perrotti D, Neviani P, Druker BJ, Setchell KD, Zheng Y, Harris CE, Williams DA. Rac guanosine triphosphatases represent integrating molecular therapeutic targets for BCR-ABL-induced myeloproliferative disease. Cancer Cell. 2007;12:467–478. doi: 10.1016/j.ccr.2007.10.015. - DOI - PubMed

Publication types

MeSH terms

Substances

LinkOut - more resources