. 2014 Jul;184(7):1940-56.
doi: 10.1016/j.ajpath.2014.03.016.

In vivo RNA interference models of inducible and reversible Sirt1 knockdown in kidney cells

Affiliations

In vivo RNA interference models of inducible and reversible Sirt1 knockdown in kidney cells

Peter Y Chuang et al. Am J Pathol. 2014 Jul.

Abstract

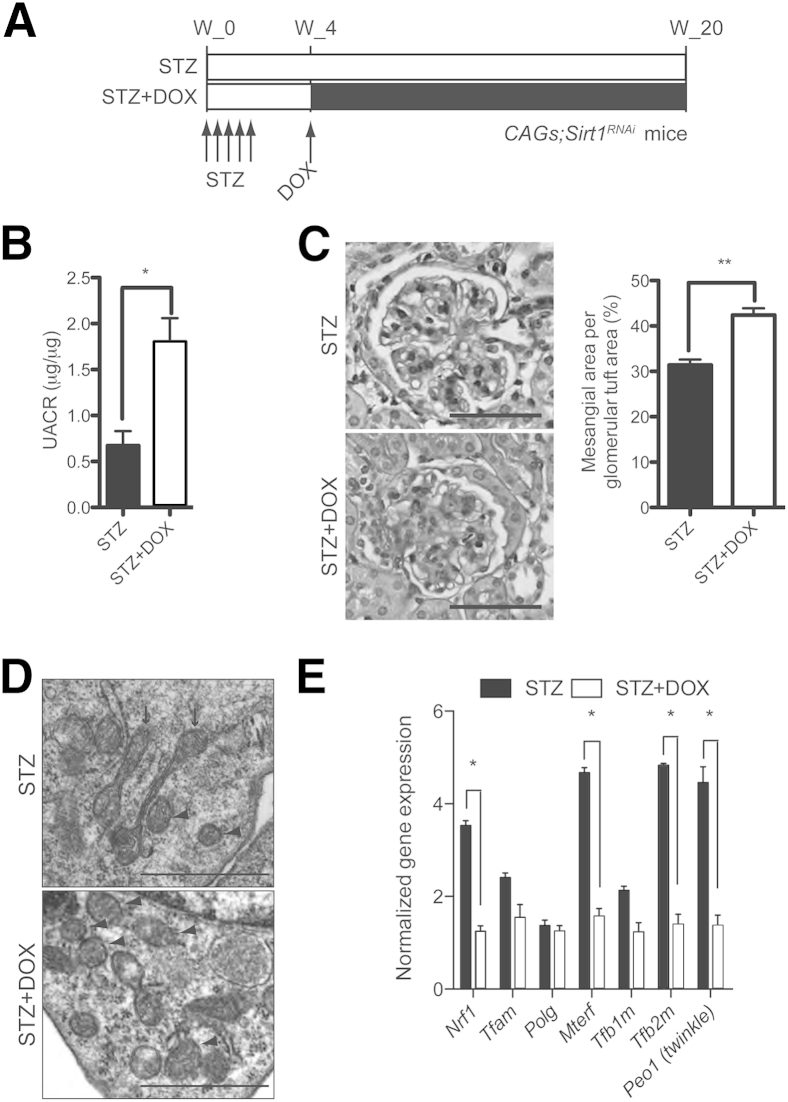
The silent mating type information regulation 2 homolog 1 gene (Sirt1) encodes an NAD-dependent deacetylase that modifies the activity of well-known transcriptional regulators affected in kidney diseases. Sirt1 is expressed in the kidney podocyte, but its function in the podocyte is not clear. Genetically engineered mice with inducible and reversible Sirt1 knockdown in widespread, podocyte-specific, or tubular-specific patterns were generated. We found that mice with 80% knockdown of renal Sirt1 expression have normal glomerular function under the basal condition. When challenged with doxorubicin (Adriamycin), these mice develop marked albuminuria, glomerulosclerosis, mitochondrial injury, and impaired autophagy of damaged mitochondria. Reversal of Sirt1 knockdown during the early phase of Adriamycin-induced nephropathy prevented the progression of glomerular injury and reduced the accumulation of dysmorphic mitochondria in podocytes but did not reverse the progression of albuminuria and glomerulosclerosis. Sirt1 knockdown mice with diabetes mellitus, which is known to cause mitochondrial dysfunction in the kidney, developed more albuminuria and mitochondrial dysfunction compared with diabetic mice without Sirt1 knockdown. In conclusion, these results demonstrate that our RNA interference-mediated Sirt1 knockdown models are valid and versatile tools for characterizing the function of Sirt1 in the kidney; Sirt1 plays a role in homeostatic maintenance of podocytes under the condition of mitochondrial stress/injury.


Figures

Figure 1
Figure 1
In vivo RNAi model with inducible Sirt1 knockdown. A: Double-transgenic CAGs. Sirt1RNAi mice harbor two transgenes: TGM and CAGs-rtTA. B: Representative Western blot analyses of Sirt1, GFP, and GAPDH on kidney protein lysates from two different lines of CAGs;Sirt1RNAi mice, with or without 5 days of DOX feeding, starting at 8 weeks of age. Each lane represents one mouse. C: Normalized Sirt1 band density from Western blot analyses in B. D: Immunostaining of WT-1 on kidney sections of CAGs;Sirt1RNAi mice, with and without DOX feeding. Dashed line in the lowest panel outlines WT-1–positive cells. Representative Western blot analyses of Sirt1 in PGECs isolated from CAGs-only control mice and CAGs;Sirt1RNAi mice. E: PGECs were cultured with and without 2 μg/mL DOX for 3 days. F: Normalized Sirt1 mRNA transcript levels of PGECs cultured with and without DOX. P < 0.05. Scale bar = 50 μm (D). CAGG, CMV-enhanced chicken β-actin promoter; Hygro, hygromycin resistance gene; I, interstitial cells; P, WT-1–positive podocytes; PGK, phosphoglycerate kinase 1 promoter; rtTA3, third-generation reverse tet-transactivator; SAdpA (stop), splicing acceptor donor polyA sequence; T, tubular cells; TRE, tetracycline-regulated element.
Figure 2
Figure 2
Renal gene expression, function, and histological features of mice with chronic Sirt1 knockdown. A: Representative Western blot analyses of Sirt1, GFP, and β-actin of age-matched CAGs;Sirt1RNAi mice with and without 11 weeks of DOX feeding. The arrow indicates the Western blot band corresponding to Sirt1. B: Glomerular expressions of Sirt1, markers of cellular senescence (ARF and p16INK4a), and podocyte-specific genes (Nphs1, Synpo, CD2AP, WT-1, Neph1, and Neph2) in mice with and without 11 weeks of DOX feeding. N = 4 mice per group. Black bars, DOX; white bars, no DOX. C: UACR of CAGs;Sirt1RNAi mice before and after 11 weeks of DOX feeding. Serum urea nitrogen (D) and serum creatinine (E) of CAGs;Sirt1RNAi mice after 11 weeks of DOX compared with those not fed with DOX. N = 4 to 5 mice per group. F: Staining for β-galactosidase activity assessed at a pH of 6.0 (known as senescence-associated β-galactosidase activity) on frozen kidney sections of CAGs;Sirt1RNAi mice with and without 11 weeks of DOX feeding. Staining of a section of mice with ADR nephropathy (ADR-N) served as a positive control. Arrowheads indicate tubular cells with positive staining. GL: Representative images of kidney glomeruli, podocyte, podocyte foot processes, mesangial cell, glomerular endothelium, and tubular cell of CAGs;Sirt1RNAi mice after 11 weeks of DOX feeding. P < 0.05. Scale bars: 50 μm (F and G); 2 μm (HL). Pos., positive.
Figure 3
Figure 3
Genetically engineered mice with inducible and conditional Sirt1 knockdown in podocytes and tubular cells. A: A scheme depicting two lines of double-transgenic mice with inducible Sirt1 knockdown in podocytes (POD;Sirt1RNAi) or tubular cells (TUB;Sirt1RNAi). Podocyte-specific knockdown was driven by a 2.5-kb NPHS2 promoter, and tubular-specific knockdown was driven by a 5.6-kb Pax8 promoter. B: A representative fluorescein isothiocyanate (FITC) fluorescence image overlapped with a phase-contrast image of glomeruli (arrowheads) isolated from POD;Sirt1RNAi mice. Highly arborized PGECs emanating from glomeruli are marked with arrows. The asterisk indicates GFP-negative PGECs outgrown from the glomeruli. C: Normalized Sirt1 expression of GFP-positive podocytes isolated by fluorescence-activated cell sorting from POD;Sirt1RNAi mice and control POD;LucRNAi mice (N = 4 mice in each group). D: Normalized Sirt1 mRNA expression in renal cortex of TUB;Sirt1RNAi mice with and without DOX feeding for 5 days. N = 3 mice per group. P < 0.05.
Figure 4
Figure 4
Glomerular function and structure of CAGs;Sirt1RNAi mice with ADR-induced nephropathy. A: A scheme of study design to determine the susceptibility of CAGs;Sirt1RNAi mice to ADR. B: A Coomasie Blue–stained gel with urinary proteins and albumin standards resolved by SDS-PAGE. (Albumin standards: 0.05, 0.1, 0.5, 1.0, and 5.0 μg per lane). C: A graph of UACR on D0 and D10 after ADR or normal saline (NS) injection. N = 5 in the ADR-only group, N = 6 in the ADR + DOX group, N = 3 in the NS-only group, and N = 3 in the NS + DOX group. D: Representative images of PAS-stained kidney sections. Dilated tubules filled with protein casts are present in the ADR + DOX group. E: Representative TEM images of podocytes (P). Red arrows indicate areas of foot process effacement. F: A bar graph representing podocyte FP width. P < 0.05, ∗∗∗P < 0.001. Std, standard.
Figure 5
Figure 5
Progression and reversibility of ADR nephropathy in POD;Sirt1RNAi and TUB;Sir1RNAi mice. A: A scheme of study design. B: UACR of mice 0, 14, and 28 days after ADR injection. P < 0.05 versus UACR on D0. (N = 7 POD;Sirt1RNAi mice in both ADR + DOX and ADR + DOX_WD groups, and N = 8 TUB;Sirt1RNAi mice in both ADR + DOX and ADR + DOX_WD groups). C: Serum creatinine levels of mice after ADR injection. D: Representative images of PAS-stained kidney sections showing global glomerulosclerosis (black arrows), segmental glomerulosclerosis (black arrowheads), normal glomeruli (gray arrowheads), and dilated tubules with protein casts. E: Representative electron microscopy images for POD;Sirt1RNAi mice showing focal areas of effacement (red arrows) with areas of normal FPs (black arrows). F: A bar graph of FP width for POD;Sirt1RNAi mice. (N = 3 mice in each group of ADR + DOX and ADR + DOX_WD.) P < 0.05, ∗∗∗P < 0.001. Scale bar = 50 μm (D). P, podocytes.
Figure 6
Figure 6
Mitochondrial response of podocytes with Sirt1 knockdown to ADR treatment. A: mtDNA/nuclear DNA (nuDNA) ratio of PGECs with and without 0.4 μg/mL ADR treatment for 6 hours. Results from four independent experiments. B: Relative expression of mitochondrial genes and other genes of interest for PGECs with and without ADR treatment. Results from at least five independent experiments. C: Mitochondria staining of POD;Sirt1RNAi podocytes using a mitochondrial membrane–dependent MTR probe. D: Co-immunostaining of mitochondria and a marker of mitophagy by anti-TOM20 (red) and anti-parkin (pseudocolored: white) antibodies, respectively. Inset, right panel: High-power images of the area circumscribed by the dashed-line squares in the larger images. ADR, 0.4 μg/mL ADR for 6 hours; ADR + DOX, dose and duration of treatment same as previously described; Control, no treatment; DOX, 2 μg/mL DOX for 48 hours. P < 0.05, ∗∗∗P < 0.001. Scale bar = 20 μm (C and D); 5 μm (D, insets).
Figure 7
Figure 7
Markers of autophagy in POD;Sirt1RNAi podocytes treated with ADR. A: Representative Western blot analyses of LC3, p62/SQSTM1, and β-actin of POD;Sirt1RNAi podocytes with and without DOX-induced Sirt1 knockdown treated with ADR in the absence or presence of an autophagy inhibitor, bafilomycin A. B: Band densitometric values of Western blot analyses for LC3-II and p62 relative to β-actin and normalized to lane 1. Values are averages from two sets of experiments. Black bars, p62/actin; white bars, LC3-II/actin.
Figure 8
Figure 8
Mitochondrial gene expression and morphological characteristics in POD;Sirt1RNAi mice with podocyte Sirt1 knockdown. A: A bar graph depicting mtDNA content normalized to nuDNA in glomeruli of POD;Sirt1RNAi mice with (ADR + DOX_WD) and without (ADR + DOX) reversal of Sirt1 knockdown. N = 4 samples per group. B: Electron microscopy images of mitochondria in podocytes of POD;Sirt1RNAi mice. Green arrows indicate fragmented mitochondria with loss of internal cristae structure; red arrows, normal-appearing mitochondria with intact cristae; green arrowheads, early autophagosomes containing mitochondrial profile similar to an adjacent mitochondrion in the cytoplasm; red arrowheads, autophagosomes containing heterogeneous cytoplasmic material. C: Normalized expressions of selected mitochondrial genes in isolated glomeruli of POD;Sirt1RNAi mice with or without reversal of Sirt1 knockdown. N = 4 samples per group. ∗∗P < 0.01. Black bars, ADR+DOX_WD; blue bars, ADR+DOX; FP, foot processes.
Figure 9
Figure 9
Diabetic CAGs;Sirt1RNAi mice with Sirt1 knockdown. A: A scheme depicting the experimental design for determining the impact of STZ-induced diabetes on the development of nephropathy in CAGs;Sirt1RNAi mice with and without DOX-induced Sirt1 knockdown (STZ + DOX and STZ, respectively). B: Urinary albumin/creatinine ratio of mice 20 weeks after the start of STZ injections. C: PAS-stained kidney sections. Adjacent bar graph depicts the percentage of mesangial area/glomerular tuft area in the two groups of mice. D: TEMs of mitochondria within podocytes. Arrowheads indicate round, fragmented mitochondria with absence of internal cristae structure; arrows, long filamentous mitochondria. E: Glomerular expression of mitochondrial genes. P < 0.05, ∗∗P < 0.01. Scale bars: 50 μm (C); 1 μm (D).

Similar articles

Cited by

References

    1. Nakagawa T., Guarente L. Sirtuins at a glance. J Cell Sci. 2011;124:833–838. - PMC - PubMed
    1. Salminen A., Kaarniranta K. SIRT1: regulation of longevity via autophagy. Cell Signal. 2009;21:1356–1360. - PubMed
    1. Rodgers J.T., Lerin C., Haas W., Gygi S.P., Spiegelman B.M., Puigserver P. Nutrient control of glucose homeostasis through a complex of PGC-1alpha and SIRT1. Nature. 2005;434:113–118. - PubMed
    1. Nemoto S., Fergusson M.M., Finkel T. SIRT1 functionally interacts with the metabolic regulator and transcriptional coactivator PGC-1{alpha} J Biol Chem. 2005;280:16456–16460. - PubMed
    1. Scarpulla R.C. Metabolic control of mitochondrial biogenesis through the PGC-1 family regulatory network. Biochim Biophys Acta. 2011;1813:1269–1278. - PMC - PubMed

Publication types

MeSH terms

LinkOut - more resources