. 2014 Jun 30;5(12):4257-68.
doi: 10.18632/oncotarget.1991.

Histone deacetylase 2 and N-Myc reduce p53 protein phosphorylation at serine 46 by repressing gene transcription of tumor protein 53-induced nuclear protein 1

Affiliations

Histone deacetylase 2 and N-Myc reduce p53 protein phosphorylation at serine 46 by repressing gene transcription of tumor protein 53-induced nuclear protein 1

Jeyran Shahbazi et al. Oncotarget. .

Abstract

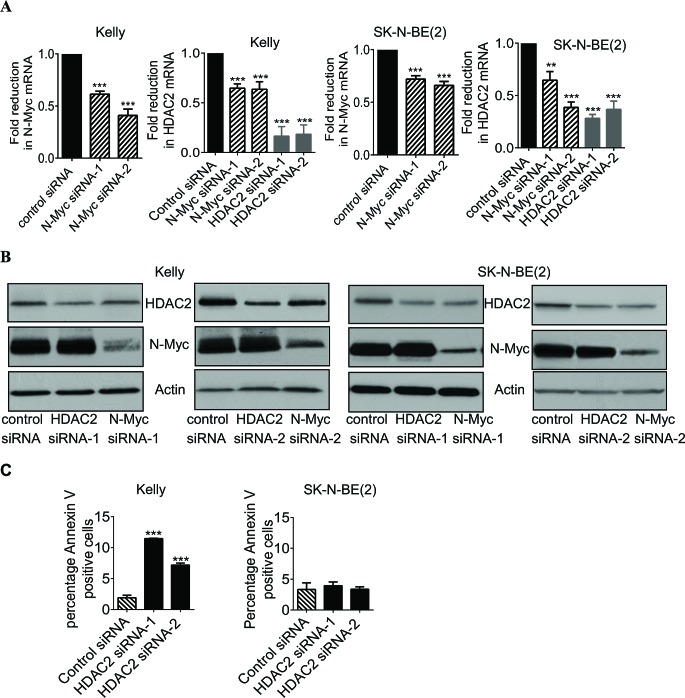
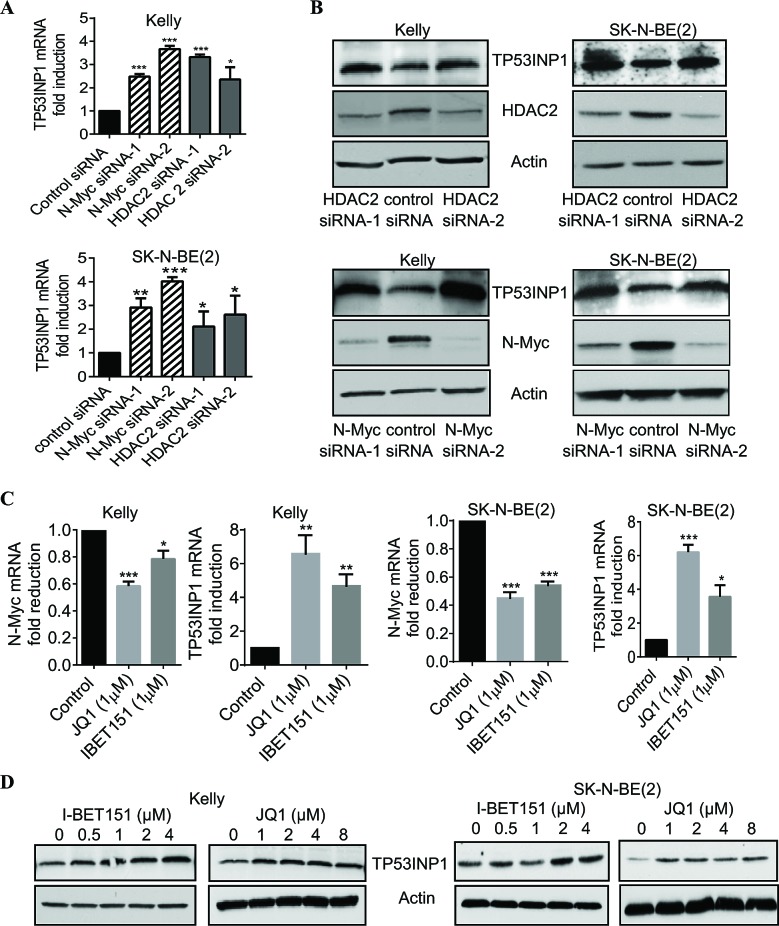
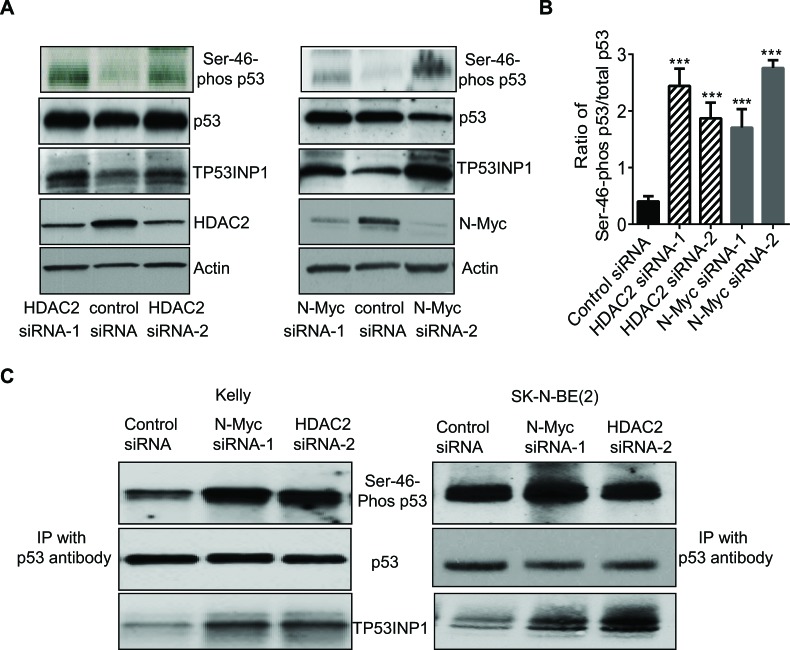
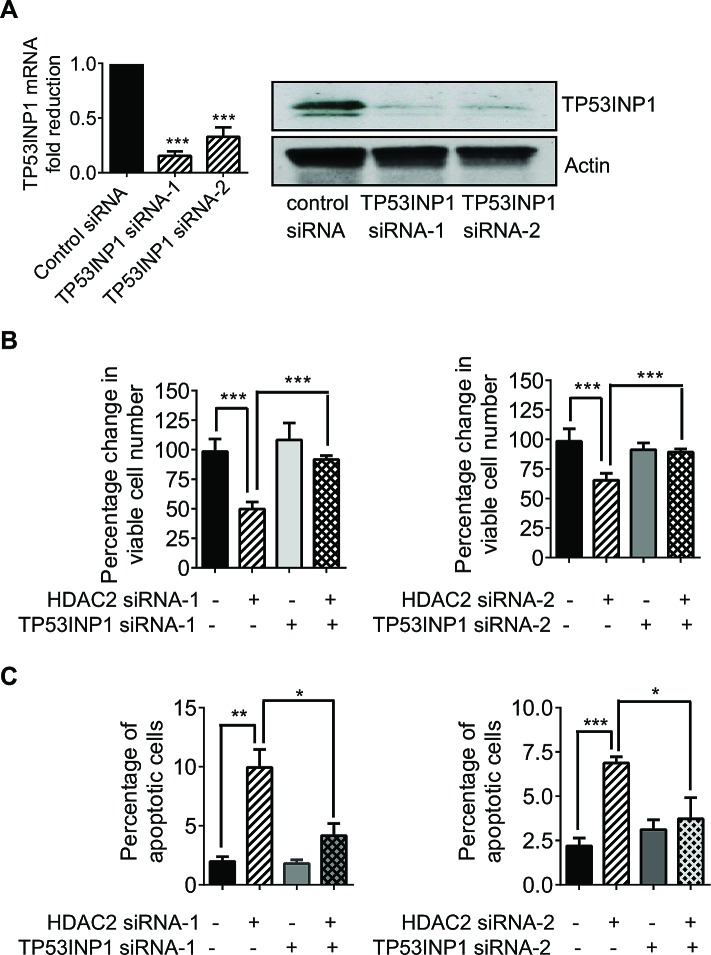
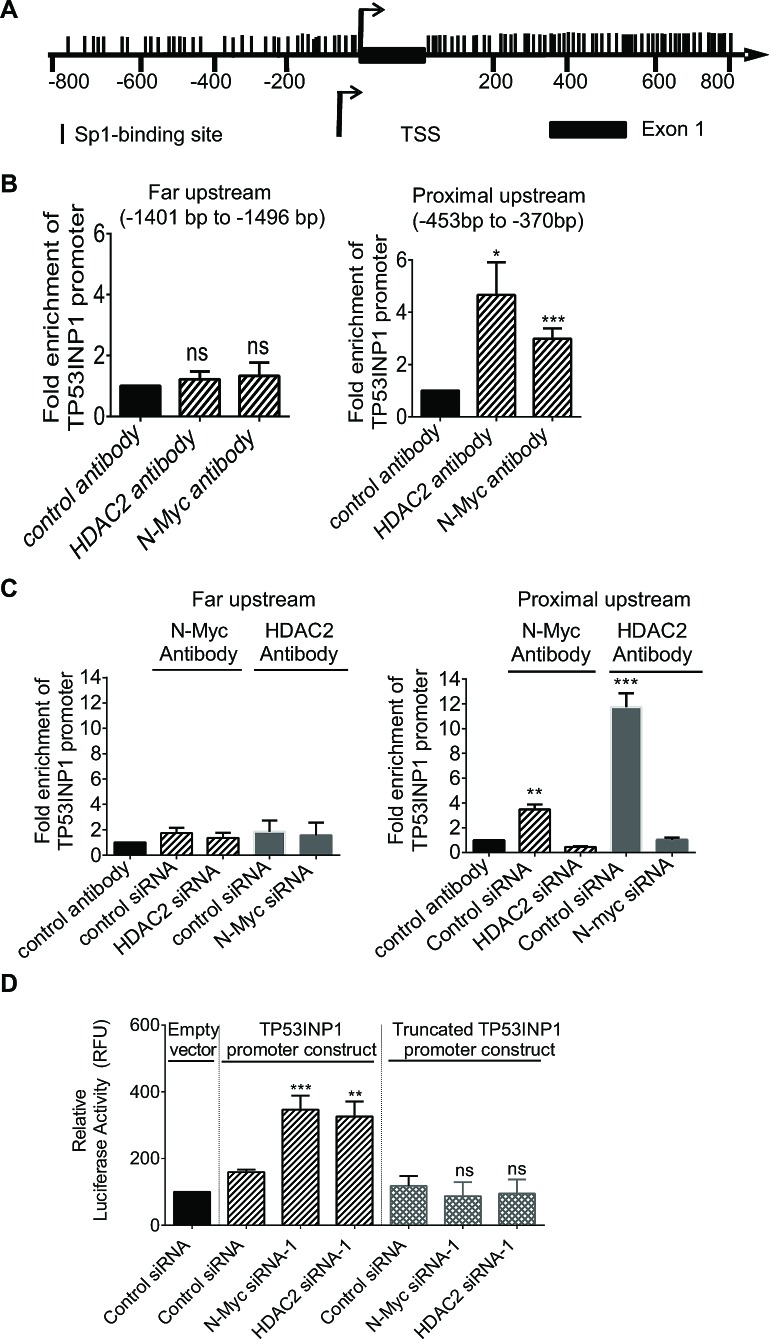
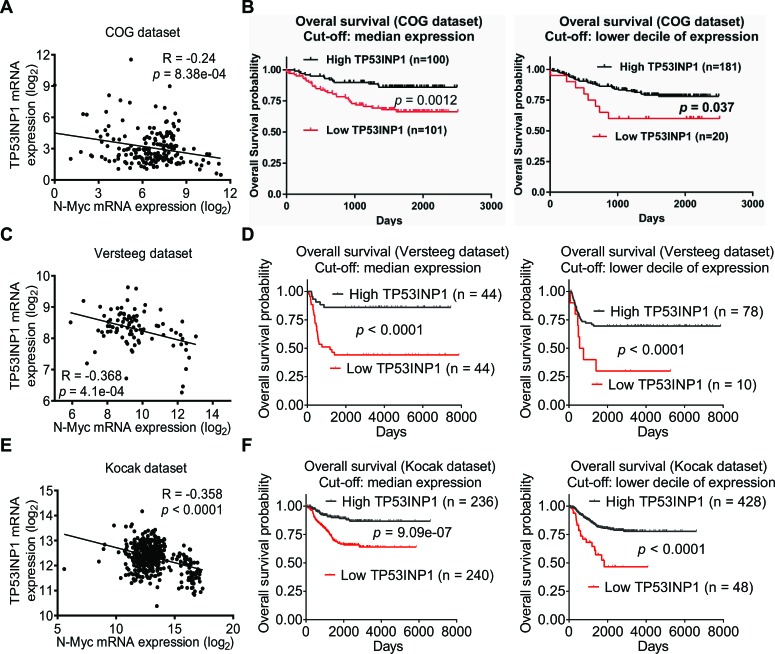
Myc oncoproteins and histone deacetylases (HDACs) exert oncogenic effects by modulating gene transcription. Paradoxically, N-Myc induces p53 gene expression. Tumor protein 53-induced nuclear protein 1 (TP53INP1) phosphorylates p53 protein at serine 46, leading to enhanced p53 activity, transcriptional activation of p53 target genes and programmed cell death. Here we aimed to identify the mechanism through which N-Myc overexpressing p53 wild-type neuroblastoma cells acquired resistance to apoptosis. TP53INP1 was found to be one of the genes most significantly repressed by HDAC2 and N-Myc according to Affymetrix microarray gene expression datasets. HDAC2 and N-Myc reduced TP53INP1 gene expression by direct binding to the TP53INP1 gene promoter, leading to transcriptional repression of TP53INP1, p53 protein de-phosphorylation at serine 46, neuroblastoma cell proliferation and survival. Moreover, low levels of TP53INP1 expression in human neuroblastoma tissues correlated with high levels of N-Myc expression and poor patient outcome, and the BET bromodomain inhibitors JQ1 and I-BET151 reduced N-Myc expression and reactivated TP53INP1 expression in neuroblastoma cells. These findings identify TP53INP1 repression as an important co-factor for N-Myc oncogenesis, and provide further evidence for the potential application of BET bromodomain inhibitors in the therapy of N-Myc-induced neuroblastoma.


Conflict of interest statement

The authors declare that they have no competing interests.

Figures

Figure 1
Figure 1. Up-regulation of HDAC2 expression promotes survival of p53 wild type neuroblastoma cells
A and B, Kelly and SK-N-BE(2) neuroblastoma cells were transfected with scrambled control siRNA, N-Myc siRNA-1, N-Myc siRNA-2, HDAC2 siRNA-1 or HDAC2 siRNA-2 for 48 hours. RNA and protein were extracted from the cells and subjected to RT-PCR (A) and immunoblot (B) analyses of N-Myc and HDAC2 mRNA and protein expression. C, Kelly and SK-N-BE(2) cells were transfected with control siRNA, HDAC2 siRNA-1 or HDAC2 siRNA-2 for 72 hours. Cells were then stained with FITC-conjugated Annexin V and subjected to flow cytometry studies. The percentage of cells positively stained with Annexin V was analysed using FlowJo software. Error bars represent standard error. ** indicates P < 0.01 and *** indicates P < 0.001.
Figure 2
Figure 2. HDAC2 and N-Myc commonly repress, and BET bromodomain inhibitors up-regulate, TP53INP1 expression
A and B, Kelly and SK-N-BE(2) neuroblastoma cells were transfected with scrambled control siRNA, N-Myc siRNA-1, N-Myc siRNA-2, HDAC2 siRNA-1 or HDAC2 siRNA-2 for 48 hours. RNA and protein were extracted from the cells and subjected to RT-PCR (A) and immunoblot (B) analyses of TP53INP1 mRNA and protein expression. C and D, Kelly and SK-N-BE(2) cells were treated with vehicle control or various doses of the BET bromodomain inhibitor I-BET151 or JQ1 for 48 hours, followed by RNA and protein extraction. C, N-Myc and TP53INP1 mRNA expression was analysed by RT-PCR. D, TP53INP1 protein expression was analysed by immunoblot. Error bars represent standard error. *, ** and *** indicate P < 0. 05, 0.01 and 0.001, respectively.
Figure 3
Figure 3. N-Myc and HDAC2 block p53 protein phosphorylation at Ser-46
A and B, Kelly neuroblastoma cells were transfected with control siRNA, N-Myc siRNA-1, N-Myc siRNA-2, HDAC2 siRNA-1 or HDAC2 siRNA-2 for 48 hours. A, protein was extracted from the cells and subjected to immunoblot analyses with anti-Ser-46-phosphorylated p53 (Ser-46-phos p53), anti-total p53 and anti-TP53INP1 antibodies. B, the ratio of Ser-46-phos p53 to total p53 was quantified. C, Kelly and SK-N-BE(2) cells were transfected with control siRNA, N-Myc siRNA-1 or HDAC2 siRNA-2 for 48 hours. Protein was extracted from the cells and immunoprecipitated (IP) with an anti-p53 antibody. The immunoprecipitated protein was subjected to immunoblot analyses with anti-Ser-46-phos p53, anti-total p53 and anti-TP53INP1 antibodies. Error bars represent standard error. *** indicates P < 0.001.
Figure 4
Figure 4. Transcriptional repression of TP53INP1 protects neuroblastoma cells against apoptosis
A, Kelly cells were transfected with control siRNA, TP53INP1 siRNA-1 or TP53INP1 siRNA-2. TP53INP1 mRNA and protein expression was analysed by real-time RT-PCR and immunoblot. B and C, Kelly cells were transfected with control siRNA, HDAC2 siRNA-1, HDAC2 siRNA-2, TP53INP1 siRNA-1, TP53INP1 siRNA-2, HDAC2 siRNA-1 plus TP53INP1 siRNA-1, or HDAC2 siRNA-2 plus TP53INP1 siRNA-2. Seventy-two hours later, the cells were incubated with Alamar blue for Alamar blue assays (B) or stained with FITC-conjugated Annexin V for flow cytometry analysis of apoptotic cells (C). Error bars represent standard error. *, ** and *** indicate P < 0.05, 0.01 and 0.001, respectively.
Figure 5
Figure 5. N-Myc and HDAC2 reduce TP53INP1 gene expression by direct binding to the TP53INP1 gene promoter
A, schematic representation of the TP53INP1 gene promoter. TSS represents the transcription start site and each vertical line represents an Sp1-binding site. B, ChIP assays were performed with a control IgG, an anti-N-Myc antibody or an anti-HDAC2 antibody and PCR with primers targeting a negative control region (-1401 bp to -1496 bp upstream of TSS) or proximal upstream region (-453 bp to -370 bp) of the TP53INP1 gene promoter in Kelly cells. Fold enrichment of the TP53INP1 gene promoter by the control IgG, the anti-N-Myc antibody or the anti-HDAC2 antibody was calculated by dividing PCR products from primers targeting the proximal upstream region by PCR products from primers targeting the negative control region. C, ChIP assays were performed with a control IgG or an anti-N-Myc antibody in Kelly cells 48 hours after transfection with control siRNA or HDAC2 siRNA-1, and performed with a control IgG or an anti-HDAC2 antibody in Kelly cells 48 hours after transfection with control siRNA or N-Myc siRNA-1. PCR and data analysis were performed as above. D, luciferase assays were performed in Kelly cells after co-transfection with control siRNA, N-Myc siRNA-1 or HDAC2 siRNA-1, together with Cypridina TK control construct plus pLightSwitch_Prom construct expressing empty vector, wild type or proximal upstream truncated TP53INP1 gene promoter for 48 hours. Luciferase activities were measured with a LightSwitch Dual Assay System Kit, normalized according to Cypridina TK control construct, and expressed as percentage changes relative to samples transfected with control siRNA plus empty vector pLightSwitch_Prom construct. Error bars represent standard error. *, ** and *** indicate P < 0.05, 0.01 and 0.001 respectively, and ns indicates no significant difference.
Figure 6
Figure 6. Low levels of TP53INP1 expression in tumor tissues correlate with high levels of N-Myc expression and poor prognosis in neuroblastoma patients.
A, RT-PCR studies were performed in 201 primary human neuroblastoma from Children's Oncology Group (COG) with primers targeting TP53INP1 or N-Myc. Correlation between TP53INP1 expression and N-Myc expression in the tumor tissues was analysed by Pearson's correlation. B, Kaplan–Meier survival analysis was performed based on the level of expression of TP53INP1 in the 201 neuroblastoma patients. The level of expression was considered high or low in relation to the median or lower decile of TP53INP1 expression of all tumors analyzed. C and D, correlation between TP53INP1 expression and N-Myc expression was analysed in 88 and 476 human neuroblastoma samples in publically available microarray gene expression datasets of Versteeg (C) and Kocak (D). E and F, Kaplan–Meier survival analysis was performed based on the level of TP53INP1 expression in the 88 and 476 neuroblastoma patients in the Versteeg dataset (E) and the Kocak dataset (F). The level of expression was considered high or low in relation to the median or lower decile of TP53INP1 expression of the tumors analyzed.

References

    1. Maris JM, Hogarty MD, Bagatell R, Cohn SL. Neuroblastoma. Lancet. 2007;369:2106–20. - PubMed
    1. Brodeur GM. Neuroblastoma: biological insights into a clinical enigma. Nat Rev Cancer. 2003;3:203–16. - PubMed
    1. Dang CV. MYC on the path to cancer. Cell. 2013;149:22–35. - PMC - PubMed
    1. Eilers M, Eisenman RN. Myc's broad reach. Genes Dev. 2008;22:2755–66. - PMC - PubMed
    1. Meyer N, Penn LZ. Reflecting on 25 years with MYC. Nat Rev Cancer. 2008;8:976–90. - PubMed

Publication types

MeSH terms