. 2014 Aug;17(8):1114-22.
doi: 10.1038/nn.3749. Epub 2014 Jun 22.

Population coding of affect across stimuli, modalities and individuals

Affiliations

Population coding of affect across stimuli, modalities and individuals

Junichi Chikazoe et al. Nat Neurosci. 2014 Aug.

Abstract

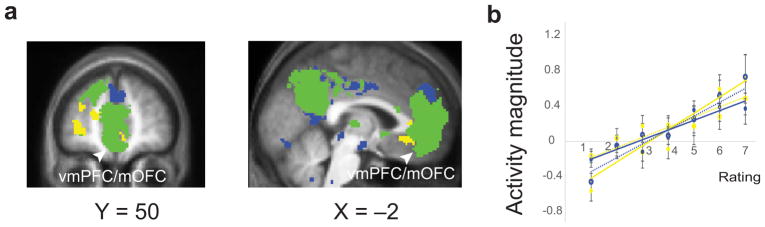
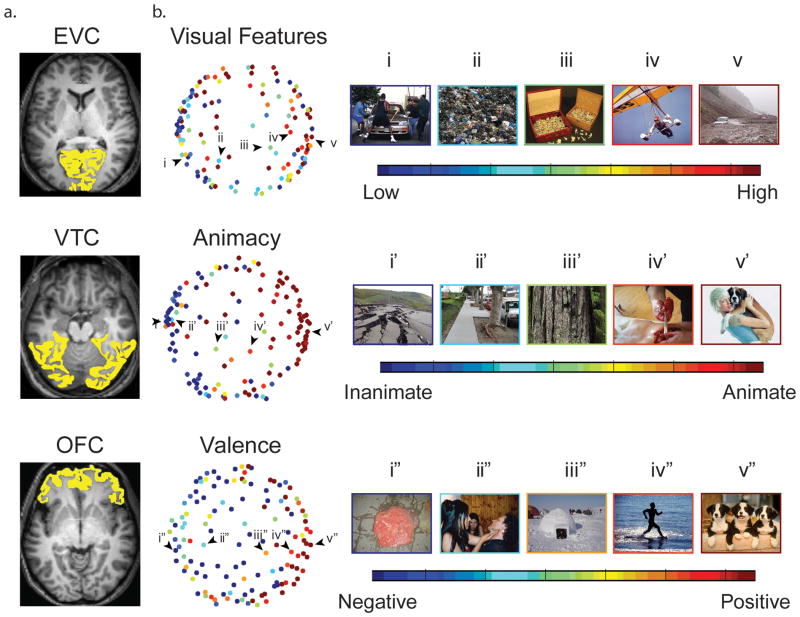
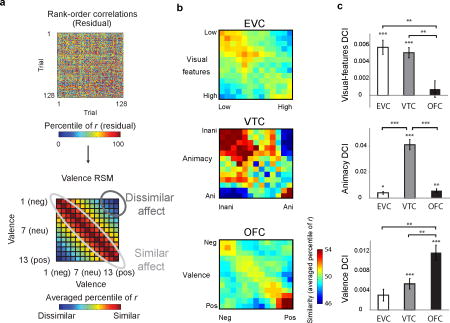
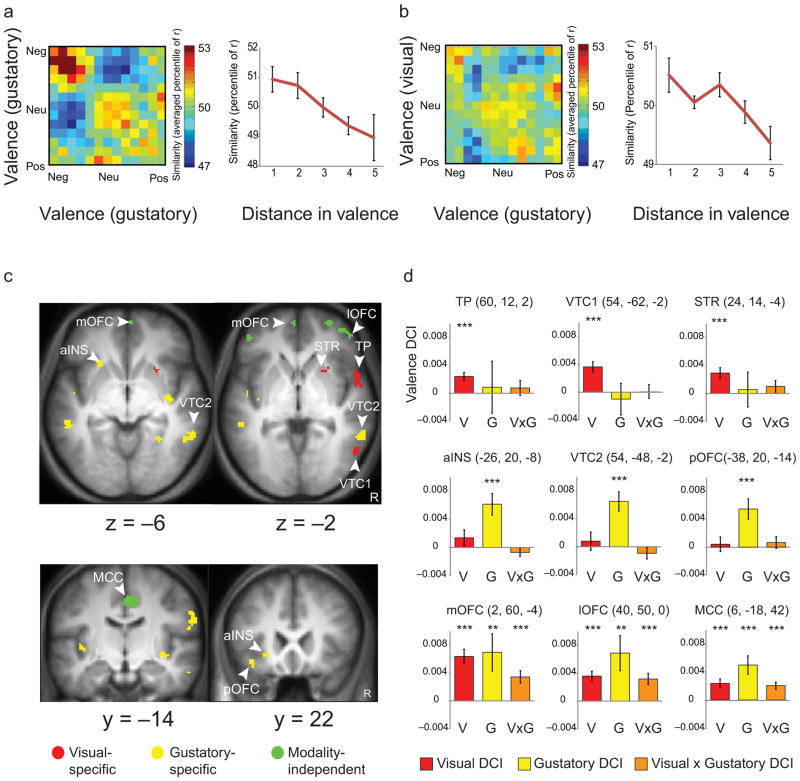
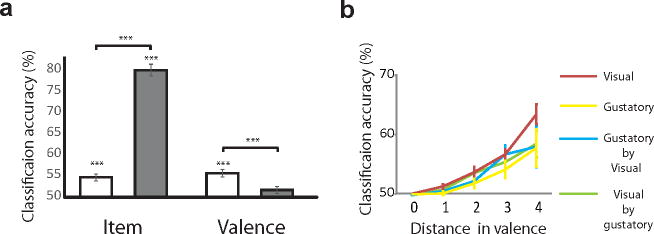
It remains unclear how the brain represents external objective sensory events alongside our internal subjective impressions of them--affect. Representational mapping of population activity evoked by complex scenes and basic tastes in humans revealed a neural code supporting a continuous axis of pleasant-to-unpleasant valence. This valence code was distinct from low-level physical and high-level object properties. Although ventral temporal and anterior insular cortices supported valence codes specific to vision and taste, both the medial and lateral orbitofrontal cortices (OFC) maintained a valence code independent of sensory origin. Furthermore, only the OFC code could classify experienced affect across participants. The entire valence spectrum was represented as a collective pattern in regional neural activity as sensory-specific and abstract codes, whereby the subjective quality of affect can be objectively quantified across stimuli, modalities and people.


Conflict of interest statement

Conflicts of interest: The authors declare no conflict of interests.

Competing financial interests

The authors declare no competing financial interests.

Figures

Fig. 1
Fig. 1
Parametric modulation analysis (univariate) for independent ratings of positive and negative valence. (a) Activation map of sensitivity to positive valence, negative valence, and both. Yellow indicates voxels sensitive to positive valence (P < 0.001 for positive, P > 0.05 for negative), blue indicates voxels sensitive to negative valence (P < 0.001 for negative, P > 0.05 for positive) and green indicates conjunction of positive and negative valence (P < 0.031 for positive, P <0.031 for negative). (b) Mean activity within vmPFC/mOFC increased along with increases of both positive and negative valence scores. Yellow lines indicate signals of the peak voxel (x = –8, y = 42, z = –12, t15 = 8.7, P = 0.0000003, FDR ≤ 0.05), maximally sensitive to positive valence positive. Blue lines indicate signals of the peak voxel (x = –8, y = 52, z = –8, t15 = 6.8, P = 0.000006, FDR ≤ 0.05), maximally sensitive to negative valence. Dashed lines indicate signal for opposite valence (i.e., negative valence in the peak positive voxel, and positive valence in the peak negative voxel). n = 16 participants. Error bars represent s.e.m.
Fig. 2
Fig. 2
Representational geometry of multi-voxel activity patterns in early visual cortex (EVC), ventral temporal lobe (VTC) and orbitofrontal cortices (OFC). (a) ROIs were determined based on anatomical grey matter masks. (b) The 128 visual scene stimuli arranged using MDS such that pairwise distances reflect neural response-pattern similarity. Color code indicates feature magnitude scores for low-level visual features in EVC (top), animacy in VTC (middle) and subjective valence in OFC (bottom) for the same stimuli. Examples a through e traverse the primary dimension in each feature space, with pictures illustrating visual features (e.g. luminance) (top), animacy (middle), and valence (bottom)
Fig. 3
Fig. 3
Population coding of visual, object, and affect properties of visual scenes. (a) Correlations of activation patterns across trials were rank-ordered within a participant. In the ideal representation similarity matrix (RSM), trials with similar features (e.g., matching valence) demonstrate higher correlations along the diagonal compared to those with dissimilar features on the off-diagonal. (b) After regressing out other properties and effects of no interest, residual correlations were sorted based on visual features (13 × 13), animacy (13 × 13), or valence (13 × 13) properties, then separately examined within the EVC, VTC and OFC. (b) Correlation ranks were averaged for each cell, providing visual (13 × 13), animacy (13 × 13), and valence RSMs (13 × 13). Higher correlations were observed along the main diagonal in the visual RSM in the EVC, animacy RSM in the VTC, and valence RSM in the OFC. (c) Correlation ranks in the EVC, VTC and OFC were subject to GLM with differences in visual (top), animacy (middle) and valence (bottom) features as linear predictors. GLM coefficients (“distance-correspondence index (DCI)”) represent to what extent correlations were predicted by the property types. For visual-features DCI, t test (EVC: t15 = 6.7, P = 0.00003, VTC: t15 = 8.5, P = 0.000002, OFC: t15 = 0.8, P = 1), paired t test (EVC vs. VTC: t15 = 0.8, P = 1, EVC vs. OFC: t15 = 4.2, P = 0.008, VTC vs. OFC: t15 = 4.4, P = 0.005). For animacy DCI, t test (EVC: t15 = 3.6, P = 0.01, VTC: t15 = 10.3, P = 1.5 × 10⁻⁷, OFC: t15 = 3.9, P = 0.006), paired t test (EVC vs. VTC: t15 = –9.0, P = 1.7 × 10⁻⁶, EVC vs. OFC: t15 = –1.0, P = 1, VTC vs. OFC: t15 = 11.3, P = 9.2 × 10⁻⁸). For valence DCI, t test (EVC: t15 = 2.5, P = 0.11, VTC: t15 = 5.0, P = 0.0008, OFC: t15 = 7.6, P = 7.7 × 10⁻⁶), paired t test (EVC vs. VTC: t15 = 1.8, P = 0.81, EVC vs. OFC: t15 = –4.2, P = 0.007, VTC vs. OFC: t15 = –4.8, P = 0.002). A t test within a region was one-sided while paired t test was two-sided. n = 16 participants. Error bars represent s.e.m. *** P < 0.001, ** P < 0.01, * P < 0.05, Bonferroni corrected.
Fig 4
Fig 4
Region specific population coding of visual features, object animacy, and valence in visual scenes. (a) Multivariate searchlight analysis revealed distinct areas represent coding of visual features (green), animacy (yellow) and valence (red) properties. Activations were thresholded at P < 0.001 uncorrected. (b) GLM coefficients (“distance-correspondence index (DCI)”) represent to what extent correlations were predicted by the property types (visual features, animacy, and valence). For visual-features DCI, t test (EVC: t15 =8.4, P = 0.000003, VTC: t15 = 4.3, P = 0.004, TP: t15 = –0.1, P = 1, OFC: t15 = 1.4, P = 1), paired t test (EVC vs. VTC: t15 = 6.4, P = 0.0002, EVC vs. TP: t15 = 5.8, P = 0.0006, EVC vs. OFC: t15 = 4.5, P = 0.008, VTC vs. TP: t15 = 2.6, P = 0.36, VTC vs. OFC: t15 = 1.2, P = 1, TP vs. OFC: t15 = –1.4, P = 1). For animacy DCI, t test (EVC: t15 = 3.5, P = 0.017, VTC: t15 = 7.8, P = 0.000007, TP: t15 = 0.9, P = 1, OFC: t15 = 3.6, P = 0.015), paired t test (EVC vs. VTC: t15 = –6.4, P = 0.0002, EVC vs. TP: t15 = 2.4, P = 0.54, EVC vs. OFC: t15 = 1.1, P = 1, VTC vs. TP: t15 = 6.8, P = 0.0001, VTC vs. OFC: t15 = 7.8, P = 0.00002, TP vs. OFC: t15 = –2.9, P = 0.19). For valence DCI, t test (EVC: t15 = 1.0, P = 1; VTC: t15 = 2.6, P = 0.12, TP: t15 = 3.5, P = 0.019, OFC: t15 = 6.0, P = 0.0001), paired t test (EVC vs. VTC: t15 = –0.7, P = 1, EVC vs. TP: t15 = –1.5, P = 1, EVC vs. OFC: t15 = –3.4, P = 0.071, VTC vs. TP: t15 = –1.6, P = 1, VTC vs. OFC: t15 = –5.0, P = 0.003, TP vs. OFC: t15 = –5.2, P = 0.002). A t test within a region was one-sided while paired t test was two-sided. n = 16 participants. (c) – (e) Difference in mean activity magnitude and pattern in the searchlight defined regions ((c) – (e): the medial OFC/vmPFC; (f) – (h): the lateral OFC). (c) and (f) Relationship of activity magnitude and ratings for positivity and negativity. n = 16 participants. (d) and (g) Valence representation similarity matrices based on the mean activity magnitude (e) and (h) Valence representation similarity matrices based on pattern activation (correlation). (e) and (h) DCI for mean magnitude and pattern analyses. n = 16 participants. Error bars represent s.e.m. EVC: early visual cortex; VTC: ventral temporal cortex; TP: temporal pole, OFC: orbitofrontal cortex. Error bars represent s.e.m. *** P < 0.001, ** P < 0.01, * P < 0.05. Bonferroni corrected.
Fig. 5
Fig. 5
Visual, gustatory and cross-modal affect codes. (a) OFC voxel activity pattern correlations across trials in the gustatory experiment, and (b) across visual and gustatory experiments were rank-ordered within each participant, and then averaged, based on valence combinations (13x13). Correlations across trials were sorted into 5 bins of increasing distance in valence. OFC correlations corresponded to valence distance, both within tastes and across tastes and visual scenes. n = 15 participants. (c) Multivariate searchlight results revealed subregions coding modality-specific (visual = red, taste = yellow) and modality-independent (green) valence. (d) GLM coefficients (“distance-correspondence index (DCI)”) represent to what extent correlations were predicted by valence. Averaged distance correspondence index (DCI) in the visual (top row), taste (middle row), visual × gustatory (bottom row) valence subregions. In TP, t test (V: t15 = 4.3, P = 0.0003; G: t15 = 0.23, P = 0.41, V × G: t15 = 0.71, P = 0.24). In VTC1, t test (V: t15 =4.9, P = 0.00009; G: t15 = –0.43, P = 1, V × G: t15 = 0.10, P = 0.46). In STR, t test (V: t15 = 3.9, P = 0.0007; G: t15 = 0.23, P = 0.41, V × G: t15 = 1.2, P = 0.12). In aINS, t test (V: t15 = 1.2, P = 0.12; G: t15 = 4.0, P = 0.0006, V × G: t15 = –1.2, P = 1). In VTC2, t test (V: t15 = 0.62, P = 0.27; G: t15 = 4.8, P = 0.0001, V × G: t15 = –1.2, P = 1). In pOFC, t test (V: t15 = 0.40, P = 0.34; G: t15 = 3.7, P = 0.0010, V × G: t15 = 0.78, P = 0.22). In mOFC, t test (V: t15 = 6.3, P = 0.000007; G: t15 = 2.6, P = 0.010, V × G: t15 = 3.9, P = 0.0008). In lOFC, t test (V: t15 = 5.2, P = 0.00005; G: t15 = 2.8, P = 0.007, V × G: t15 = 4.1, P = 0.0005). In MCC, t test (V: t15 = 3.8, P = 0.0008; G: t15 = 3.8, P = 0.0009, V × G: t15 = 4.0, P = 0.0005). P values were uncorrected. n = 16 participants. mOFC: medial orbitofrontal cortex; lOFC: lateral orbitofrontal cortex; MCC: midcingulate cortex; VTC: ventral temporal cortex; STR: striatum; TP: temporal pole; aINS: anterior insula; pOFC: posterior orbitofrontal cortex. V: visual valence; G: gustatory valence; V × G: visual × gustatory valence. Error bars represent s.e.m. *** P < 0.001, ** P < 0.01
Fig. 6
Fig. 6
Cross-participant classification of items and affect. (a) Classification accuracies of cross-participant multivoxel patterns for specific items and subjective valence in the VTC (gray) and OFC (white). Each target item or valence was estimated by all other participants’ representation in a leave-one-out procedure. Performance was calculated by the target’s similarity to its estimate compared to all other trials in pairwise comparison (50% chance). For item classification, t test (OFC: t15 = 5.7, P =0.00008, VTC: t15 = 21.4, P = 2.4 × 10⁻¹²), paired t test (OFC vs. VTC: 15 = –15.9, P = 8.4 × 10⁻¹¹). For valence classification, t test (OFC: t15 = 6.4, P = 0.00002, VTC: t15 = 2.0, P = 0.13), paired t test (OFC vs. VTC: t15 = 4.2, P = 0.0007). Bonferroni correction was applied, based on number of comparisons for each ROI (2 (ROI). A t test within a region was one-sided while paired t test was two-sided. n = 16 participants. (b) Relationship between classification accuracies and valence distance in the OFC. Accuracies increased monotonically as experienced valence across trials became more clearly differentiated for all conditions. ANOVA (visual: F1.4, 20.3 = 37.4, P = 5.6 × 10⁻⁶, gustatory: F1.3, 18.9 = 4.7, P = 0.033, visual × gustatory: F1.2, 18.6 = 9.7, P = 0.004, gustatory × visual: F1.4, 19.6 = 4.3, P = 0.04). Greenhouse-Geisser correction was applied since Mauchly’s test revealed violation of assumption of sphericity. For visual and visual by gustatory, n = 16 participants. For gustatory and gustatory × visual, n = 15 participants. Error bars represent s.e.m. *** P < 0.001, ** P < 0.01

Comment in

  • A common affective code.
    Arguello PA. Arguello PA. Nat Neurosci. 2014 Aug;17(8):1021. doi: 10.1038/nn0814-1021. Nat Neurosci. 2014. PMID: 25065438 No abstract available.

Similar articles

Cited by

References

    1. Wundt W. Grundriss der Psychologie, von Wilhelm Wundt. W. Engelmann; Leipzig: 1897.
    1. Penfield W, Boldrey E. Somatic motor and sensory representation in the cerebral cortex of man as studies by electrical stimulation. Brain. 1937;60:389–443.
    1. Huth AG, Nishimoto S, Vu AT, Gallant JL. A continuous semantic space describes the representation of thousands of object and action categories across the human brain. Neuron. 2012;76:1210–1224. - PMC - PubMed
    1. Haxby JV, et al. Distributed and overlapping representations of faces and objects in ventral temporal cortex. Science. 2001;293:2425–2430. - PubMed
    1. Kanwisher N, McDermott J, Chun MM. The fusiform face area: a module in human extrastriate cortex specialized for face perception. J Neurosci. 1997;17:4302–4311. - PMC - PubMed

Publication types