. 2014 Jul 15;5(13):4881-94.
doi: 10.18632/oncotarget.2051.

Selective inhibition of unfolded protein response induces apoptosis in pancreatic cancer cells

Affiliations

Selective inhibition of unfolded protein response induces apoptosis in pancreatic cancer cells

Wenwen Chien et al. Oncotarget. .

Abstract

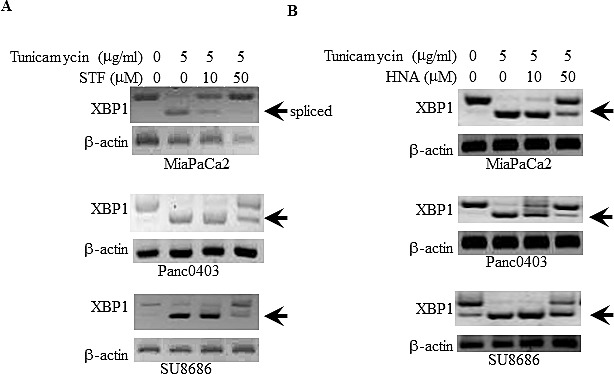
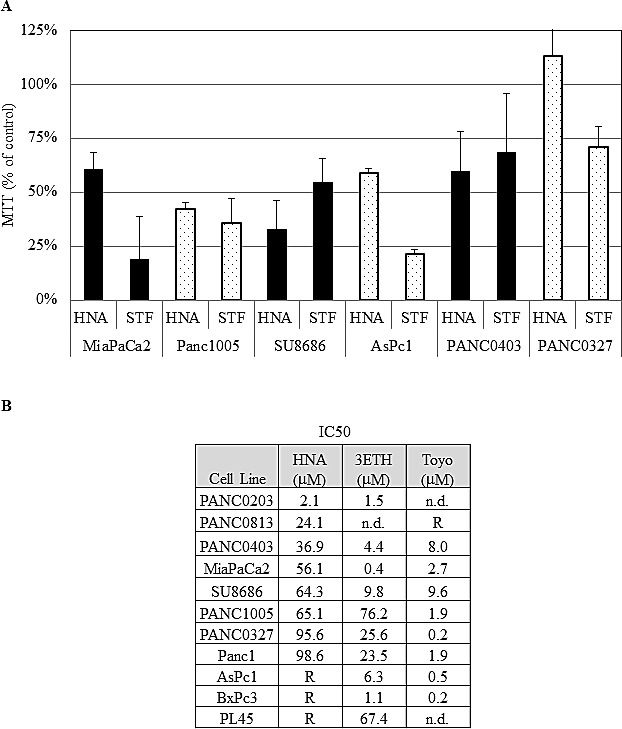
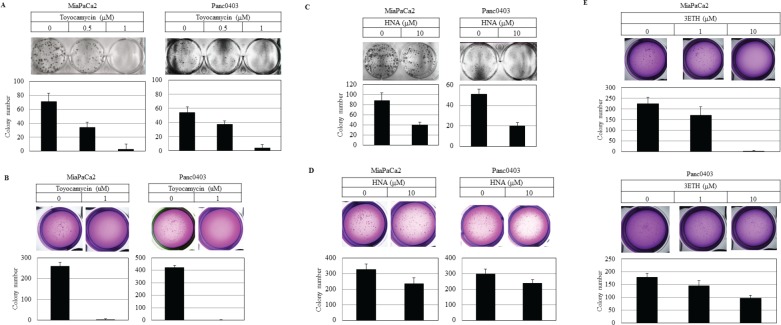
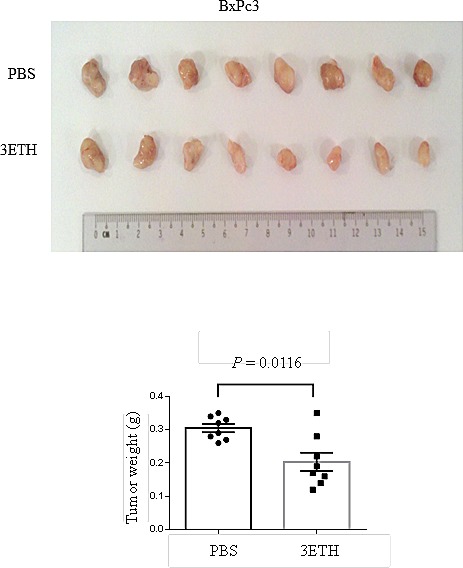
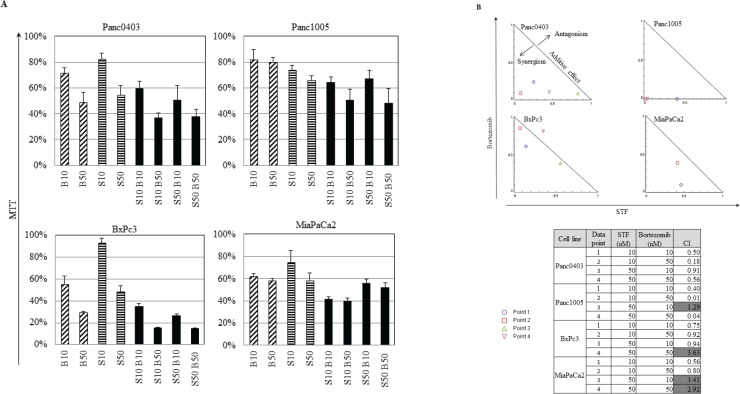
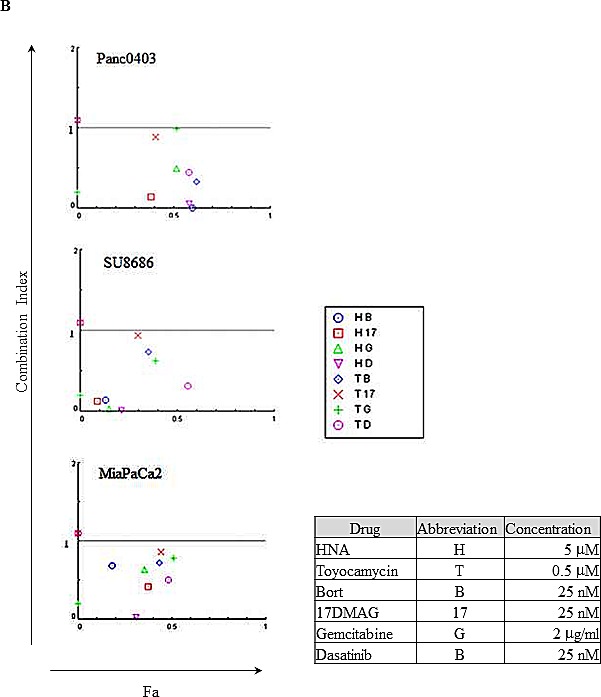
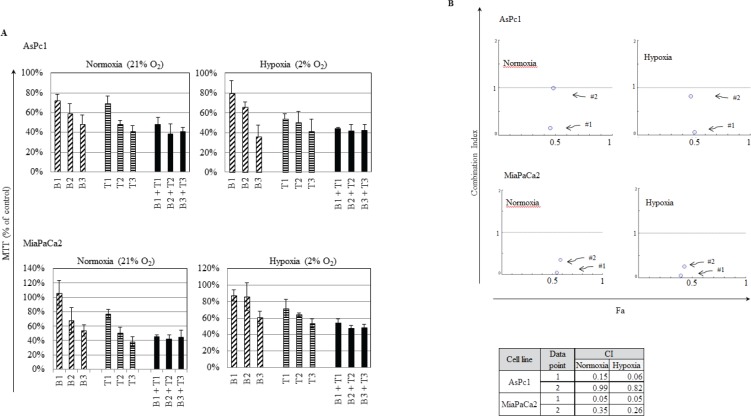
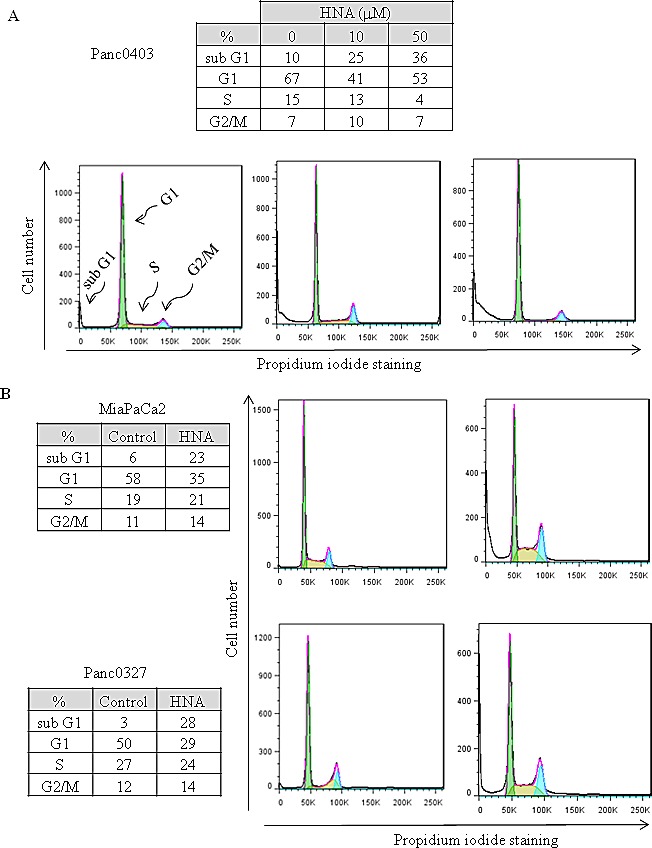
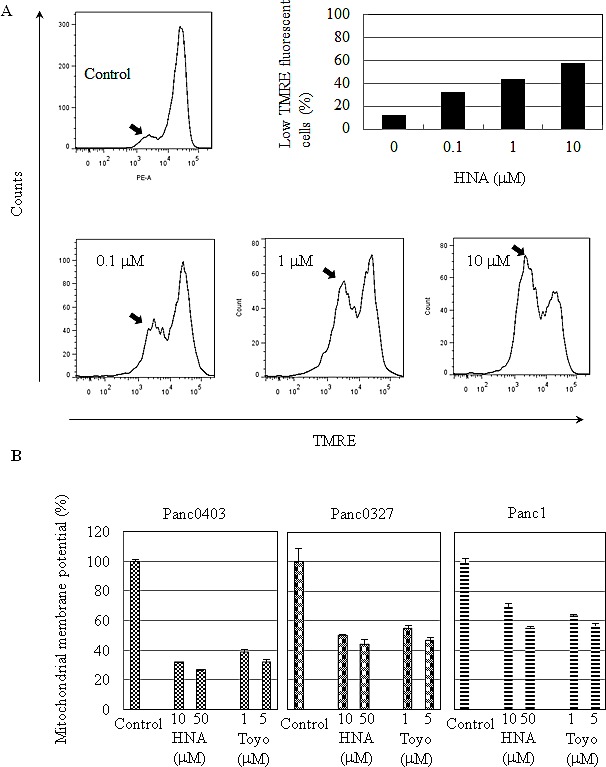
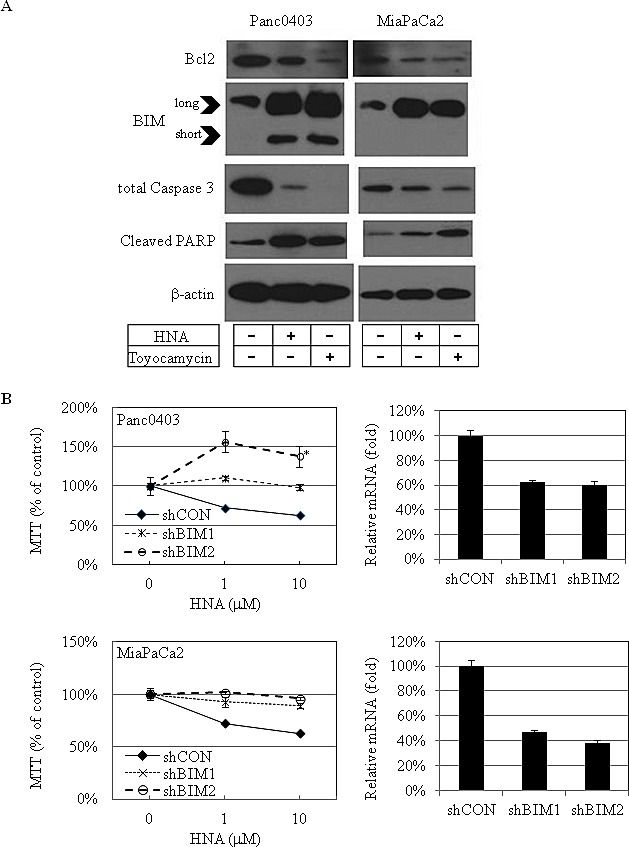
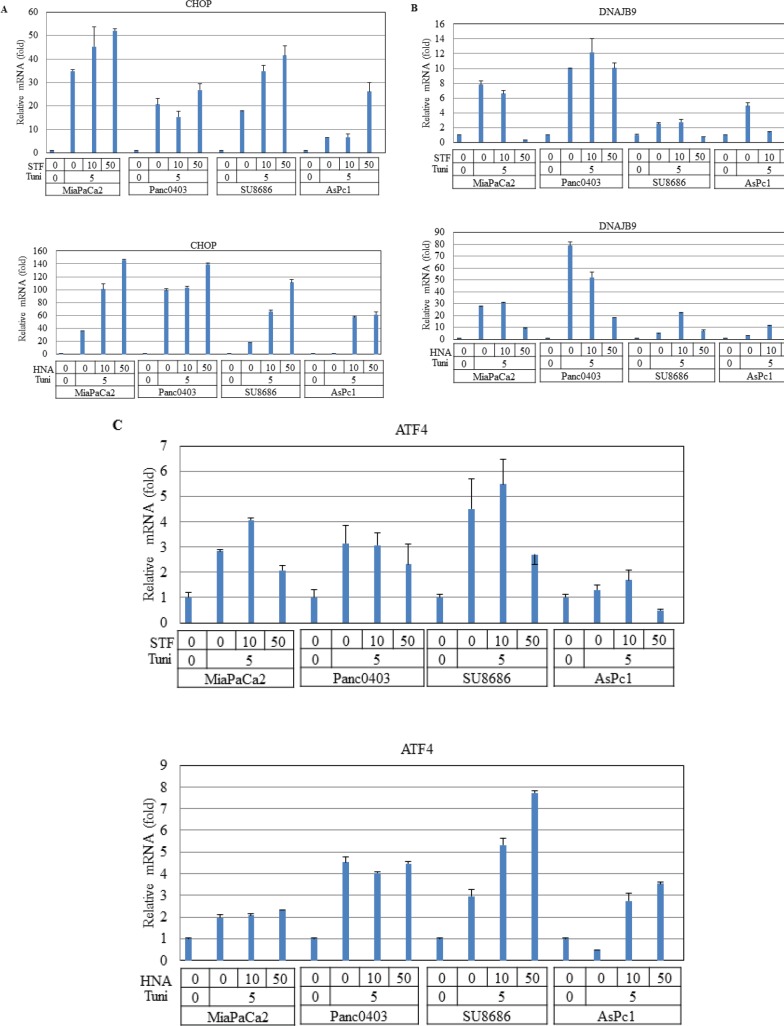
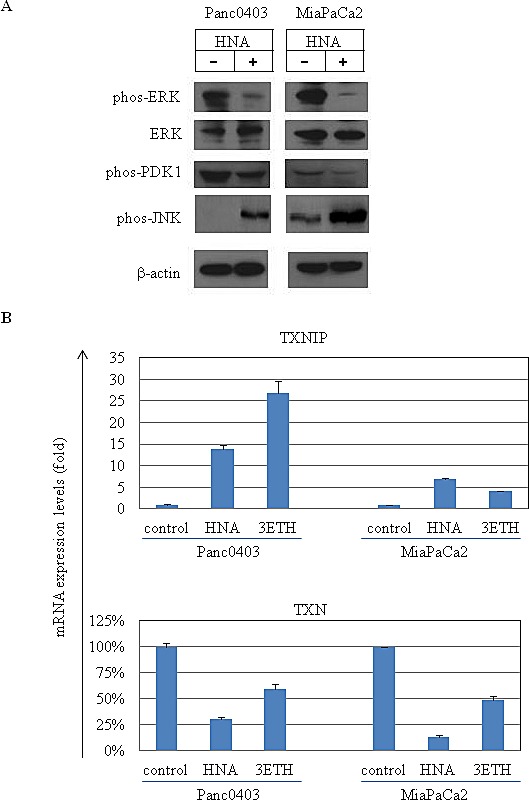
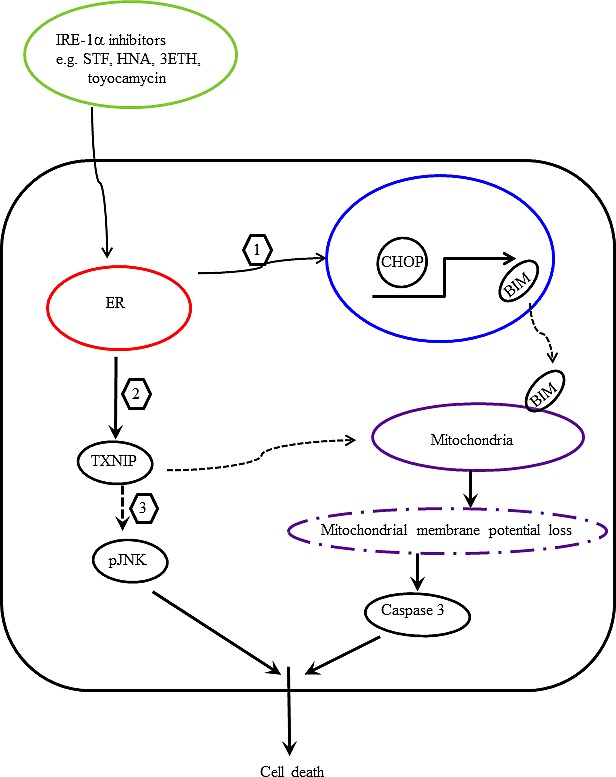
Endoplasmic reticulum stress from unfolded proteins is associated with the proliferation of pancreatic tumor cells, making the many regulatory molecules of this pathway appealing targets for therapy. The objective of our study was to assess potential therapeutic efficacy of inhibitors of unfolded protein response (UPR) in pancreatic cancers focusing on IRE1α inhibitors. IRE1α-mediated XBP-1 mRNA splicing encodes a transcription factor that enhances transcription of chaperone proteins in order to reverse UPR. Proliferation assays using a panel of 14 pancreatic cancer cell lines showed a dose- and time-dependent growth inhibition by IRE1α-specific inhibitors (STF-083010, 2-Hydroxy-1-naphthaldehyde, 3-Ethoxy-5,6-dibromosalicylaldehyde, toyocamycin). Growth inhibition was also noted using a clonogenic growth assay in soft agar, as well as a xenograft in vivo model of pancreatic cancer. Cell cycle analysis showed that these IRE1α inhibitors caused growth arrest at either the G1 or G2/M phases (SU8686, MiaPaCa2) and induced apoptosis (Panc0327, Panc0403). Western blot analysis showed cleavage of caspase 3 and PARP, and prominent induction of the apoptotic molecule BIM. In addition, synergistic effects were found between either STF-083010, 2-Hydroxy-1-naphthaldehyde, 3-Ethoxy-5,6-dibromosalicylaldehyde, or toyocamycin and either gemcitabine or bortezomib. Our data suggest that use of an IRE1α inhibitor is a novel therapeutic approach for treatment of pancreatic cancers.


Figures

Figure 1
Figure 1. Suppression of tunicamycin-induced XBP-1 splicing by IRE1α inhibitors
Three pancreatic cancer cell lines (MiaPaCa2, Panc0403, SU8686) were treated with either (A) STF or (B) HNA at either 10 or 50 μM for 6hr after pre-incubation with tunicamycin (5 μg/ml, 4hr). XBP-1 splicing was detected by PCR as described in the Materials and Methods. Beta-actin was examined as a loading control. Arrow demarks spliced form of XBP-1.
Figure 2
Figure 2. Anti-proliferative activities of IRE1αinhibitors
(A) The effect of STF (50 μM) and HNA (50μM) on the cell growth of 6 pancreatic cancer cell lines compared to diluent treated controls (designated as 100%). Pancreatic cancer cell lines were treated with indicated drugs for 3 days, and cell viability was determined by MTT assays. (B) IC50s of HNA, 3ETH, and toyocamycin were determined using a series of concentrations (1 nM to 100 μM) of these drugs against a panel of pancreatic cancer cell lines using MTT assays. The IC50s were calculated with non-linear regression analysis using GraphPad Prism as described in Materials and Methods. R: Resistant at > 50 uM; n.d.: not done.
Figure 3
Figure 3. Colony formation of pancreatic cancer cells
Pancreatic cancer cell lines (MiaPaCa2, Panc0403) were treated with drugs (toyocamycin [0.5, 1 μM], HNA [10 μM] or 3ETH [1, 10 μM]) for 14 days; and colony formation on plastic (A, C) and soft agar (B, D, E) was assessed. Representative plates are shown. Number of colonies on each plate was calculated with ImageJ; and numbers shown are average of duplicates from two independent experiments.
Figure 4
Figure 4. Effect of 3ETH on growth of BxPc3 human pancreatic cancer xenografts in NOD/SCID mice
Two million BxPc3 cells were subcutaneously injected, and drug treatment was started at day 4. 3ETH was injected intraperitoneally three times a week for 4 weeks. Tumors were harvested and weights were measured. Top panel: tumors; Bottom panel: weights.
Figure 5
Figure 5. IRE1α inhibitor STF and proteasome inhibitor bortezomib synergistically inhibited the in vitro proliferation of pancreatic cancer cells
(A) Four pancreatic cancer cell lines (Panc0403, Panc1005, BxPc3, MiaPaCa2) were cultured at different concentrations of drugs, and cell viability was measure by MTT assays. Drugs used were bortezomib (B10, B50: bortezomib 10, 50 nM) and STF (S10, S50: STF 10, 50 μM). (B) Isobologram analysis of combination of STF with Bortezomib from A (Panel B, top). CalcuSyn software was used to produce normalized isobolograms; and values below threshold line indicate synergistic combination; gray shaded boxes indicate non-synergistic combination (CI > 1) (Panel B, bottom).
Figure 6
Figure 6. Combination index plot of HNA and toyocamycin with four different drugs (bortezomib, 17-DMAG, gemcitabine, dasatinib)
Three pancreatic cancer cell lines (Panc0403, SU8686, MiaPaCa2) were incubated with drugs for 48h at concentrations indicated in Figure. Combination index (CI) plots were calculated with Calcusyn software as described in Materials and Methods. CI <1 indicates synergism between two drugs. Fa: the fraction that is affected or inhibited. B: bortezomib; 17: 17-DMAG; G: gemcitabine; D: dasatinib.
Figure 7
Figure 7. Synergistic effect when cultured in hypoxia
Two pancreatic cancer cell lines (AsPc1, MiaPaCa2) were cultured in either normoxic (21% O2) or hypoxic (2% O2) conditions with different drug combinations for 48 hr. (A) Cell viability was measured by MTT assays. Drugs tested were bortezomib (B1: 1.6 nM; B2: 16 nM; B3: 166 nM) and toyocamycin (T1: 25 nM; T2: 250 nM; T3: 2500 nM). (B) Combination index (CI) was calculated as described in Materials and Methods. CI <1 indicates synergism between two drugs. Fa: affected fraction. Data point 1: 1.6 nM bortezomib, 25 nM toyocamycin); Data point 2: 16 nM bortezomib, 250 nM toyocamycin.
Figure 8
Figure 8. Cell cycle analysis
Three pancreatic cancer cell lines (Panc0403, MiaPaCa2, Panc0327) were treated with HNA for 24 h; and DNA fractions were then analysed with flow cytometry. Cell cycle was fitted with Dean-Jett-Fox model in FlowJo as described in Materials and Methods. For each cell line, representative results from three independent experiments are shown.
Figure 9
Figure 9. Mitochondrial membrane depolarization induced by HNA
(A) Panc0403 pancreatic cancer cells were treated with HNA at 0.1, 1, 10 uM for 24 hr, and mitochondrial membrane potential was analysed by TMRE (tetramethyrhodamine ethyl ester percholarte) fluorescence. Histograms show the amount of TMRE sequestered by mitochondrial membrane. Low TMRE fluorescence (arrow) indicates decreased membrane potential. From the histogram, the portion of cells with low TMRE fluorescence (membrane potential) is summarized in the bar graph. (B) Three pancreatic cancer cell lines (Panc1, Panc0327, Panc0403) were treated with either HNA or toyocamycin at different concentrations for 24 hr and uptake of TMRE fluorescence by the cells was detected by a fluorescent plate reader. Each sample was run in duplicate, and the data represent the mean ± SD of two separate assays.
Figure 10
Figure 10. IRE1α inhibitor treatment: Apoptosis-related proteins in pancreatic cancer cells
(A) Western blot analysis of apoptosis-related proteins in 2 pancreatic cancer cell lines (Panc0403, MiaPaCa2) after treatment with either HNA (10 μM) or toyocamycin (1 μM) for 24h. Beta-actin was loading control. Representative blots were from two independent experiments. (B) MTT assays of pancreatic cancer cell growth after knockdown of BIM. Two clones of pancreatic cancer cell lines stably infected with shRNA targeting BIM (shBIM1, shBIM2) were treated with HNA (1, 10 uM) for 48hr, and MTT assays was used to compared cell viability in experimental (shBIM1, shBIM2) versus scrambled shRNA control (shCON). *: p = 0.038 (left panel). Percent knock-down of BIM by shBIM1 and shBIM2 is shown on right panel.
Figure 11
Figure 11. Effect of STF or HNA on expression of UPR target genes in pancreatic cancer cells
Messenger RNA expression levels of (A) CHOP (B) DNAJB9 (C) ATF4 were examined by real-time PCR in four pancreatic cancer cells (MiaPaCa2, Panc0403, SU8686, AsPc1) after treatment with either STF or HNA (10 or 50 μM, 6hr). Tuni: tunicamycin (5 μg, 4 h) was added as a pre-treatment. Results are means ± SD of two independent experiments done in triplicates.
Figure 12
Figure 12. Protein and RNA expression profiles of pancreatic cancer cell lines after treatment with HNA and 3ETH
(A) Western blot analysis of 2 pancreatic cancer cell lines treated with HNA (10 μM, 24hr). Antibodies used were phos-Erk (phosphorylated Erk), total Erk, phos-PDK and phos-pJNK. Beta-actin served as loading control. (B) Expression levels of TXNIP (thioredoxin binding protein) and TXN (thioredoxin) mRNA in Panc0403 and MiaCaPa2 cells after HNA and 3ETH treatment (1 μM, 24hr) by real-time PCR. Results are mean ± SD of two independent experiments done in triplicates.
Figure 13
Figure 13. Proposed scheme of IRE1 α-induced pancreatic cancer cell death
Treatment of pancreatic cancer cells with IRE1α inhibitors enhances ER stress and (1) activates CHOP transcription, which in turn transactivates BIM. Translocation of BIM to mitochondria enhances apopotosis. (2) Modulation of ROS by ER stress up-regulates TXNIP, which causes loss of mitochondrial membrane potential and activates caspase 3 and apoptosis. (3) In addition, TXNIP activates JNK phosphorylation and promotes apoptosis.

References

    1. Siegel R, Naishadham D, Jemal A. Cancer statistics, 2013. CA: A Cancer Journal for Clinicians. 2013;63(1):11–30. - PubMed
    1. Erkan M R-EC, Michalski CW, Kong B, Esposito I, Friess H, Kleeff J. The Impact of the Activated Stroma on Pancreatic Ductal Adenocarcinoma Biology and Therapy Resistance. Current Molecular Medicine. 2012;12(3):16. - PubMed
    1. Di Marco M, Di Cicilia R, Macchini M, Nobili E, Vecchiarelli S, Brandi G, Biasco G. Metastatic pancreatic cancer: Is gemcitabine still the best standard treatment? (Review) Oncology Reports. 2010;23(5):10. - PubMed
    1. Burris H SA. Assessing clinical benefit in the treatment of pancreas cancer: gemcitabine compared to 5-fluorouracil. Eur J Cancer. 1997;33(Suppl 1):5. - PubMed
    1. Michaelson MD, Zhu AX, Ryan DP, McDermott DF, Shapiro GI, Tye L, Chen I, Stephenson P, Patyna S, Ruiz-Garcia A, Schwarzberg AB. Sunitinib in combination with gemcitabine for advanced solid tumours: a phase I dose-finding study. Br J Cancer. 2013;108(7):1393–1401. - PMC - PubMed

Publication types

MeSH terms

Substances