. 2014 Aug 30;5(16):6633-46.
doi: 10.18632/oncotarget.1955.

ADAM10 mediates trastuzumab resistance and is correlated with survival in HER2 positive breast cancer

Affiliations

ADAM10 mediates trastuzumab resistance and is correlated with survival in HER2 positive breast cancer

Katharina Feldinger et al. Oncotarget. .

Abstract

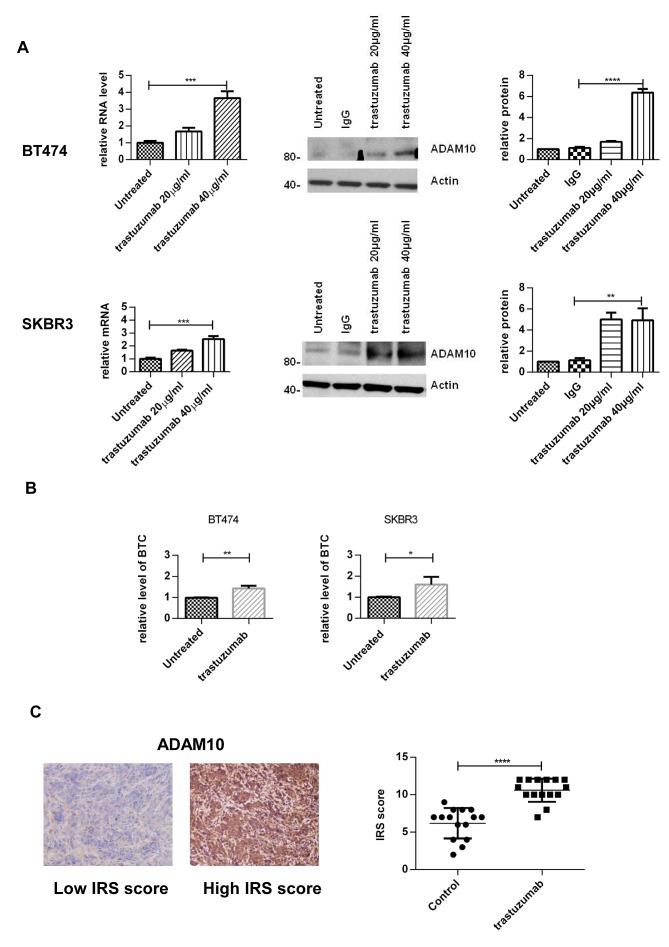
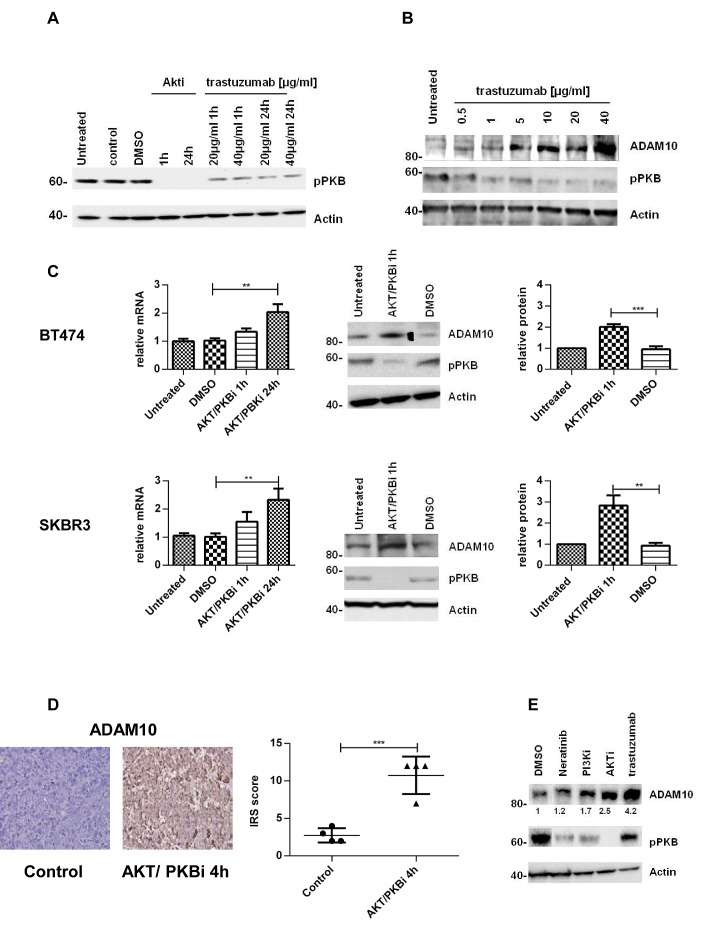
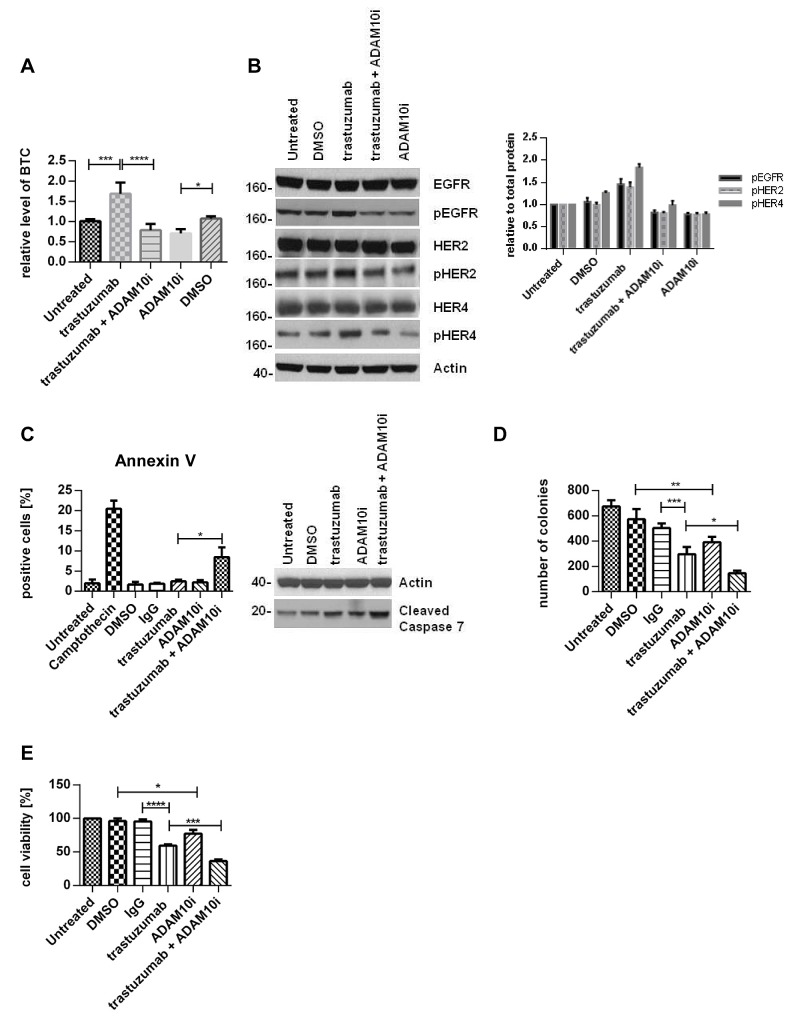
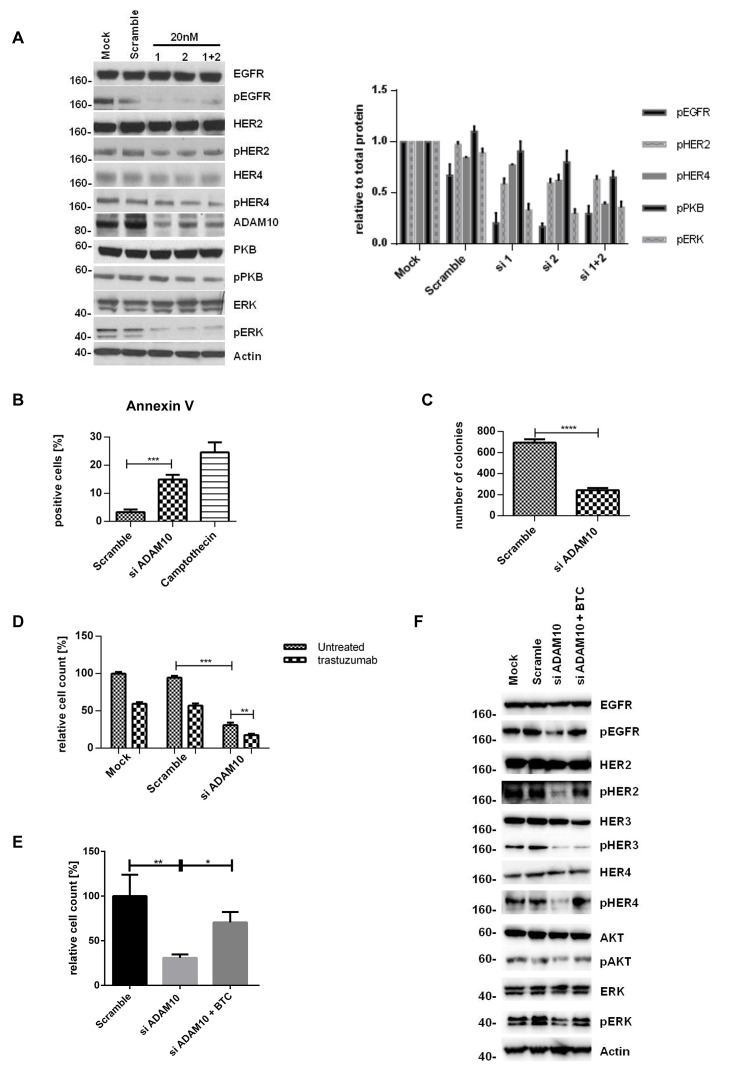
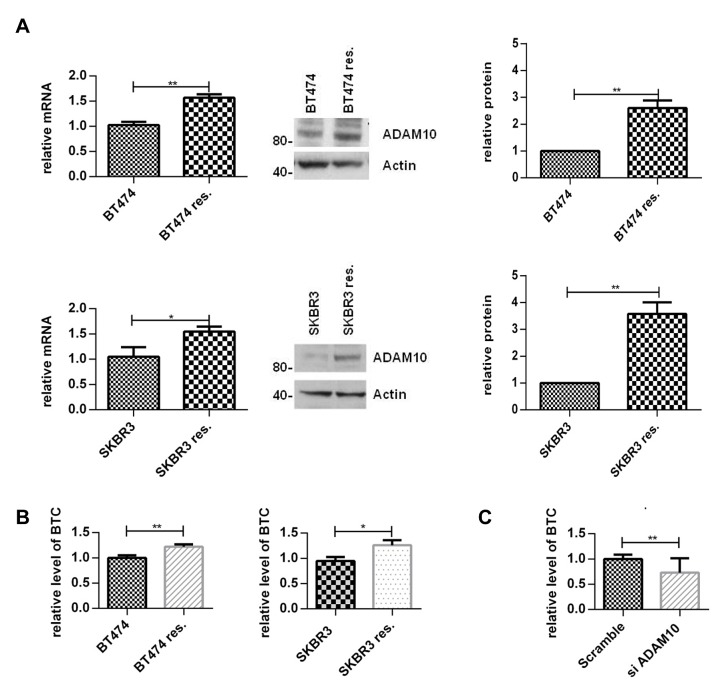
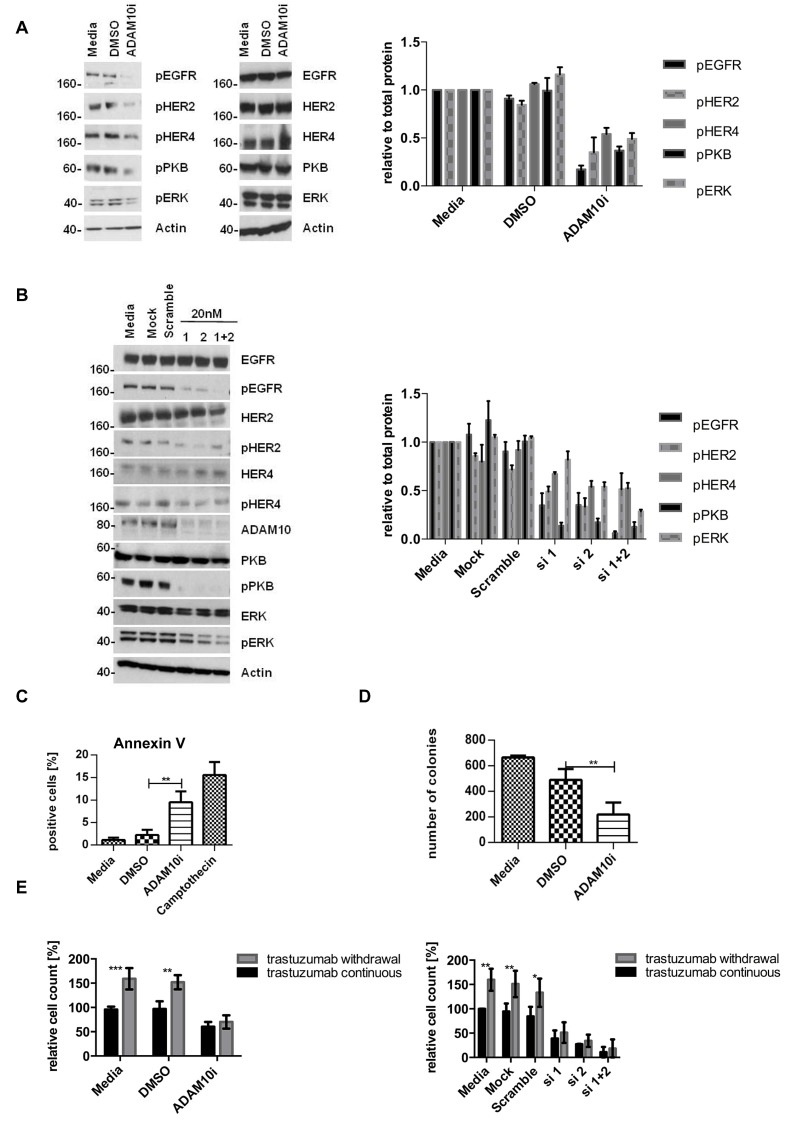
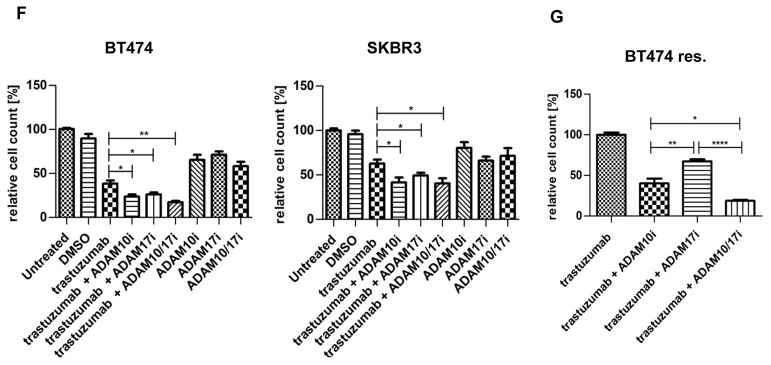
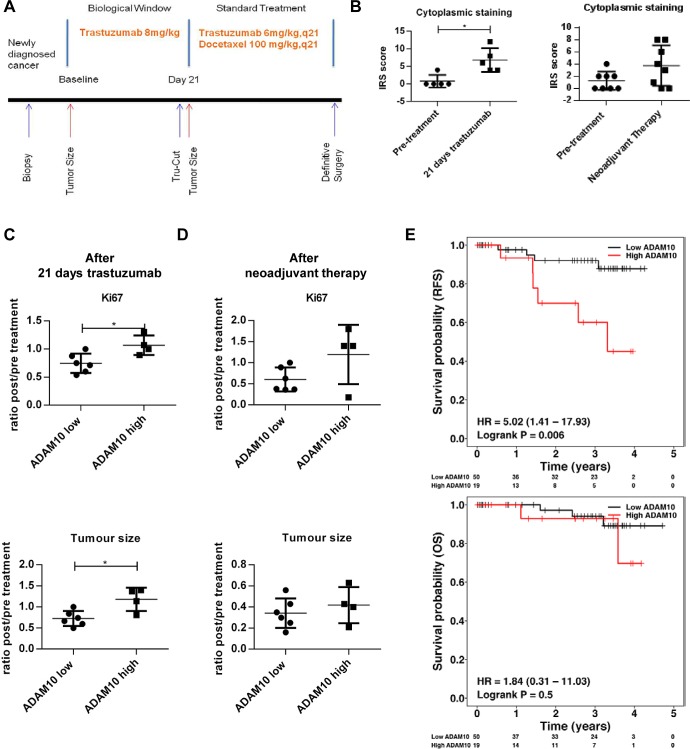
Trastuzumab prolongs survival in HER2 positive breast cancer patients. However, resistance remains a challenge. We have previously shown that ADAM17 plays a key role in maintaining HER2 phosphorylation during trastuzumab treatment. Beside ADAM17, ADAM10 is the other well characterized ADAM protease responsible for HER ligand shedding. Therefore, we studied the role of ADAM10 in relation to trastuzumab treatment and resistance in HER2 positive breast cancer. ADAM10 expression was assessed in HER2 positive breast cancer cell lines and xenograft mice treated with trastuzumab. Trastuzumab treatment increased ADAM10 levels in HER2 positive breast cancer cells (p ≤ 0.001 in BT474; p ≤ 0.01 in SKBR3) and in vivo (p ≤ 0.0001) compared to control, correlating with a decrease in PKB phosphorylation. ADAM10 inhibition or knockdown enhanced trastuzumab response in naïve and trastuzumab resistant breast cancer cells. Trastuzumab monotherapy upregulated ADAM10 (p ≤ 0.05); and higher pre-treatment ADAM10 levels correlated with decreased clinical response (p ≤ 0.05) at day 21 in HER2 positive breast cancer patients undergoing a trastuzumab treatment window study. Higher ADAM10 levels correlated with poorer relapse-free survival (p ≤ 0.01) in a cohort of HER2 positive breast cancer patients. Our studies implicate a role of ADAM10 in acquired resistance to trastuzumab and establish ADAM10 as a therapeutic target and a potential biomarker for HER2 positive breast cancer patients.


Conflict of interest statement

Competing interests

The authors have declared that no competing interests exist.

Figures

Figure 1
Figure 1. Treatment with trastuzumab leads to an increase of ADAM10 levels in vitro and in vivo
(A) BT474 and SKBR3 cells were treated for 24h with the indicated doses of trastuzumab before ADAM10 mRNA and protein levels were assessed. The relative protein levels from the semi-quantification of three western blots are shown. (B) BT474 and SKBR3 cells were treated with 40μg/ml trastuzumab in serum-free media and betacellulin levels in the media were assessed in triplicate using ELISA after 24h. (C) Paraffin-embedded tumor slides from xenograft mice bearing BT474 tumors treated with trastuzumab (50 mg/kg loading dose and 25 mg/kg maintenance dose administered intraperitoneally twice a week) or saline (control) for a total of 5 doses [30] were stained for ADAM10 expression by IHC before being scored using IRS. Graphs show means ± SD.
Figure 2
Figure 2. The upregulation of ADAM10 is correlated with AKT inhibition in vitro and in vivo
(A) SKBR3 cells were treated with an allosteric AKT/PKB inhibitor (2.5μM) or trastuzumab for the indicated durations and (B) with increasing doses of trastuzumab for 24h before western blotting. (C) BT474 and SKBR3 cells were treated with an AKT/PKB inhibitor (2.5μM) before ADAM10 mRNA and protein levels were assessed. The relative protein levels from the semi-quantification of three western blots are shown. (D) Paraffin-embedded tumor slides from xenograft mice bearing BT474 tumors treated with an AKT/PKB inhibitor (AKTi-1/2, 50mg/kg ip) or control for 4h were stained for ADAM10 expression by IHC and scored using IRS. (E) SKBR3 cells were treated with 1nM neratinib, 200nM PI3K inhibitor, 2.5μM AKT/PKB inhibitor or 40μg/ml trastuzumab for 24h before western blot. Graphs show means ± SD.
Figure 3
Figure 3. ADAM10 inhibition decreases basal and trastuzumab induced HER activation and enhances trastuzumab response
SKBR3 cells were treated with 40μg/ml trastuzumab, 5μM ADAM10 inhibitor INCB8765 (ADAM10i), or their combination in serum-free media as indicated for 24h. (A) Betacellulin levels in the media were assessed in triplicate using ELISA; and (B) cell lysates were used for western blot and quantification of three blots is shown (phosphorylated proteins relative to the respective total proteins). (C) Left, BT474 cells were treated with 40μg/ml trastuzumab, 5μM ADAM10 inhibitor INCB8765 (ADAM10i), or their combination for 5 days in serum-reduced media. Camptothecin (6μM) was used as positive control. Cells were stained for Annexin V and the percentage of positive cells was assessed by FACS analysis. Right, BT474 cells were treated as indicated in serum-reduced media for 72h before western blot. (D) SKBR3 cells were treated as in (C) before cells were re-plated in duplicate and left for colony-formation for 12 days. Cells were then stained and counted. (E) SKBR3 cells were seeded in triplicate and treated as in (C) before MTT assay analysis. Graphs show means ± SD.
Figure 4
Figure 4. ADAM10 knockdown decreases cell viability and enhances trastuzumab response by inhibiting the activation of HER receptors
(A) In SKBR3 cells, ADAM10 was knocked down using two siRNAs (20nM) or their combination before western blotting after 72h. Quantification of three blots is shown (phosphorylated proteins relative to the respective total proteins). (B) BT474 cells were transfected with 20nM of siRNA against ADAM10 for 72h and camptothecin (6μM) was used as positive control. Cells were stained for Annexin V and the percentage of positive cells was assessed by FACS analysis. (C) SKBR3 cells were transfected as in (B) before cells were re-plated in duplicate and left for colony-formation for 12 days. (D) In cell counting assays, SKBR3 cells transfected as in (B) were seeded in triplicate and treated the next day with 40μg/ml trastuzumab as indicated for 5 days. (E) In SKBR3 cells, ADAM10 was knocked down and the cells were co-stimulated with 50ng/ml betacellulin as indicated for 5 days before cell counting experiments (left) or for 72h before western blot analysis for the indicated proteins (F). Graphs show means ± SD.
Figure 5
Figure 5. ADAM10 and betacellulin levels are increased in acquired trastuzumab resistant cells compared to naïve cells
Resistant cells were continuously treated with 40μg/ml trastuzumab. (A) ADAM10 mRNA and protein levels of naïve and acquired trastuzumab resistant BT474 and SKBR3 cells were assessed. A representative blot and the semi-quantification of three blots are shown. (B) The naïve and acquired trastuzumab resistant BT474 and SKBR3 cells were seeded and the media was replaced the next day by serum-free media for 24h before ELISA. (C) ADAM10 was knocked down in resistant SKBR3 cells and the level of betacellulin in the media was measured by ELISA. Graphs show means ± SD.
Figure 6
Figure 6. ADAM10 inhibition or knockdown decreases activation of HER receptors and cell viability in trastuzumab resistant cell lines
All resistant cells were continuously treated with 40μg/ml trastuzumab unless otherwise stated. (A) Resistant SKBR3 cells were treated with 5μM ADAM10 inhibitor INCB8765 (ADAM10i) for 24h in serum-free media or (B) were transfected with 20nM of siRNAs against ADAM10 for 72h before western blotting and quantification of three blots is shown next to the respective blot (phosphorylated proteins relative to the respective total proteins). (C) For FACS analysis, resistant BT474 cells were treated with 5μM ADAM10 inhibitor INCB8765 (ADAM10i) in serum-reduced media for 5 days. Camptothecin (6μM) was used as positive control. Cells were stained for Annexin V and percentage of positive cells analysed by FACS. (D) For the clonogenic assay, resistant SKBR3 cells were treated as in (C) and re-plated in duplicate for colony-formation for 12 days. (E) For cell counting studies, trastuzumab was withdrawn overnight from resistant SKBR3 cell lines. For the “withdrawal group”, trastuzumab remained withdrawn whereas the “continuous group” was co-treated with 40μg/ml trastuzumab. Both groups were treated in as in (C), or were transfected with 20nM of specific siRNAs against ADAM10 for 5 days (right panel). (F) BT474 and SKBR3 cells were treated in triplicate with 40μg/ml trastuzumab, 5μM of the ADAM10 inhibitor INCB8765 (ADAM10i), the ADAM17 inhibitor INCB4298 (ADAM17i), the ADAM10/17 inhibitor INCB3619 (ADAM10/17i), or their combination for 5 days before cell counting. (G) BT474 resistant cells were treated as in (F) with continuous 40μg/ml trastuzumab for 5 days before cell counting. Graphs represent data from three independent experiments and show means ± SD.
Figure 7
Figure 7. ADAM10 level is a predictive biomarker for trastuzumab response and is prognostic in a cohort of HER2 positive breast cancer patients
(A) Schematic illustration of the window of opportunity study. HER2 positive breast cancer patients received a pre-treatment biopsy and underwent a 21 day trastuzumab (8mg/kg) monotherapy window study before a second biopsy was performed. Patients further received 4 cycles of neoadjuvant docetaxel chemotherapy 100 mg/m2 with 6mg/kg trastuzumab q21 prior to definitive surgery. (B) Paired tissue samples (pre- and post-treatment) from 5 patients who received trastuzumab monotherapy for 21 days (as described in A) and from 8 patients (of whom samples of pre- and post-neoadjuvant treatment were available) were stained for ADAM10 expression. (C) and (D) Basal ADAM10 expression levels (low or high) of a total of 10 patients (of whom basal biopsies and clinical data were available) were correlated with Ki67 staining and tumor size at day 21 and at definitive surgery (ratios between post trastuzumab or neoadjuvant treatment vs. pre-treatment). Bar graphs show means ± SD, the differences were assessed by t-Test and a p-value is shown (*p≤0.05). (E) Tissue microarrays (TMAs) consisting of tumor core samples from a well annotated HER2 positive breast cancer cohort were stained for basal ADAM10 expression by IHC. Relapse-free survival and overall survival of patients were plotted according to high or low ADAM10 IRS scores and differences between the groups were assessed using Log-rank test.

Comment in

Similar articles

Cited by

References

    1. Linggi B, Carpenter G. ErbB receptors: new insights on mechanisms and biology. Trends Cell Biol. 2006;16:649–56. - PubMed
    1. Li SQ, Schmitz KR, Jeffrey PD, Wiltzius JJW, Kussie P, Ferguson KM. Structural basis for inhibition of the epidermal growth factor receptor by cetuximab. Cancer Cell. 2005;7:301–11. - PubMed
    1. Zhang X, Gureasko J, Shen K, Cole PA, Kuriyan J. An allosteric mechanism for activation of the kinase domain of epidermal growth factor receptor. Cell. 2006;125:1137–49. - PubMed
    1. Vivanco I, Sawyers CL. The phosphatidylinositol 3-Kinase AKT pathway in human cancer. Nat Rev Cancer. 2002;2:489–501. - PubMed
    1. Baselga J, Swain SM. Novel anticancer targets: revisiting ERBB2 and discovering ERBB3. Nat Rev Cancer. 2009;9:463–75. - PubMed

Publication types

MeSH terms