. 2014 Jul;32(7):644-52.
doi: 10.1038/nbt.2940. Epub 2014 Jun 22.

Assessing the clinical utility of cancer genomic and proteomic data across tumor types

Affiliations

Assessing the clinical utility of cancer genomic and proteomic data across tumor types

Yuan Yuan et al. Nat Biotechnol. 2014 Jul.

Abstract

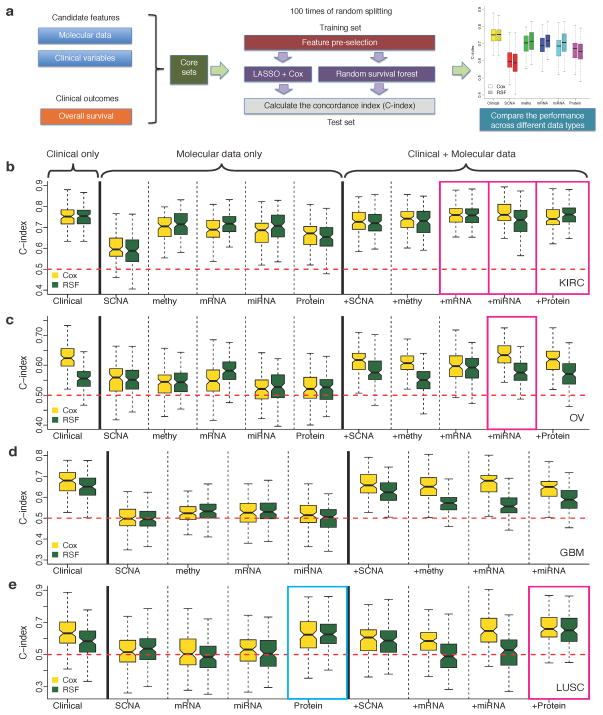
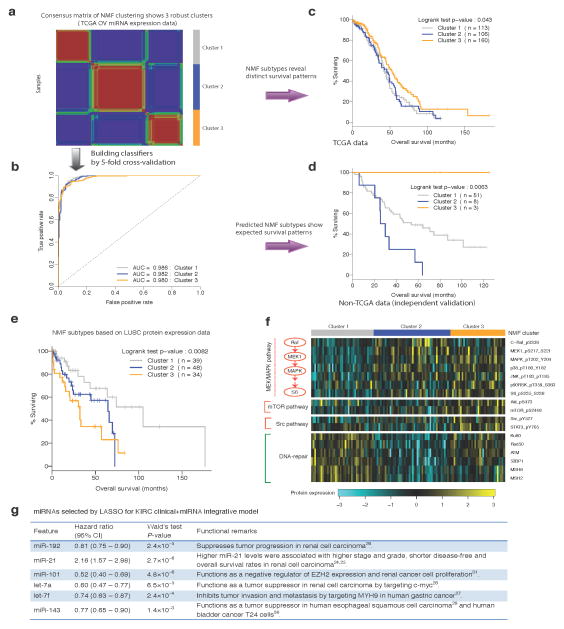
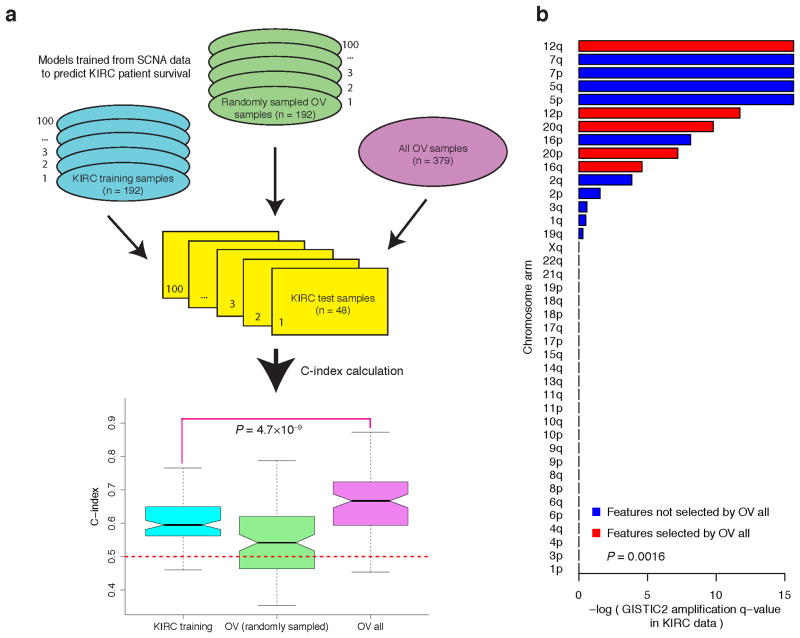
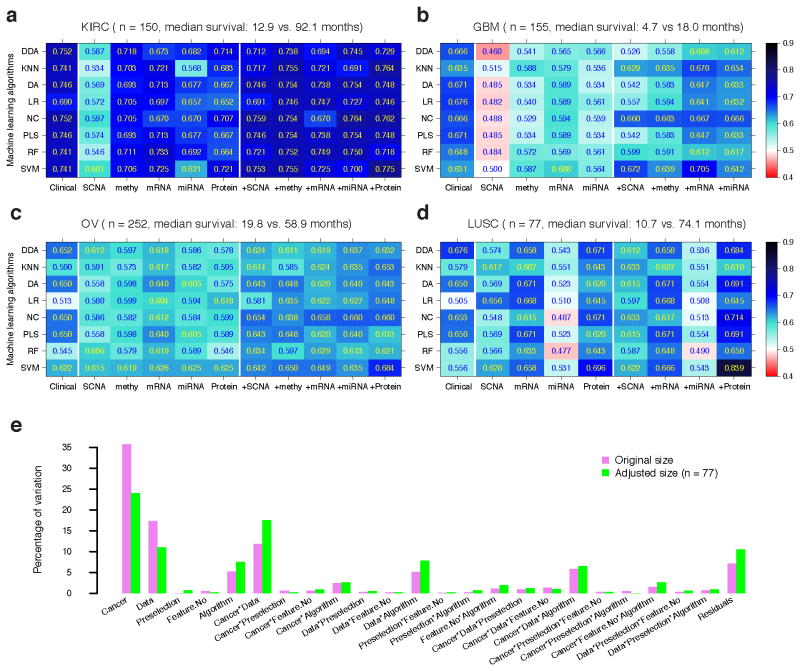
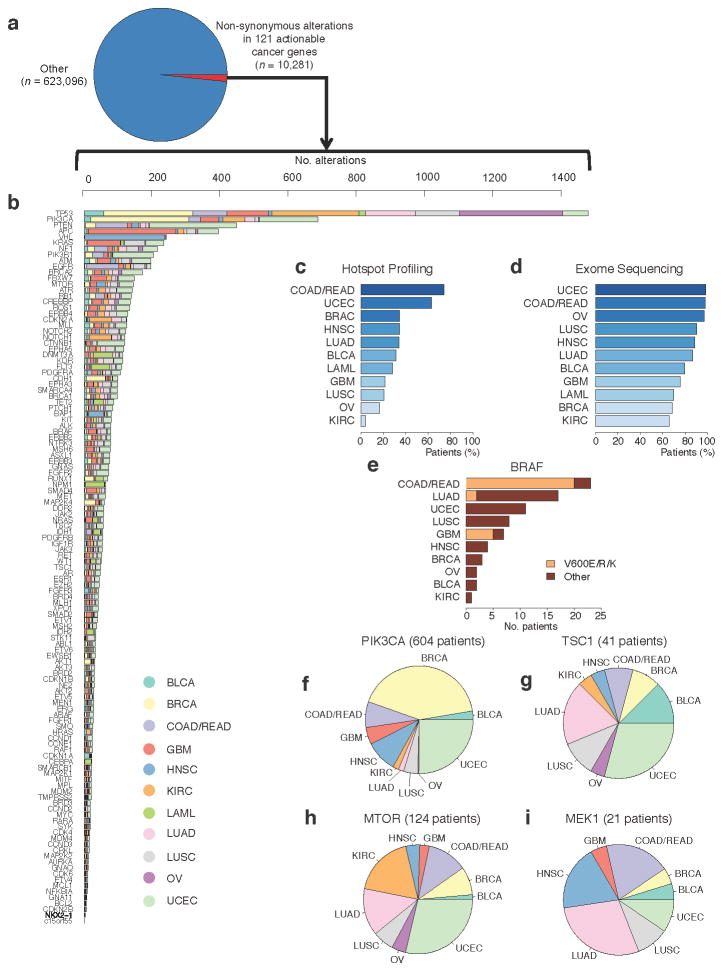
Molecular profiling of tumors promises to advance the clinical management of cancer, but the benefits of integrating molecular data with traditional clinical variables have not been systematically studied. Here we retrospectively predict patient survival using diverse molecular data (somatic copy-number alteration, DNA methylation and mRNA, microRNA and protein expression) from 953 samples of four cancer types from The Cancer Genome Atlas project. We find that incorporating molecular data with clinical variables yields statistically significantly improved predictions (FDR < 0.05) for three cancers but those quantitative gains were limited (2.2-23.9%). Additional analyses revealed little predictive power across tumor types except for one case. In clinically relevant genes, we identified 10,281 somatic alterations across 12 cancer types in 2,928 of 3,277 patients (89.4%), many of which would not be revealed in single-tumor analyses. Our study provides a starting point and resources, including an open-access model evaluation platform, for building reliable prognostic and therapeutic strategies that incorporate molecular data.


Conflict of interest statement

The authors declare no competing interests.

Figures

Figure 1
Figure 1. Comparison of the survival predictive power of clinical variables, molecular data and their combinations
(a) An overview of the computational approach. (b)–(e) C-indexes by models trained from clinical variables, individual molecular data alone or in combination with clinical variables in (b) KIRC (Ntotal = 243), (c) OV(Ntotal = 379), (d) GBM (Ntotal = 210) and (e) LUSC (Ntotal = 121). For each cancer type, during each of the 100 times of random splitting, 80% of the total samples were used to train the model and the remaining 20% as the test set for C-index calculations. The blue box highlights the model built from individual molecular data that shows comparable performance to that based on clinical variables (two-sided Wilcoxon signed rank test, P > 0.05); and the magenta boxes highlight the models integrating molecular data and clinical variables that show better performance than that based on only clinical variables (two-sided Wilcoxon signed rank test, FDR < 0.01).
Figure 2
Figure 2. Biological insights from the top prognostic models
(a) Consensus nonnegative matrix factorization (NMF) clustering of the TCGA OV miRNA expression data reveals three molecular subtypes (clusters). (b) The ROC curves of the multiclass classifier against NMF subtypes trained from the TCGA OV miRNA expression data through five-fold cross-validation. (c) The Kaplan-Meier plot of the patients from the TCGA OV core set stratified by OV miRNA-expression NMF subtypes. (d) The Kaplan-Meier plot of the patients from the independent OV cohort stratified by predicted miRNA NMF subtypes using the classifier in (b). (e) The Kaplan-Meier plot of the patients from the LUSC core set stratified by LUSC protein-expression NMF subtypes. (f) The top differentially expressed protein markers among LUSC protein-expression NMF subtypes grouped by pathways/functions. (g) The miRNAs selected by LASSO for the KIRC clinical + miRNA integrative model.
Figure 3
Figure 3. Models trained from OV SCNA data can predict survival of individuals with KIRC
(a) From left to right: C-index for the models trained from KIRC SCNA data (Ntraining= 192), C-index for the models trained from SCNA of OV sample sets with the same size as the KIRC training sets (Ntraining = 192), and C-index for the model trained from SCNA of the whole OV core set (Ntraining = 379). The OV model trained from the whole OV core set showed higher predictive power than the model trained from SCNA data of independent KIRC training samples (two-sided Wilcoxon signed rank test, P = 4.7 × 10⁻⁹). (b) The bar plot of amplification Q-value of arm-level SCNA features from GISTIC2. The features included in the model trained from OV SCNA data are shown in red. The KIRC q-values of the features selected from OV SCNA data were lower than those not selected (two-sided Wilcoxon rank sum test, P = 1.6 × 10⁻³).
Figure 4
Figure 4. Predictive performance of clinical variables, molecular data and their combination on dichotomized survival data
The best AUC achieved by each classification algorithm for each clinical/molecular/combination dataset in (a) KIRC (Ntotal = 150), (b) GBM (Ntotal = 155), (c) OV (Ntotal = 252) and (d) LUSC (Ntotal = 77). (e) Variation explained by modeling factors and their interactions. Abbreviations for classification algorithms: diagonal discriminant analysis (DDA), K-nearest neighbor (KNN), discriminant analysis (DA), logistic regression (LR), nearest centroid (NC), partial least square (PLS), random forest (RF) and support vector machine (SVM). AUCs were calculated based on 10-fold cross-validation.
Figure 5
Figure 5. Alterations in clinically relevant genes across 12 tumor types
(a)–(b) Examination of mutations and indels in 3,277 patients representing 12 tumor types reveals a long tail of the frequency distribution of alterations in clinically relevant genes that warrant further exploration across 12 tumor types. Expanding tumor profiling beyond hotspot profiling technologies (c) to whole exome sequencing (d) increases the percentage of patients in all tumor types that may harbor clinically relevant alterations. (e) Hotspot alterations in known cancer genes occur at low frequencies in unexpected tumor types. (f)–(i) Alterations in emerging genes with potential clinical relevance are observed across tumor types. For a key to the tumor types, see Supplementary Table 4.

Similar articles

Cited by

References

    1. Cancer Genome Atlas Research Network. Comprehensive genomic characterization defines human glioblastoma genes and core pathways. Nature. 2008;455:1061–1068. - PMC - PubMed
    1. Cancer Genome Atlas Research Network. Integrated genomic analyses of ovarian carcinoma. Nature. 2011;474:609–615. - PMC - PubMed
    1. Cancer Genome Atlas Research Network. Comprehensive molecular characterization of human colon and rectal cancer. Nature. 2012;487:330–337. - PMC - PubMed
    1. Cancer Genome Atlas Research Network. Comprehensive genomic characterization of squamous cell lung cancers. Nature. 2012;489:519–525. - PMC - PubMed
    1. Cancer Genome Atlas Research Network. Integrated genomic characterization of endometrial carcinoma. Nature. 2013;497:67–73. - PMC - PubMed

Publication types