. 2014 Aug;11(8):868-74.
doi: 10.1038/nmeth.2997. Epub 2014 Jun 22.

Annotation of loci from genome-wide association studies using tissue-specific quantitative interaction proteomics

Affiliations

Annotation of loci from genome-wide association studies using tissue-specific quantitative interaction proteomics

Alicia Lundby et al. Nat Methods. 2014 Aug.

Abstract

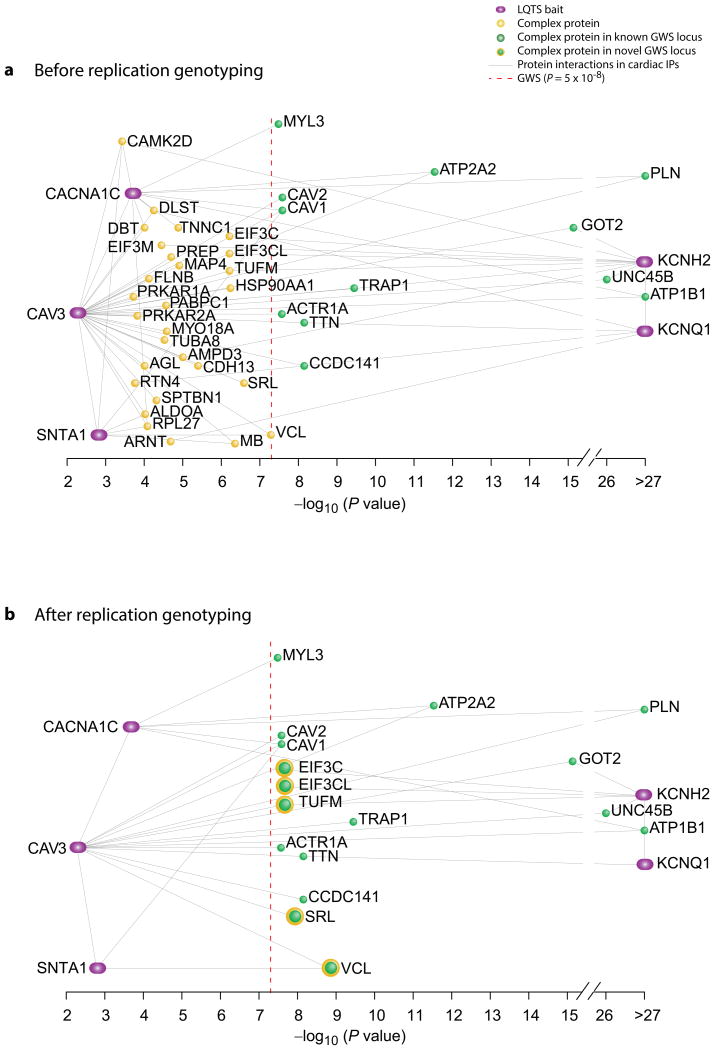
Genome-wide association studies (GWAS) have identified thousands of loci associated with complex traits, but it is challenging to pinpoint causal genes in these loci and to exploit subtle association signals. We used tissue-specific quantitative interaction proteomics to map a network of five genes involved in the Mendelian disorder long QT syndrome (LQTS). We integrated the LQTS network with GWAS loci from the corresponding common complex trait, QT-interval variation, to identify candidate genes that were subsequently confirmed in Xenopus laevis oocytes and zebrafish. We used the LQTS protein network to filter weak GWAS signals by identifying single-nucleotide polymorphisms (SNPs) in proximity to genes in the network supported by strong proteomic evidence. Three SNPs passing this filter reached genome-wide significance after replication genotyping. Overall, we present a general strategy to propose candidates in GWAS loci for functional studies and to systematically filter subtle association signals using tissue-specific quantitative interaction proteomics.


Conflict of interest statement

Financial disclaimer: The authors have no competing interests as defined by Nature Publishing Group or other interests that might be perceived to influence the results and/or discussion reported in this article.

Figures

Figure 1
Figure 1. General design and experimental workflow of our integrated genetic and proteomic study
a) Five of the 12 LQTS genes reside in loci definitely associated with QT interval variation in the general population through GWAS. b) Protein interaction networks for LQTS proteins (purple boxes where physical interactions are shown as black lines) are resolved in cardiac tissue by quantitative interaction proteomics (top). Interaction partners of the LQTS proteins that reside in GWAS loci are identified and functionally validated (green boxes). Other interaction partners supported by strong proteomic evidence (yellow boxes), point to SNPs that can be prioritized for replication genotyping.
Figure 2
Figure 2. Quantitative interaction proteomics of five Mendelian LQTS proteins
a) Hierarchical cluster analysis of proteins identified in immunoprecipitation experiments visualizes the experimental specificity and reproducibility. Proteins are color-coded according to their mass-spectrometry signal intensity. Triplicates of the LQTS protein immunoprecipitations (a-c) are shown. The highlighted yellow areas indicate that each group of triplicate experiments immunoprecipitates a specific cluster of proteins. b) Volcano plots, representing the LQTS protein IPs versus IgG control IPs, show negative logarithmized t-test derived P-values (-log10(P)) as function of logarithmized ratios of average protein intensities (log2) for the LQTS protein relative to control. A hyperbolic curve indicates a false discovery rate cut-off of 0.05 and separates specific from nonspecific interactors. All points represent a protein. Purple indicates a LQTS protein, green represent proteins specifically interacting with the LQTS proteins, and blue represents nonspecific interactors.
Figure 3
Figure 3. Proteomic annotation of GWAS loci coupled to experimental follow up identifies ATP1B1 as a QT variation candidate gene
a) Distribution of association Z-scores for genes represented in the interactomes (grey bars) to a background distribution of all genes in the genome (black line). The x-axis represents Z-scores assigned to genes corrected for SNP density and linkage disequilibrium structure. The insert shows a zoom-in of the tail of the distribution, illustrating that the distribution is significantly enriched for genes at GWS loci (P = 1.3e-6, using random sampling, see Online Methods). b) Representative current traces recorded from KCNH2 (left) and KCNH2 +ATP1B1 (right) proteins heterologously expressed in Xenopus laevis oocytes by two-electrode voltage clamp. Step currents were elicited using the depicted voltage clamp protocol with 1s pulses to test potentials ranging from −80 to +40 mV followed by deactivation (tail) current measurements at −60 mV. c) Current-voltage relationships were constructed by normalizing the steady-state currents measured at the end of each voltage step to the maximum outward current and plotting it as function of the test potential (n = 11 for KCNH2, n = 9 for KCNH2+ATP1B1). d) Channel inactivation kinetics were evaluated from currents elicited from the indicated pulse protocol. Inactivation time constants measured at +60 mV are shown for KCNH2 in absence (n = 10) or presence (n = 14) of ATP1B1. Data points are mean ± SEM. e) Cardiac action potential after Morpholino knockdown of zebrafish atp1b1a (APD80 = 256±20 msec) compared to carrier injected controls (APD80 = 321±21 msec), n = 13 independent samples per condition. * represents P<0.05. f) Superimposed normalized traces are shown for one representative sample for atp1b1a knockdown (red) and control conditions (blue).
Figure 4
Figure 4. Integrative analysis of the LQTS protein network and GWAS data
a) Depiction of the interactions identified in the proteomics experiments between the LQTS proteins (purple) and proteins encoded by genes in genome-wide significant common variant loci (greene) as well as proteins encoded by genes that lie near the 28 SNPs filtered for replication genotyping (yellow). The proteins are plotted according to the best genetic association P-value of their corresponding genes in the horizontal direction after taking the negative 10 based logarithm of the P-value and in this depiction (for visualization purposes) we do not correct the P-value for multiple hypothesis testing and LD in order to preserve the true association score as determined in the GWAS. Interactions are represented by grey lines,. The dashed red line indicates the threshold for GWS (corresponding to a P-value of 5.0e-8). b) An overview of proteins in the LQTS protein network encoded by genes in all 38 loci (green) significantly assocaied to QT variation in this study and in Arking et al.. The five proteins with yellow halos represent the three SNPs that became genome-wide significant after replication genotyping in this study (locus 1, rs7498491: EIF3C, EIF3CL, TUFM; locus 2, rs889807: SRL; locus 3, rs10824026: VCL).

Similar articles

Cited by

References

    1. Morita H, Wu J, Zipes DP. The QT syndromes: long and short. Lancet. 2008;372:750–763. - PubMed
    1. Newton-Cheh C, et al. Common variants at ten loci influence QT interval duration in the QTGEN Study. Nat Genet. 2009;41:399–406. - PMC - PubMed
    1. Pfeufer A, et al. Common variants at ten loci modulate the QT interval duration in the QTSCD Study. Nat Genet. 2009;41:407–414. - PMC - PubMed
    1. Arking DE et al. Genetic association study of QT interval highlights calcium signaling pathways in myocardial repolarization. Accept Nat Genet. 2014 - PMC - PubMed
    1. Curran ME, et al. A molecular basis for cardiac arrhythmia: HERG mutations cause long QT syndrome. Cell. 1995;80:795–803. - PubMed

Publication types