. 2014 Aug;11(8):825-33.
doi: 10.1038/nmeth.3000. Epub 2014 Jun 22.

All-optical electrophysiology in mammalian neurons using engineered microbial rhodopsins

Affiliations

All-optical electrophysiology in mammalian neurons using engineered microbial rhodopsins

Daniel R Hochbaum et al. Nat Methods. 2014 Aug.

Abstract

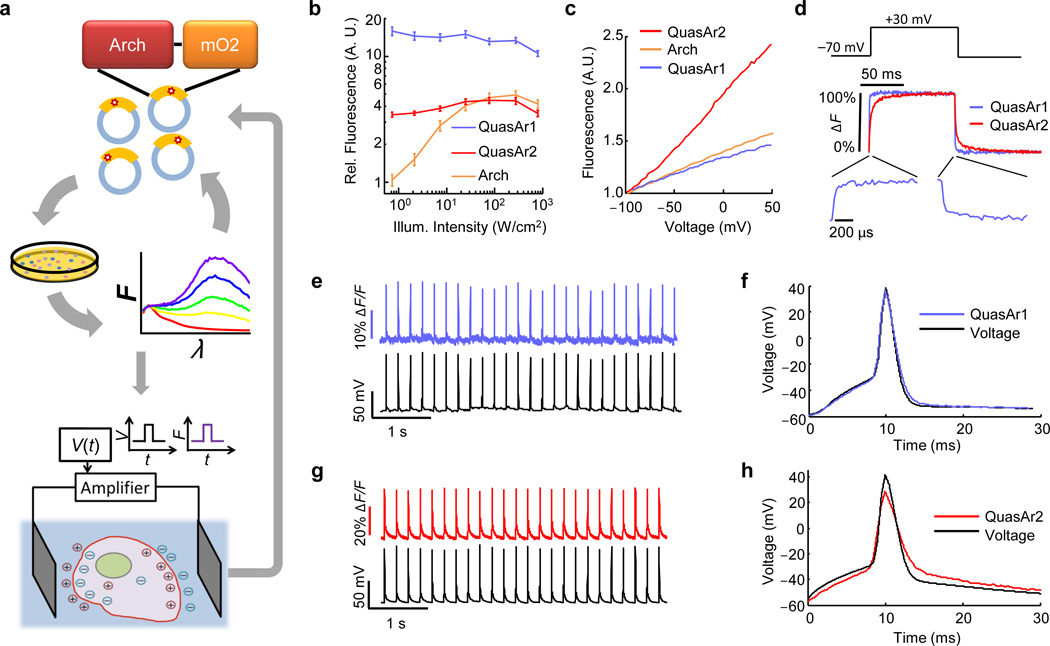
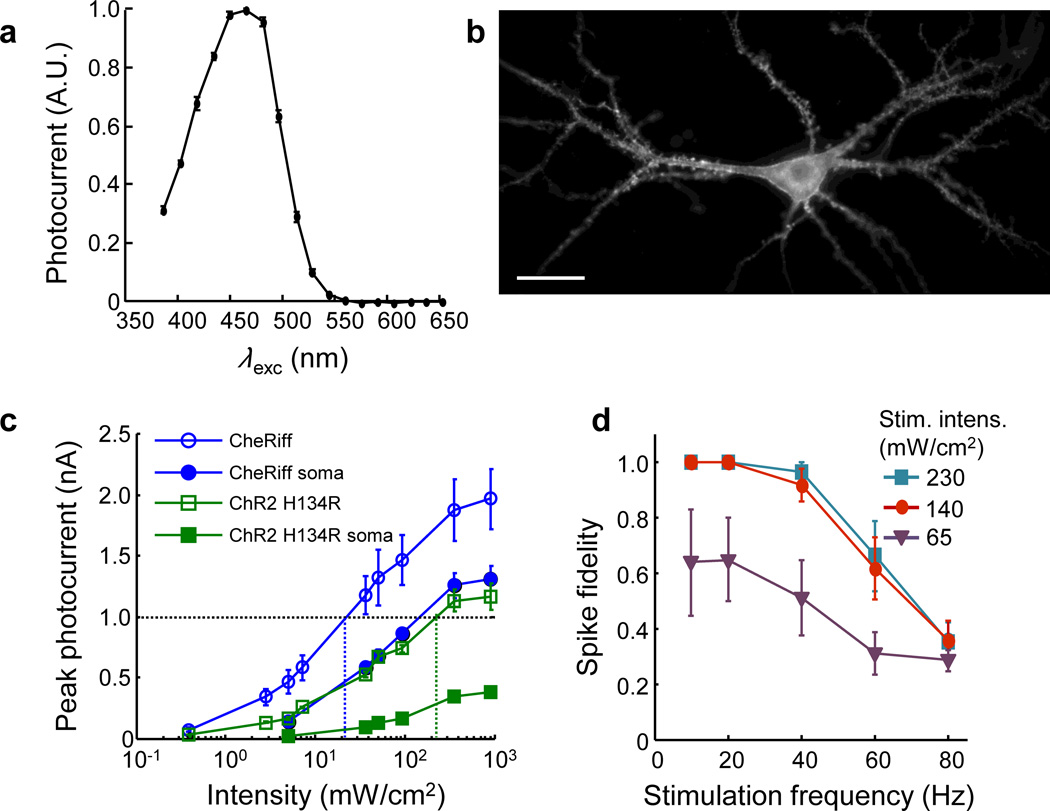
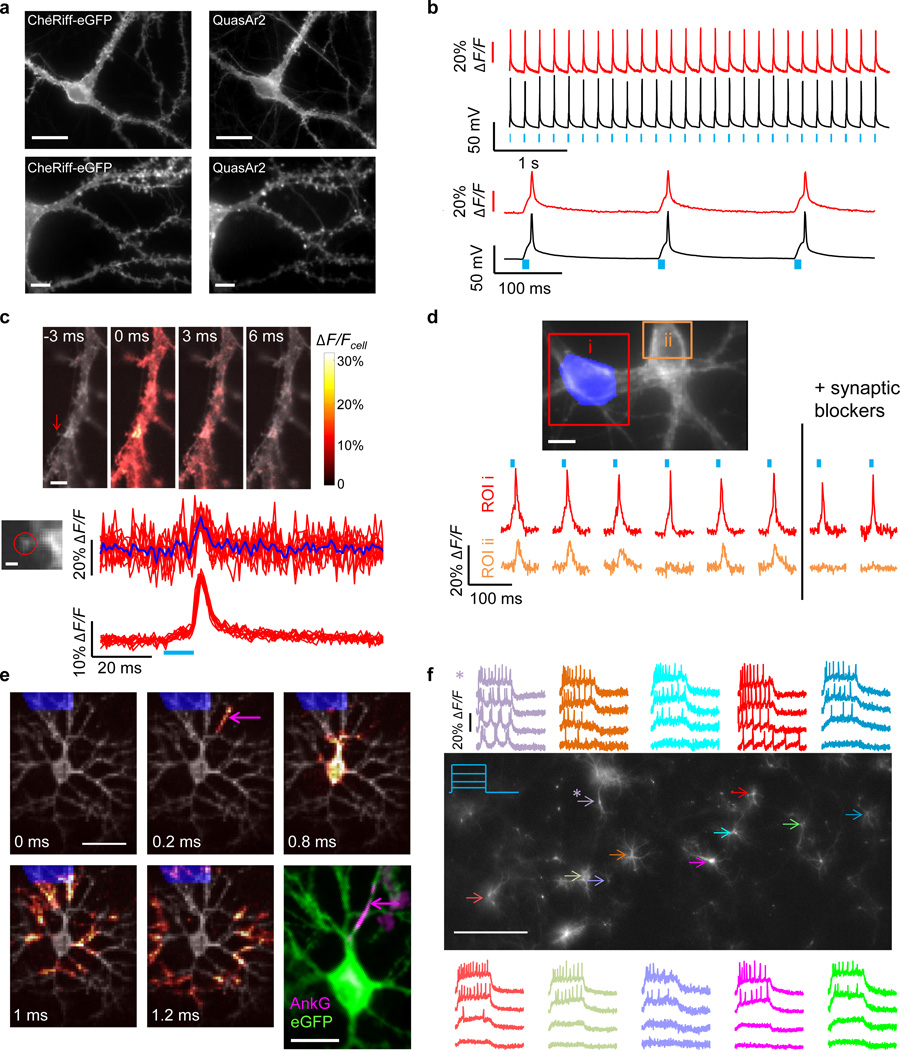
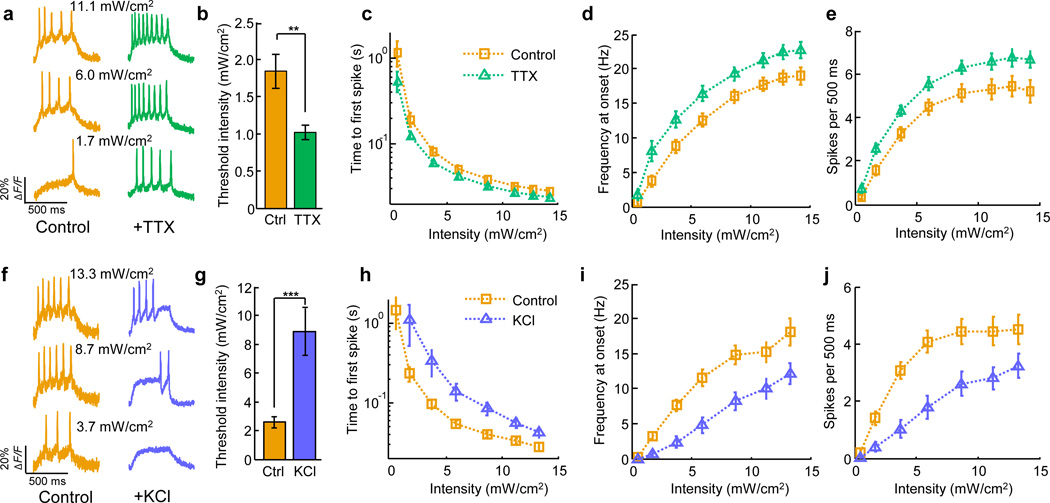
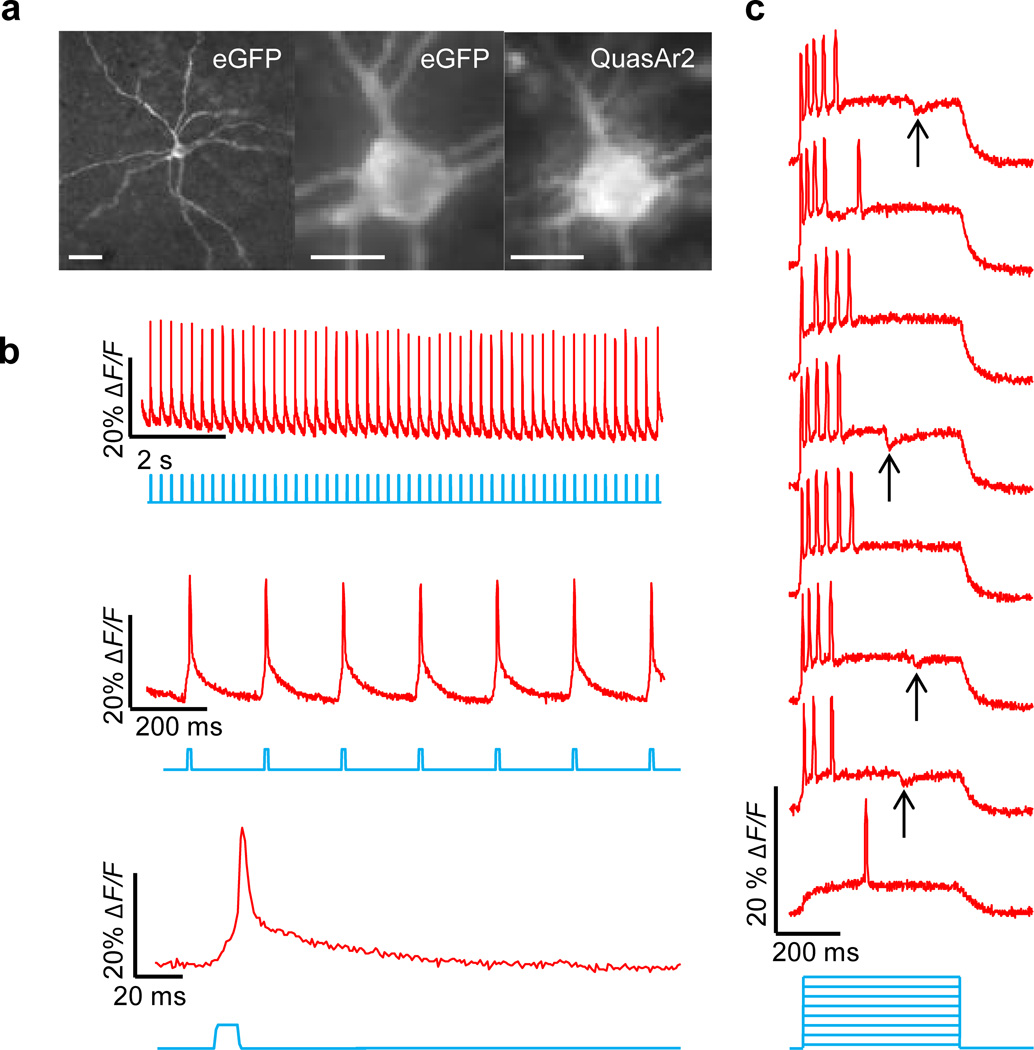
All-optical electrophysiology-spatially resolved simultaneous optical perturbation and measurement of membrane voltage-would open new vistas in neuroscience research. We evolved two archaerhodopsin-based voltage indicators, QuasAr1 and QuasAr2, which show improved brightness and voltage sensitivity, have microsecond response times and produce no photocurrent. We engineered a channelrhodopsin actuator, CheRiff, which shows high light sensitivity and rapid kinetics and is spectrally orthogonal to the QuasArs. A coexpression vector, Optopatch, enabled cross-talk-free genetically targeted all-optical electrophysiology. In cultured rat neurons, we combined Optopatch with patterned optical excitation to probe back-propagating action potentials (APs) in dendritic spines, synaptic transmission, subcellular microsecond-timescale details of AP propagation, and simultaneous firing of many neurons in a network. Optopatch measurements revealed homeostatic tuning of intrinsic excitability in human stem cell-derived neurons. In rat brain slices, Optopatch induced and reported APs and subthreshold events with high signal-to-noise ratios. The Optopatch platform enables high-throughput, spatially resolved electrophysiology without the use of conventional electrodes.


Figures

Figure 1
Figure 1. Non-pumping Arch-derived voltage indicators with improved speed, sensitivity, and brightness
A) Hierarchical screen to select improved Arch mutants. Five rounds of random mutagenesis and screening for brightness were performed in E. coli. The brightest mutants were subjected to targeted mutagenesis and screening for speed and voltage sensitivity in HeLa cells via induced transient voltage (Supplementary Fig. 1). B) Fluorescence of Arch mutants fused to eGFP and expressed in HEK cells, as a function of illumination intensity. The plot shows Arch fluorescence normalized by 640 nm illumination intensity and by eGFP fluorescence (488 nm exc., 525 – 575 nm em.) to control for cell-to-cell variations in expression. A linear fluorophore (i.e. brightness proportional to illumination intensity) would appear as a horizontal line. Error bars represent s.e.m. (n = 7 cells for each mutant). C) Fluorescence vs. membrane voltage for Arch, QuasAr1, and QuasAr2 expressed in HEK cells. D) Fluorescence responses to a step in membrane voltage from −70 to +30 mV. E) Simultaneous optical and electrical recording of APs in a rat hippocampal neuron expressing QuasAr1. Frame rate 1 kHz. F) Overlay of mean optically and electrically recorded AP waveforms. Frame rate 2 kHz. G, H) Same as E, F in neurons expressing QuasAr2. Data in B – H acquired on a 128 × 128 pixel EMCCD camera (Methods).
Figure 2
Figure 2. CheRiff is a fast and sensitive blue-shifted channelrhodopsin
A) Action spectrum acquired in HEK293T cells (n = 6 cells). CheRiff had a blue-shifted action spectrum with a peak at λmax ∼ 460 nm. B) Cultured rat hippocampal neuron expressing CheRiff-eGFP, imaged via eGFP fluorescence. Scale bar 25 µm. Image acquired on an sCMOS detector (Methods). C) Comparison of photocurrents as a function of illumination intensity in matched neuronal cultures expressing CheRiff (n = 5 cells) or ChR2 H134R (n = 5 cells). Illumination was either over the whole cell or confined to the soma. D) Spiking fidelity as a function of stimulation frequency and illumination intensity in neurons expressing CheRiff (n = 5 cells). Cells were stimulated with trains of 40 pulses (2 ms pulse width, 10 to 80 Hz) at three different blue light intensities. Error bars in C and D represent s.e.m.
Figure 3
Figure 3. Optopatch enables high fidelity optical stimulation and recording in cultured neurons
A) Trafficking of Optopatch components in cultured rat hippocampal neurons. Left: CheRiff-eGFP, measured via eGFP fluorescence. Right: QuasAr2, measured via retinal fluorescence. Scale bars: top 20 µm, bottom 5 µm. B) Temporally precise optical initiation and monitoring of single APs. Blue: illumination. Red: whole-cell single-trial unfiltered fluorescence. Black: patch clamp recording. C) Optical mapping of an AP induced via illumination of the soma. Top: Filmstrip showing average of n = 20 temporally registered APs. Fluorescence is normalized to mean fluorescence of the dendrite. Images are composite of mean fluorescence (gray) and changes in fluorescence (heat map). Arrow indicates dendritic spine. Scale bar 5 µm. Bottom: Single-trial detection of back-propagating APs in a single dendritic spine. Scale bar 1 µm. Top traces: ten single-trial recordings from the spine (red) and their average (blue). Bottom traces: ten single-trial recordings from the parent dendrite. D) Synaptic transmission. Optical stimulation of one soma (highlighted in blue) induced single APs in the stimulated cell (i) and EPSPs in the neighboring cell (ii). Synaptic blockers suppressed the response in the postsynaptic cell but not in the presynaptic cell. E) Sub-frame interpolation of AP propagation in a neuron expressing Optopatch1 (Supplementary Movie 4). Scale bar 50 µm. Bottom right: Immunostaining of the same cell with anti-eGFP and anti-AnkyrinG. Scale bar 25 µm. Magenta arrows: site of action potential initiation, distal end of the AIS. F) Parallel optical recording under increasingly strong 0.5 s optical step-stimuli. Asterisk indicates a cell that showed periodic bursts of 3–4 APs under weak stimulation. Scale bar 500 µm. Image is of eGFP fluorescence. Data in (A, C, F) acquired on an sCMOS detector; data in (B, D, E) acquired on an EMCCD (Methods). Detailed protocols for each panel are in Methods.
Figure 4
Figure 4. Homeostatic plasticity of intrinsic excitability in human iPSC-derived neurons probed via Optopatch2
A–E) Positive HPIE. Data from n = 32 control cells and n = 31 TTX-treated cells A) Representative optical recordings from single neurons after incubation in TTX and matched control cells. B) Threshold stimulation intensity (488 nm) to induce at least one spike in 500 ms. TTX treated cells had a significantly lower threshold than controls (P = 0.004). C) Time from onset of illumination to first spike. D) Spike frequency at onset (inverse time between first and second spike). E) Total spikes per 500 ms stimulus. Measures in D and E showed significantly increased excitability in TTX-treated cells relative to control cells (P < 0.05 for each stimulation intensity ≥ 1.7 mW/cm2). F–J) Negative HPIE. Data from n = 25 control cells and n = 28 KCl-treated cells. Panels are the same as A–E. KCl treated cells had a significantly higher stimulation intensity threshold than controls (P = 7×10⁻⁶). Measures in H – J showed significantly decreased excitability in KCl-treated cells relative to control cells (H: P < 0.01 for all stimulus intensities; I: P < 0.05 for stimulus intensities ≥ 1.7 mW/cm2; J: P < 0.05 for stimulus intensities ≤ 11.2 mW/cm2). For all experiments fluorescence was excited at 300 W/cm2, and collected at a 1 kHz frame rate on an EMCCD (Methods). All error bars represent s.e.m. Statistical significance determined by two-tailed student’s t-test or Mann–Whitney U test. ** P < 0.01; *** P < 0.001.
Figure 5
Figure 5. Optopatch2 in organotypic brain slice
A) Left and middle: eGFP fluorescence, indicating CheRiff distribution. Right: QuasAr2 fluorescence. Scale bars from left to right: 50 µm, 20 µm, 20 µm. B) Single-trial optical recordings of APs initiated by pulses of blue illumination (10 ms, 7.5 mW/cm2). Signal represents whole-soma fluorescence without photobleaching correction or background subtraction. C) Bursts of APs triggered by steps of blue illumination (500 ms, 1–10 mW/cm2). Inhibitory potentials (arrows) were sometimes observed during the stimulation intervals, but not during rest intervals, suggesting inhibitory feedback arising from optically induced network activity. For B) and C), red illumination was 1,200 W/cm2 nominal incident intensity, not corrected for light scatter. Fluorescence collected at a frame rate of 1 kHz on an EMCCD camera (Methods).

Similar articles

Cited by

References

    1. Peron S, Svoboda K. From cudgel to scalpel: toward precise neural control with optogenetics. Nat. Meth. 2010;8:30–34. - PubMed
    1. Petreanu L, Mao T, Sternson SM, Svoboda K. The subcellular organization of neocortical excitatory connections. Nature. 2009;457:1142–1145. - PMC - PubMed
    1. Scanziani M, Hausser M. Electrophysiology in the age of light. Nature. 2009;461:930–939. - PubMed
    1. Boulting GL, et al. A functionally characterized test set of human induced pluripotent stem cells. Nat. Biotechnol. 2011;29:279–286. - PMC - PubMed
    1. Furuta T, et al. Brominated 7-hydroxycoumarin-4-ylmethyls: photolabile protecting groups with biologically useful cross-sections for two photon photolysis. Proc. Natl. Acad. Sci. U. S. A. 1999;96:1193–1200. - PMC - PubMed

Supplementary References

    1. Zhao H, Giver L, Shao Z, Affholter JA, Arnold FH. Molecular evolution by staggered extension process (StEP) in vitro recombination. Nat. Biotechnol. 1998;16:258–261. - PubMed
    1. Zhao Y, et al. An expanded palette of genetically encoded Ca2+ indicators. Science. 2011;333:1888–1891. - PMC - PubMed
    1. Cheng Z, Campbell RE. Assessing the structural stability of designed β-hairpin peptides in the cytoplasm of live cells. ChemBioChem. 2006;7:1147–1150. - PubMed
    1. Lanyi JK. Proton translocation mechanism and energetics in the light-driven pump bacteriorhodopsin. Biochim. Biophys. Acta. 1993;1183:241–261. - PubMed
    1. Lanyi JK. Bacteriorhodopsin. Annu. Rev. Physiol. 2004;66:665–688. - PubMed

Publication types