. 2014 Jul 16;83(2):309-323.
doi: 10.1016/j.neuron.2014.05.033. Epub 2014 Jun 19.

A high-resolution spatiotemporal atlas of gene expression of the developing mouse brain

Affiliations

A high-resolution spatiotemporal atlas of gene expression of the developing mouse brain

Carol L Thompson et al. Neuron. .

Abstract

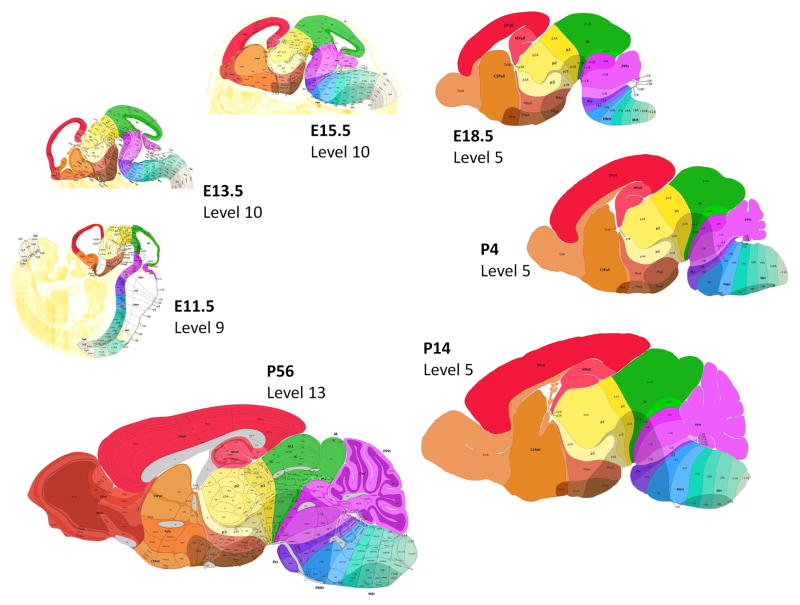
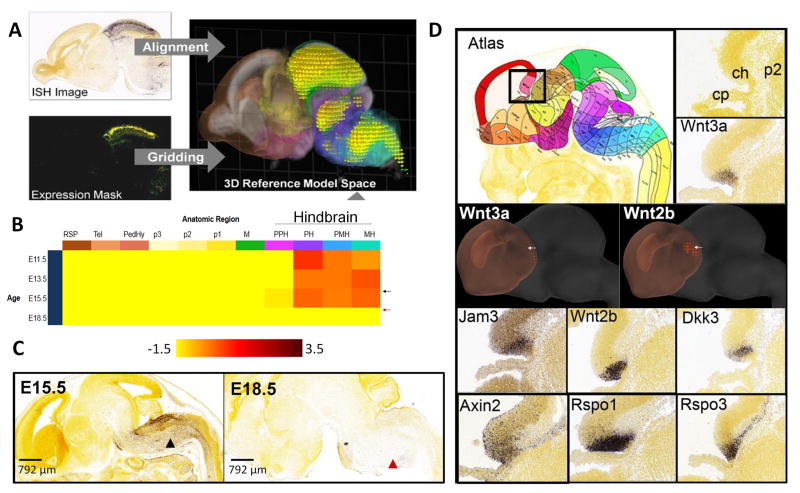
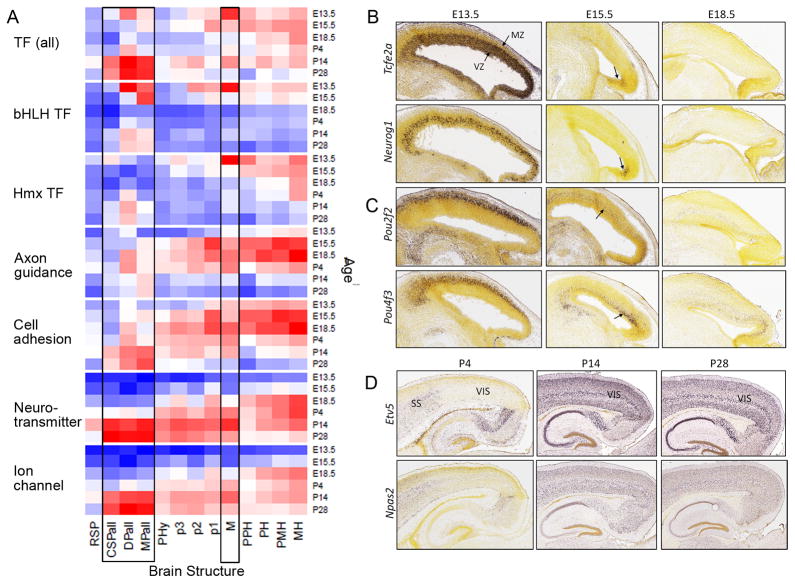
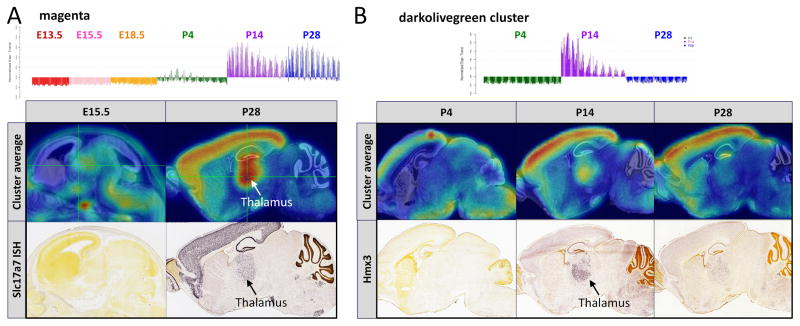
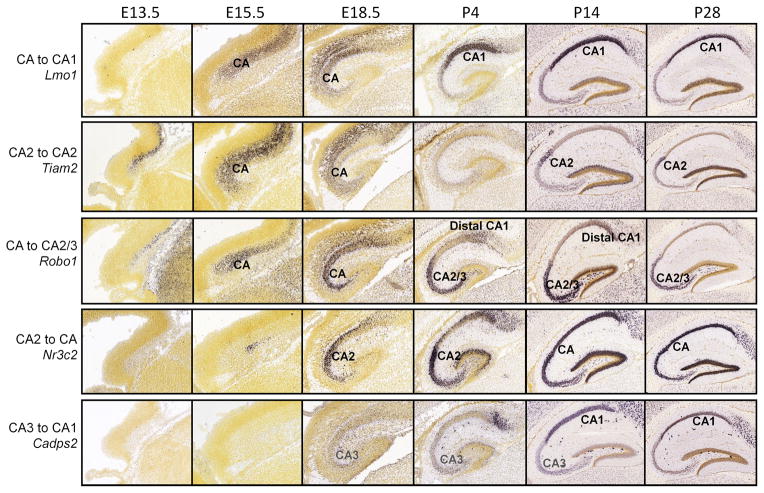
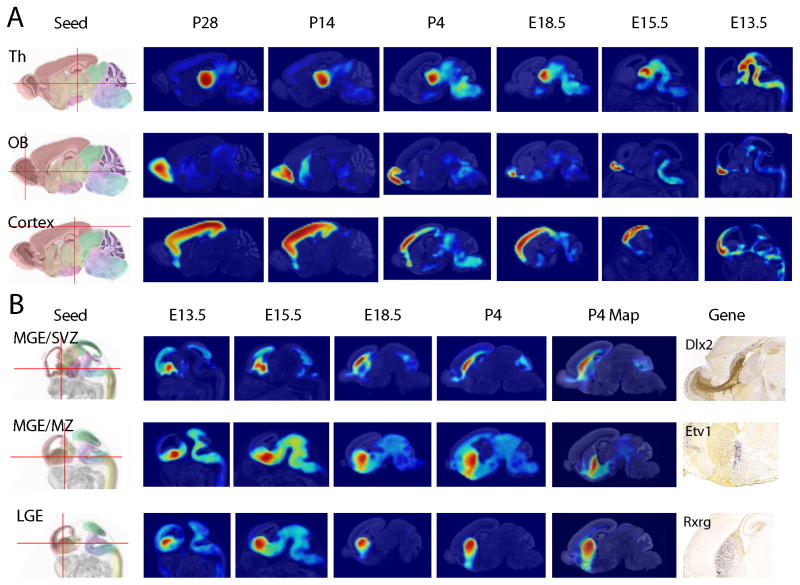
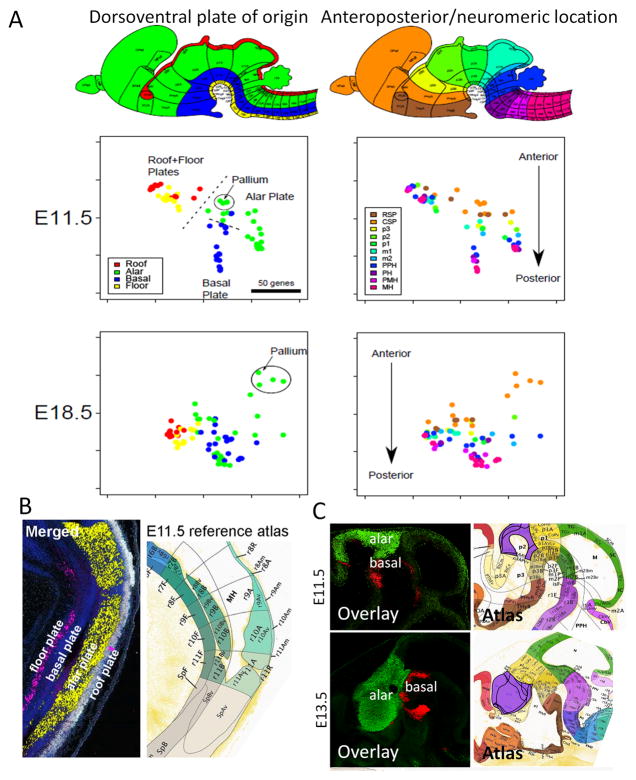
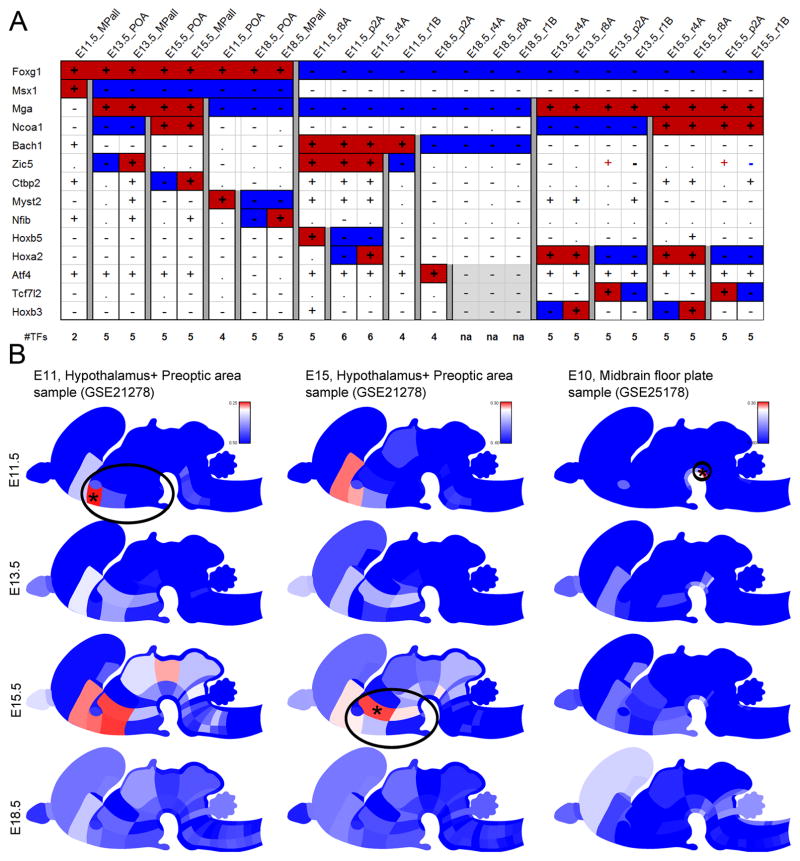
To provide a temporal framework for the genoarchitecture of brain development, we generated in situ hybridization data for embryonic and postnatal mouse brain at seven developmental stages for ∼2,100 genes, which were processed with an automated informatics pipeline and manually annotated. This resource comprises 434,946 images, seven reference atlases, an ontogenetic ontology, and tools to explore coexpression of genes across neurodevelopment. Gene sets coinciding with developmental phenomena were identified. A temporal shift in the principles governing the molecular organization of the brain was detected, with transient neuromeric, plate-based organization of the brain present at E11.5 and E13.5. Finally, these data provided a transcription factor code that discriminates brain structures and identifies the developmental age of a tissue, providing a foundation for eventual genetic manipulation or tracking of specific brain structures over development. The resource is available as the Allen Developing Mouse Brain Atlas (http://developingmouse.brain-map.org).


Figures

Figure 1
Figure 1. Reference framework for the Allen Developing Mouse Brain Atlas
Representative reference atlas plates from seven developmental ages surveyed in the project are shown. Because P28 and P56 time points are indistinguishable from a neuroanatomic standpoint, the P56 Nissl images used in the reference atlas for the Allen Mouse Brain Atlas were also annotated using the developmental ontology and are supplied as a reference for both P28 and P56 ISH data.
Figure 2
Figure 2. Automated informatics-based pipeline for ISH image analysis
(A) Image pre-processing, alignment, signal quantification, and summary are provided by a suite of automated modules. An “Alignment” module registers ISH images to the common coordinates of a 3D reference space (Supplemental Experimental Procedures). The “Gridding” module produces an expression summary in 3D for computational expression analysis. The “Unionize” module generates anatomic structure-based statistics by combining grid voxels with the same 3D structural label. In (A), ISH for Tcfap2b is shown at E18.5 with its expression mask and 3D expression summary. (B) Expression summary and (C) ISH for Hoxa2. PH, pontine hindbrain; PMH, pontomedullary hindbrain; and MH, medullary hindbrain (last three columns in Expression Summary in B). (D) Wnt3a was used as a seed gene in NeuroBlast to find other genes in the cortical hem at E13.5. The E13.5 reference atlas is shown; the black box indicates the areas shown in the histology images. The area containing the cortical hem is labeled in a reference HP Yellow stained image (ch, cortical hem; p2, prosomere 2; cp, choroid plexus). 3D images of the atlas structures overlaid with gene expression are shown using the Brain Explorer® 2 3D viewer, where grey represents the entire brain, and orange represents the telencephalic vesicle (Tel) which was used to constrain the search. Voxels found to have gene expression are highlighted, appearing as “bubbles”. Arrows point to the cortical hem. ISH for genes identified by NeuroBlast are shown (sagittal plane; see also Figures S2, S3, and Table S1).
Figure 3
Figure 3. Anatomic and temporal expression by gene class
(A) Normalized average expression level for gene classes by age and anatomic region. Expression level is calculated as in Methods and normalized across gene class with higher expression levels in red, lower in blue. Abbreviations: Genes: bHLH, basic helix loop helix; Hmx, homeobox. Structures: RSP, rostral secondary prosencephalon; CSPall, central subpallium; DPall, dorsal pallium/isocortex; MPall, medial pallium; PHy, peduncular hypothalamus; p3, prosomere 3 (prethalamus and prethalamic tegmentum); p2, prosomere 2 (thalamus and thalamic tegmentum); p1, prosomere 1 (pretectum and pretectal tegmentum); M, midbrain; PPH, prepontine hindbrain; PH, pontine hindbrain; PMH, pontomedullary hindbrain; MH, medullary hindbrain. (B–D) Genes identified using online Temporal Search feature. (B, C) Temporal Search for genes enriched in E13.5 midbrain identified bHLH genes expressed in ventricular (VZ) and periventricular zones (B), and homeobox genes in mantle zone (MZ) (C). (D) Temporal Search for genes enriched at P28 in the telencephalic vesicle. Although these genes are expressed in the P4 somatosensory cortex (SS), they exhibit striking lack of expression in visual cortex (VIS). These genes are expressed throughout neocortex after eye opening (P14 and P28; see also Figure S1 and Table S2).
Figure 4
Figure 4. Temporal expression patterns in the diencephalon identified by WGCNA
(A) Voxelized expression data from 6 ages were used to cluster genes by WGCNA; the magenta cluster is a temporally regulated cluster. The plot (top) shows the eigengene for the cluster across individual voxels at each age. Underneath, the top panels illustrate average expression levels at the indicated stages. The ISH for a gene example is shown at the bottom panels. (B) Voxelized expression data from postnatal ages were used to cluster genes by WGCNA. The darkolivegreen cluster shows strong upregulation at P14 (see also Figures S4, S5, S6 and Tables S3–S5).
Figure 5
Figure 5. Changes in specificity of gene markers for hippocampal fields
The top three genes are expressed initially in the entire CA pyramidal layer in the embryo, and eventually display specificity in only one CA field by P28. Nr3c2 is expressed in a subset of cells at E15.5, with enrichment in CA2 around birth, but is expressed throughout CA by the adult. Finally, Cadps2 exhibits transient weak expression in CA3 prior to strong CA1 staining in the adult.
Figure 6
Figure 6. Virtual fatemaps using AGEA
(A) Virtual (reverse) fate mapping is constructed starting with an initial seed voxel selected at P28. The highest correlated voxel at the next youngest age is calculated in stepwise fashion iteratively until E13.5, and a correlation map is generated at each age. Method is shown for thalamus (Th), olfactory bulb (OB), and cortex. (B) Virtual (forward) fate map of the ganglionic eminences. The initial seed voxel was selected manually at E13.5, and the highest correlated voxel at the next oldest age was automatically selected in stepwise fashion until P28. ISH data at P4 for a supporting gene is shown for each example: Dlx2 for MGE/SVZ; Etv1 for MGE/MZ; and Rxrg for LGE).
Figure 7
Figure 7. Multidimensional scaling shows a shift from dorsoventral (plate)-based to anteroposterior neuromere-based organization of the embryonic brain
(A) Two-dimensional visualization of regions characterized by differences in TF expression, using standard MDS for two embryonic ages. The brain schematic on the top shows brain structures color-coded by DV plates or AP/neuromeric position. The distance between any two regions (dots) represents the number of genes that are differentially expressed between them, as determined by “expressed” versus “undetected” calls in the manual annotation. Left, structures are colored by DV location (roof, red; alar, green; basal, blue; yellow, floor); right, regions are colored by AP location, divided into the following gross categories: rostral secondary prosencephalon (RSP), caudal secondary prosencephalon (CSP), prosomeres 1–3 (p1, p2, p3), mesomeres 1–2 (m1, m2), prepontine hindbrain (PPH), pontine hindbrain (PH), pontomedullary hindbrain (PMH) and medullary hindbrain (MH). (B, C) Examples of genes showing DV organization at E11.5 in the hindbrain (B) and in the diencephalon (C). Genes in (B) are: floor plate, Arx; alar plate, Ascl1; roof plate, Msx1. Genes in (C) are: alar plate, Tcf7l2 and basal plate, Foxa1.
Figure 8
Figure 8. A transcription factor code can uniquely identify the developmental age and anatomic structure in a sample profiled by microarray
(A) 14 genes can distinguish six brain structures at 4 ages; in this example, three atlas structures at E18.5 (gray shade) remain indistinguishable with this code. (B) Identifying the anatomic region and biological age of a microarray sample based upon the TF code. For each sample, the GEO ID is given; the best match to a given age x region combination in the ADMBA is color-coded (red, high correlation; blue, low correlation; asterisk, best match). In each case, the TF code accurately identifies the closest age x brain structure. Note the anatomic criteria used for obtaining the microarray samples may have differed in part with our criteria, leading to the dispersion of the correlative results (see also Figures S7 and S8).

Similar articles

Cited by

References

    1. Agathocleous M, Harris WA. From progenitors to differentiated cells in the vertebrate retina. Annual review of cell and developmental biology. 2009;25:45–69. - PubMed
    1. Allocco DJ, Kohane IS, Butte AJ. Quantifying the relationship between co-expression, co-regulation and gene function. BMC Bioinformatics. 2004;5:18. - PMC - PubMed
    1. Bertrand N, Castro DS, Guillemot F. Proneural genes and the specification of neural cell types. Nat Rev Neurosci. 2002;3:517–530. - PubMed
    1. Bota M, Dong HW, Swanson LW. From gene networks to brain networks. Nat Neurosci. 2003;6:795–799. - PubMed
    1. Clancy B, Darlington RB, Finlay BL. Translating developmental time across mammalian species. Neuroscience. 2001;105:7–17. - PubMed