. 2014 Aug 7;15(2):154-68.
doi: 10.1016/j.stem.2014.06.008. Epub 2014 Jun 19.

Leptin-receptor-expressing mesenchymal stromal cells represent the main source of bone formed by adult bone marrow

Affiliations

Leptin-receptor-expressing mesenchymal stromal cells represent the main source of bone formed by adult bone marrow

Bo O Zhou et al. Cell Stem Cell. .

Abstract

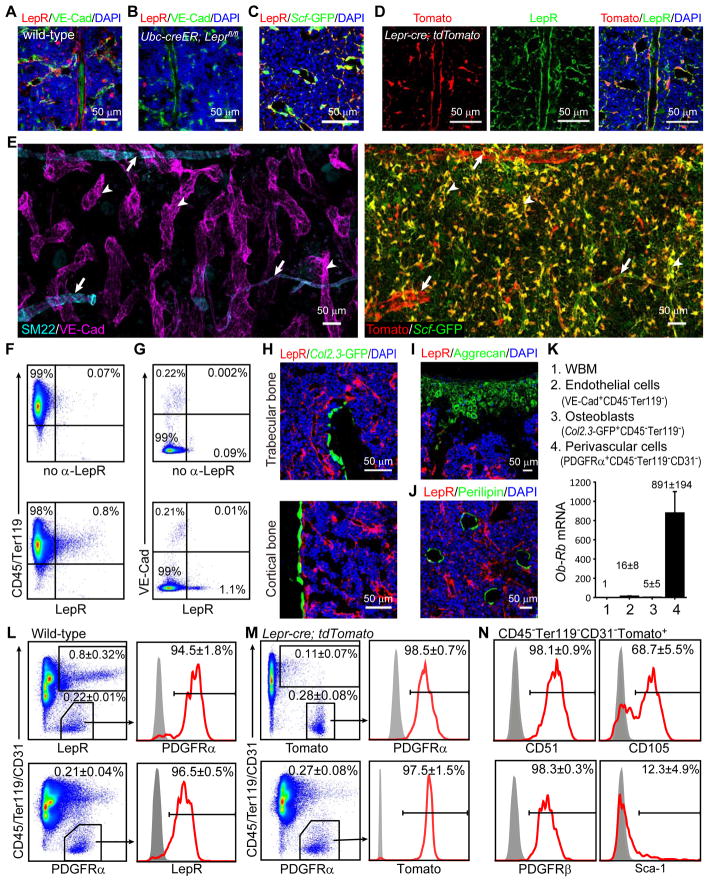
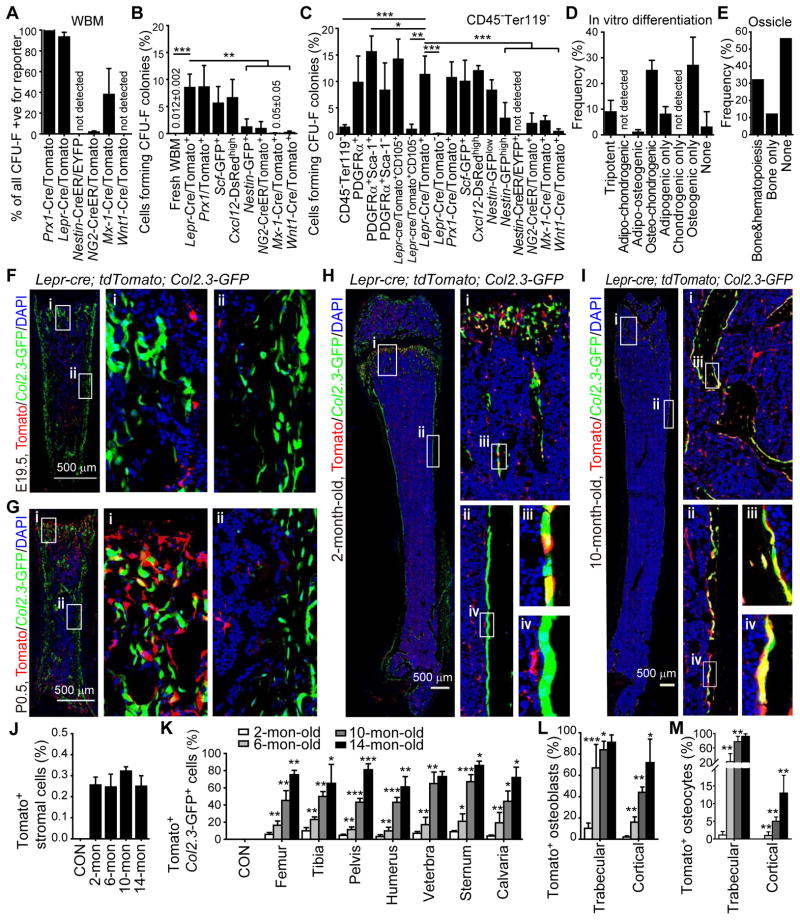
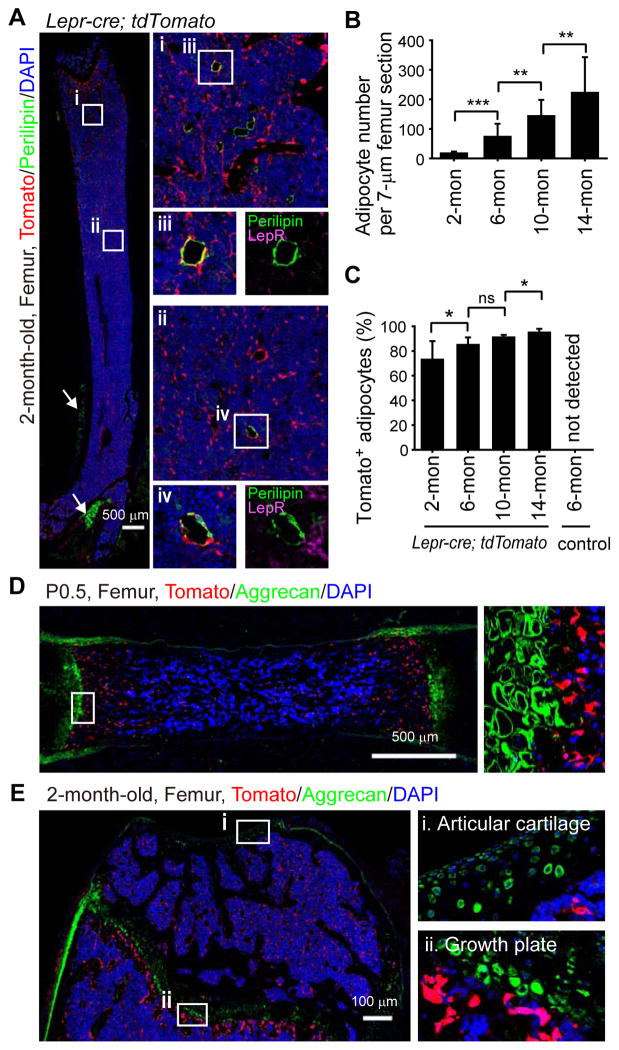
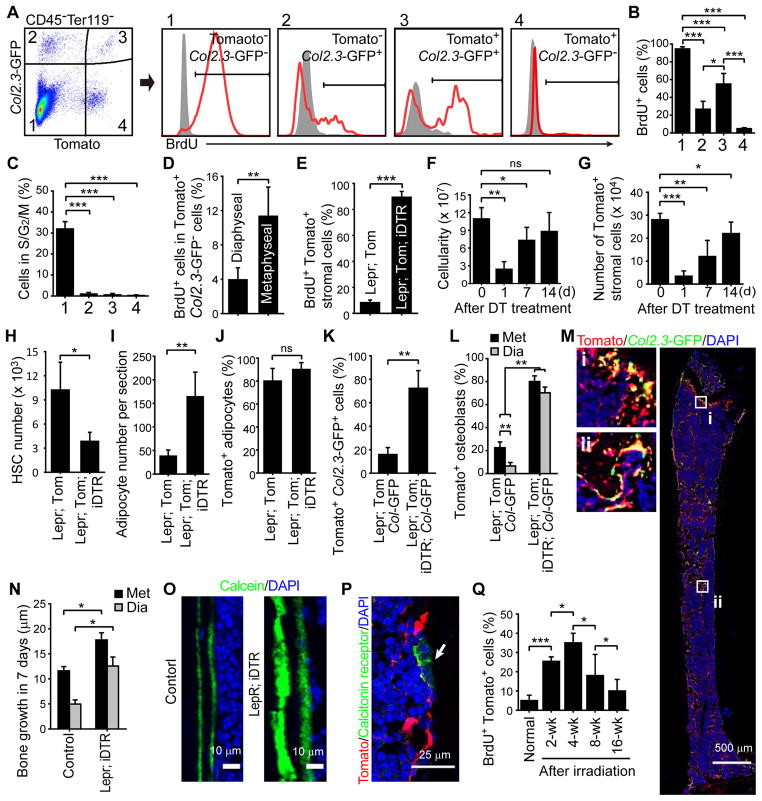
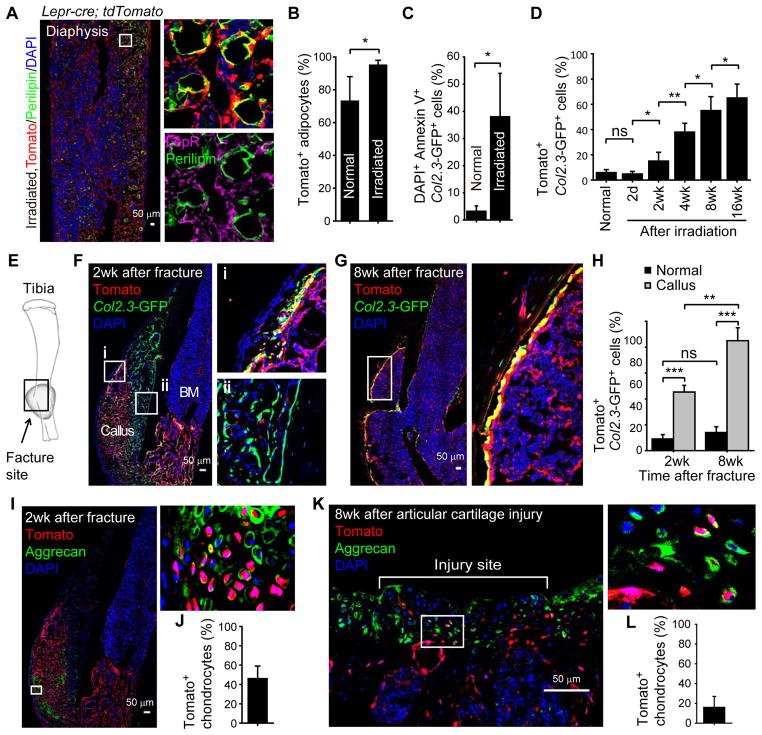
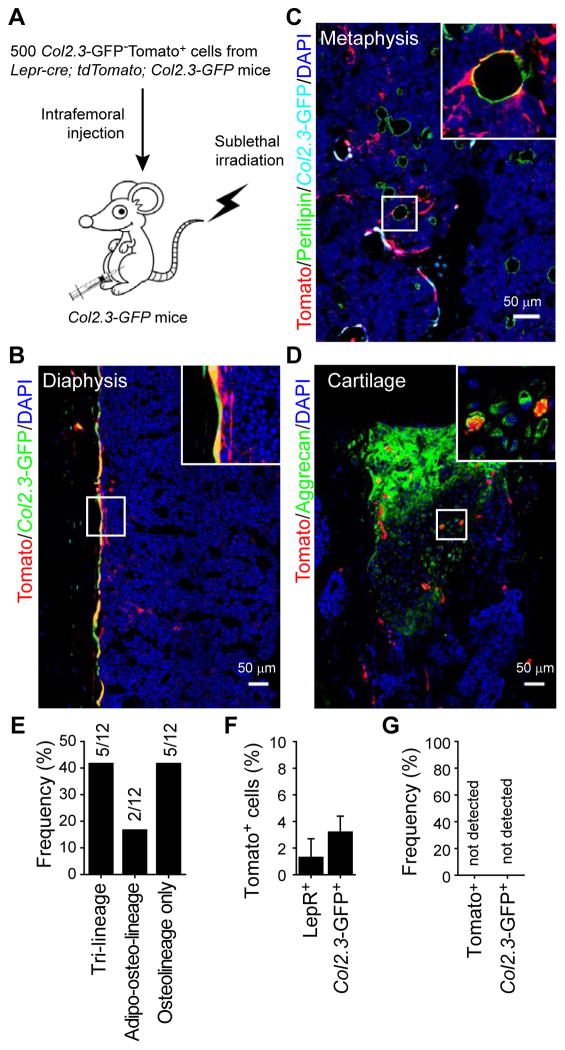
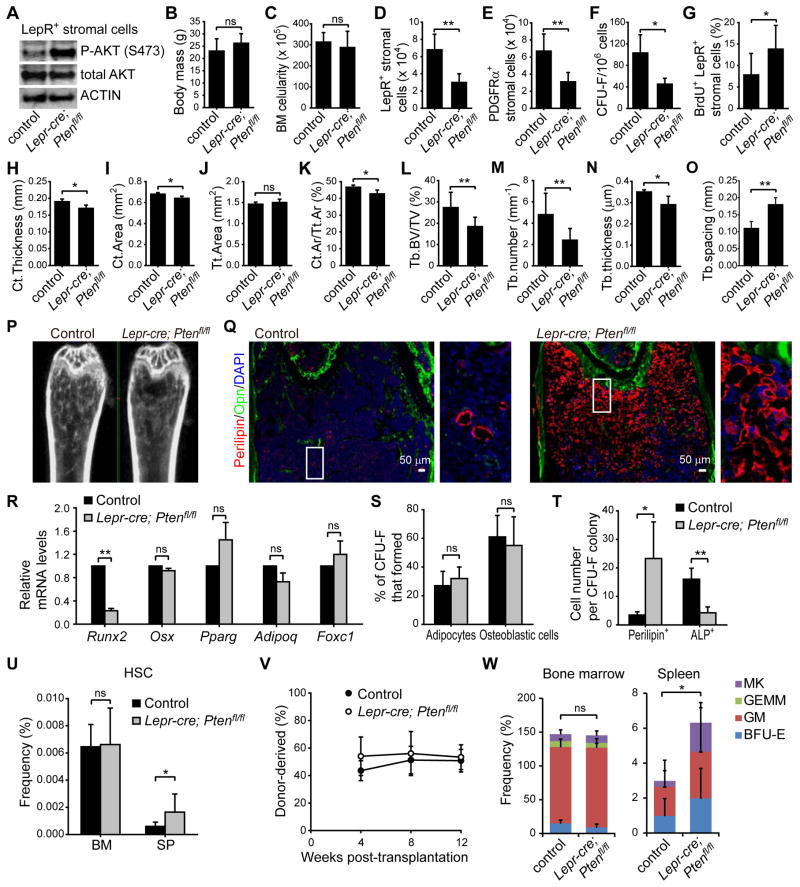
Studies of the identity and physiological function of mesenchymal stromal cells (MSCs) have been hampered by a lack of markers that permit both prospective identification and fate mapping in vivo. We found that Leptin Receptor (LepR) is a marker that highly enriches bone marrow MSCs. Approximately 0.3% of bone marrow cells were LepR(+), 10% of which were CFU-Fs, accounting for 94% of bone marrow CFU-Fs. LepR(+) cells formed bone, cartilage, and adipocytes in culture and upon transplantation in vivo. LepR(+) cells were Scf-GFP(+), Cxcl12-DsRed(high), and Nestin-GFP(low), markers which also highly enriched CFU-Fs, but negative for Nestin-CreER and NG2-CreER, markers which were unlikely to be found in CFU-Fs. Fate-mapping showed that LepR(+) cells arose postnatally and gave rise to most bone and adipocytes formed in adult bone marrow, including bone regenerated after irradiation or fracture. LepR(+) cells were quiescent, but they proliferated after injury. Therefore, LepR(+) cells are the major source of bone and adipocytes in adult bone marrow.


Figures

Figure 1
Figure 1. LepR and Scf-GFP expressing cells are abundant around sinusoids throughout the bone marrow and are distinct from other stromal cells
(A and B) Representative femur sections from 3~4-month-old wild-type (A) and Ubc-creER; Leprfl/fl mice (B). The anti-LepR antibody stained perivascular cells in wild-type (A) but not Ubc-creER; Leprfl/fl (B) bone marrow (unless otherwise indicated, each panel reflects data from 3 mice/genotype from 3 independent experiments). (C) Staining with anti-LepR antibody and Scf-GFP. (D) Staining with anti-LepR antibody strongly overlapped with Tomato expression around sinusoids and arterioles in the bone marrow of Lepr-cre; tdTomato mice. (E) Three dimensional reconstruction of a Z stack of tiled confocal images of femur bone marrow from a Lepr-cre; tdTomato; Scf-GFP mouse. Anti-VE-Cad staining marked sinusoids (arrowheads, left panel) and arterioles while anti-SM22 staining specifically marked arterioles (arrows, left panel). Left and right panels represent images from the same field of view. LepR was expressed by perivascular cells around sinusoids and arterioles but LepR+Scf-GFP+ cells were most abundant around sinusoids. Note that most Scf-GFP staining that did not overlap with Tomato staining represented the processes of perivascular cells that had Tomato staining in their cell body (see Figure S1B). The frequency of Scf-GFP+ cells appears high in this image because it represents a Z stack of images from a thick section, not a single optical section. (F and G) Flow cytometry analysis showed that CD45/Ter119+ hematopoietic cells (F) and VE-cadherin+ endothelial cells (G) rarely stained positively for LepR. The bone marrow was dissociated mechanically in F (thus lacking stroma) or enzymatically in G (including stroma). (H–J) Col2.3-GFP+ osteoblasts (H), Aggrecan+ chondrocytes (I) and Perilipin+ adipocytes (J) did not stain with anti-LepR antibody. (n=3–5 mice from at least 3 independent experiments) (K) Quantitative RT-PCR of Ob-Rb transcript levels (normalized to β-Actin). Data represent mean±SD (standard deviation) from 4 independent experiments. (L and M) In 2–4 month old mice, nearly all LepR+ bone marrow cells stained positively for PDGFRα, and vice versa, irrespective of whether the LepR+ cells were identified by antibody staining (L) or Tomato expression in Lepr-cre; tdTomato mice (M). The data represent mean±SD from 3–5 mice from at least 3 independent experiments. (N) Marker expression by Tomato+ bone marrow cells from Lepr-cre; tdTomato mice.
Figure 2
Figure 2. LepR+ cells contain most of the CFU-F in adult bone marrow and are the major source of new bone in adult mice
(A) Percentage of all CFU-F colonies that were labeled by conditional reporter expression when cultured from enzymatically dissociated bone marrow of the indicated genotypes. Macrophage colonies were excluded by staining with anti-CD45 antibody in all experiments. (n=3–11 mice/genotype from at least 3 independent experiments). (B) Percentage of bone marrow cells expressing each marker that formed CFU-F colonies in culture (n=3–5 mice/genotype from at least 3 independent experiments). (C) Percentage of non-hematopoietic (CD45Ter119) bone marrow cells expressing each marker that formed CFU-F colonies in culture (n=3–11 mice/genotype from at least 3 independent experiments). Two-tailed Student’s t-tests were used to assess statistical significance. *P<0.05, **P<0.01, ***P<0.001. (D) The percentage of CFU-F colonies that arose from Tomato+CD45Ter119CD31 cells from Lepr-cre; tdTomato mice that gave rise to Oil-red O+ adipocytes, Toluidine blue+ chondrocytes, and/or Alizarin-red S+ osteoblasts (n=3 mice from 3 independent experiments). (E) Development of bone and hematopoiesis in ossicles formed by individual CFU-F colonies that arose from LepR+ stromal cells from 4 Col2.3-GFP; Lepr-cre; tdTomato mice. (F–I) Representative femur sections from Lepr-cre; tdTomato; Col2.3-GFP mice of different ages showing the increasing generation of Tomato+Col2.3-GFP+ osteoblasts with age (3–5 mice/age from at least 4 independent experiments). (J) The frequency of Tomato+CD45Ter119CD31Col2.3-GFP bone marrow stromal cells in the femurs of Lepr-cre; tdTomato; Col2.3-GFP mice did not change with age. Cells from ~6-month-old Col2.3-GFP; tdTomato mice were negative controls (CON). Data in all remaining panels represent mean±SD from 3–5 mice/age from at least 3 independent experiments. (K) Percentage of Col2.3-GFP+ osteoblasts that were also Tomato+ in enzymatically dissociated bone from Lepr-cre; tdTomato; Col2.3-GFP mice of different ages. Osteoblasts from age-matched Col2.3-GFP or Col2.3-GFP; tdTomato mice were used as negative controls in each experiment (CON). Two-tailed Student’s t-tests were used to assess statistical significance among consecutive ages. *P<0.05, **P<0.01, ***P<0.001. (L and M) Percentage of osteoblasts (L) and osteocytes (M) that were Tomato+ in bone sections from Lepr-cre; tdTomato; Col2.3-GFP mice.
Figure 3
Figure 3. LepR+ cells give rise to most bone marrow adipocytes but to few chondrocytes
(A) Representative femur sections from a 2-month-old Lepr-cre; tdTomato mouse. Perilipin+ adipocytes in the bone marrow did not stain with an anti-LepR antibody (purple) but were Tomato+ (red). Periosteal adipocytes (arrows) were uniformly Tomato negative (representative of 4 mice from 4 independent experiments). (B and C) Quantification of adipocyte number per 7 μm femur section (B) and the percentage of adipocytes that were Tomato+ at each age (C) in Lepr-cre; tdTomato mice. Two-tailed Student’s t-tests were used to assess statistical significance. ns, not significant, *P<0.05, **P<0.01, ***P<0.001. (n=3–5 mice/age from at least 3 independent experiments). (D and E) Aggrecan+ chondrocytes were not Tomato+ in P0.5 (D) or 2-month-old (E) Lepr-cre; tdTomato mice (n=3–5 mice/age from at least 3 independent experiments).
Figure 4
Figure 4. LepR+Col2.3-GFP cells are quiescent under normal physiological conditions in adult bone marrow but go into cycle to regenerate bone after injury
(A–C) BrdU incorporation (14 day pulse) (A and B) or Hoechst staining (C) by various stromal cell fractions from enzymatically dissociated bone and bone marrow obtained from 2-month-old Lepr-cre; tdTomato; Col2.3-GFP mice. Unless otherwise indicated, data in all remaining panels represent mean±SD from 3–4 mice in 3 independent experiments, with statistical significance assessed by two-tailed Student’s t-tests. ns, not significant, *P<0.05, **P<0.01, ***P<0.001. (D) Percentage of Tomato+Col2.3-GFPCD45Ter119CD31 bone marrow stromal cells that incorporated a 14 day pulse of BrdU. (E) Percentage of Tomato+CD45Ter119CD31 bone marrow stromal cells that incorporated a 14 day pulse of BrdU in femurs and tibias from Lepr-cre; tdTomato mice and Lepr-cre; tdTomato; iDTR mice two weeks after diphtheria toxin (DT) treatment. (F) Bone marrow cellularity in the femurs and tibias of Lepr-cre; tdTomato; iDTR mice at the indicated time points after DT treatment. (G) Number of Tomato+CD45Ter119CD31 stromal cells in bone marrow from Lepr-cre; tdTomato; iDTR mice after DT treatment. (H) Number of CD150+CD48LineageSca-1+c-kit+ HSCs in the femurs and tibias 7 days after DT treatment. (I and J) Quantification of adipocyte number per 7 μm femur section (I) and the percentage of adipocytes that were Tomato+ (J) 14 days after DT treatment. (K) Percentage of Col2.3-GFP+ osteoblasts that were also Tomato+ in enzymatically dissociated bone 2 weeks after DT treatment. (L) Percentage of Col2.3-GFP+ osteoblasts that were also Tomato+ at metaphyseal (Met) and diaphyseal (Dia) bones 2 weeks after diphtheria toxin treatment. (M) Representative femur sections from Lepr-cre; tdTomato; Col2.3-GFP; iDTR mice at 2 weeks after DT treatment. Note the formation of ectopic trabecular bone by Tomato+Col2.3-GFP+ cells in the diaphyseal bone marrow cavity (ii). (N and O) Bone formation rate in Lepr-cre; iDTR and control mice after DT treatment. Two doses of calcein were injected at day 0 and 7 after DT treatment then the distance between calcein bands was measured at 14 days after DT treatment. (P) Osteoclasts (arrow) were not labeled by Tomato in Lepr-cre; tdTomato mice. (Q) Percentage of Tomato+CD45Ter119CD31 bone marrow stromal cells that incorporated a 14 day pulse of BrdU in Lepr-cre; tdTomato mice at various times after irradiation. (n=3–5 mice/time point from 3 independent experiments)
Figure 5
Figure 5. LepR+ cells are the major source of new osteoblasts and adipocytes during tissue regeneration and can also form chondrocytes after subchondral perforation
(A and B) Representative femur section from a 2-month-old Lepr-cre; tdTomato mouse 14 days after lethal irradiation and transplantation of wild-type bone marrow cells. Perilipin+ adipocytes in the bone marrow did not stain with an anti-LepR antibody (purple) but were Tomato+ (red) demonstrating they derived from endogenous radio-resistant LepR+ cells (mean±SD from 5 mice in 4 independent experiments). (C) Percentage of Col2.3-GFP+ osteoblasts that were also DAPI+Annexin V+ in enzymatically dissociated bone 2 days after irradiation. Data in all remaining panels represent mean±SD from 3–4 mice (per time point) in 3 independent experiments. (D) Percentage of Col2.3-GFP+ osteoblasts that were also Tomato+ in enzymatically dissociated bone from Lepr-cre; tdTomato; Col2.3-GFP mice at various time points after irradiation. (E) Schematic of experimental fracture site. The black rectangle depicts the region shown in images G, H and J. (F and G) Tomato expression by Col2.3-GFP+ osteoblasts at the fracture site in Lepr-cre; tdTomato; Col2.3-GFP mice at 2 weeks (F) or 8 weeks (G) after fracture. (H) Percentage of Col2.3-GFP+ osteoblasts that were also Tomato+ in unfractured tibias from control mice (normal) as well as bone callus from Lepr-cre; tdTomato; Col2.3-GFP mice. (I and J) Percentage of Aggrecan+ chondrocytes that were also Tomato+ at the fracture site 2 weeks after the fracture. (K and L) Percentage of Aggrecan+ chondrocytes that were also Tomato+ 8 weeks after subchondral perforation of articular cartilage in Lepr-cre; tdTomato mice. Statistical significance was always assessed using two-tailed Student’s t-tests. ns, not significant, *P<0.05, **P<0.01, ***P<0.001.
Figure 6
Figure 6. LepR+ cells give rise to osteoblasts, adipocytes, and chondrocytes after intrafemoral transplantation
(A) Experimental design. (B–D) Representative femur sections from Col2.3-GFP mice transplanted with 500 Tomato+Col2.3-GFP cells as described in (A) (n=5). Note that the transplanted Tomato+Col2.3-GFP cells gave rise to Col2.3-GFP+ osteoblasts (B), Perilipin+ adipocytes (C), and Aggrecan+ cartilage cells (at the injection site, D). (E) Fraction of recipient mice in which Tomato+ cells were observed to contribute to each of the indicated mesenchymal lineages (n=12 mice). (F) The percentage of LepR+ bone marrow stromal cells or Col2.3-GFP+ osteoblasts that were also Tomato+ (donor-derived) in the femurs of recipient mice (mean±SD from 3 mice in 3 independent experiments). (G) No Tomato+LepR+ cells or Tomato+Col2.3-GFP+ cells were observed in the femurs of mice transplanted with 105 non-hematopoietic Col2.3-GFPTomato cells from Lepr-cre; tdTomato; Col2.3-GFP mice (n=3).
Figure 7
Figure 7. PTEN regulates quiescence, maintenance, and differentiation in LepR+ stromal cells
(A) Representative western-blots of flow cytometrically isolated LepR+CD45Ter119CD31 stromal cells from 4-month-old Lepr-cre; Ptenfl/fl mice and littermate controls. (B) Body mass (Unless otherwise indicated, all remaining panels show mean±SD from 3–5 mice in 3–4 independent experiments, with statistical significance assessed by two-tailed Student’s t-tests, ns, not significant, *P<0.05, **P<0.01, ***P<0.001). (C) Bone marrow cellularity in the femurs of 4-month-old Lepr-cre; Ptenfl/fl mice and littermate controls (D) Number of LepR+CD45Ter119CD31 cells. (E) Number of PDGFRα+CD45Ter119CD31 cells. (F) CFU-F per million bone marrow cells. (G) Percentage of LepR+CD45Ter119CD31 bone marrow stromal cells that incorporated a 14 day pulse of BrdU. (H–O) MicroCT measurement of cortical (Ct) thickness (H), cortical area (I), total (Tt) area (J), cortical area/total area (Ct.Ar/Tt.Ar) (K), trabecular (Tb) bone volume/total volume (BV/TV) (L), trabecular number (M), trabecular thickness (N) and trabecular spacing (O) of femurs. (P) Representative microCT images of femurs. (Q) Representative femur sections showing excessive adipogenesis at metaphyseal bone marrow in Lepr-cre; Ptenfl/fl mice. (R) qPCR analysis of transcript levels for genes associated with osteogenic or adipogenic differentiation in LepR+ stromal cells. Transcript levels were normalized based on β-actin amplification then set to 1 in control samples for comparison purposes. (S) The percentage of CFU-F colonies that contained adipocytes (Oil red O+) and/or osteoblastic cells (Alzarin red S+) after culture in differentiation medium for 3 weeks. (T) The average number of Perilipin+ adipocytes or Alkaline phosphatase+ (ALP+) osteogenic cells that spontaneously differentiated per CFU-F colony after culture for 1 week in standard medium. (U) Number of CD150+CD48LineageSca-1+c-kit+ HSCs in the bone marrow and spleen. (V) Donor-cell engraftment when 3×10⁵ donor bone marrow cells were transplanted along with 3×10⁵ recipient bone marrow cells into irradiated recipient mice (n=11–12 recipient mice per genotype in 3 experiments). (W) Frequencies of myeloerythroid-colony-forming progenitors in the bone marrow and spleen.

Comment in

Similar articles

Cited by

References

    1. Balordi F, Fishell G. Hedgehog signaling in the subventricular zone is required for both the maintenance of stem cells and the migration of newborn neurons. J Neurosci. 2007;27:5936–5947. - PMC - PubMed
    1. Bianco P, Robey PG, Simmons PJ. Mesenchymal stem cells: revisiting history, concepts, and assays. Cell Stem Cell. 2008;2:313–319. - PMC - PubMed
    1. Bonaguidi MA, Wheeler MA, Shapiro JS, Stadel RP, Sun GJ, Ming GL, Song H. In vivo clonal analysis reveals self-renewing and multipotent adult neural stem cell characteristics. Cell. 2011;145:1142–1155. - PMC - PubMed
    1. Buch T, Heppner FL, Tertilt C, Heinen TJ, Kremer M, Wunderlich FT, Jung S, Waisman A. A Cre-inducible diphtheria toxin receptor mediates cell lineage ablation after toxin administration. Nat Methods. 2005;2:419–426. - PubMed
    1. Chai Y, Jiang X, Ito Y, Bringas P, Jr, Han J, Rowitch DH, Soriano P, McMahon AP, Sucov HM. Fate of the mammalian cranial neural crest during tooth and mandibular morphogenesis. Development. 2000;127:1671–1679. - PubMed

Publication types

MeSH terms