

Computational analysis of the effectiveness of blood flushing with saline injection from an intravascular diagnostic catheter
- PMID: 24953876
- PMCID: PMC4429308
- DOI: 10.1002/cnm.2657
Computational analysis of the effectiveness of blood flushing with saline injection from an intravascular diagnostic catheter
Abstract
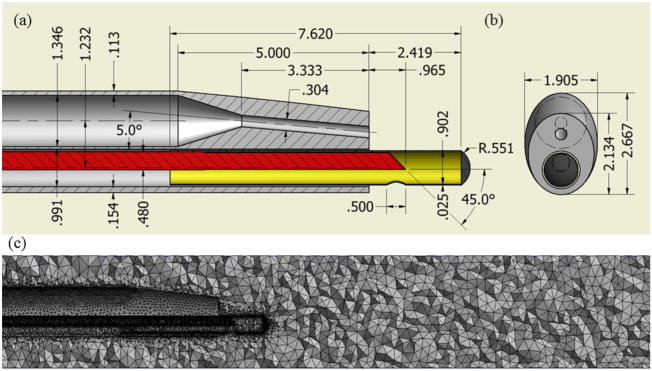
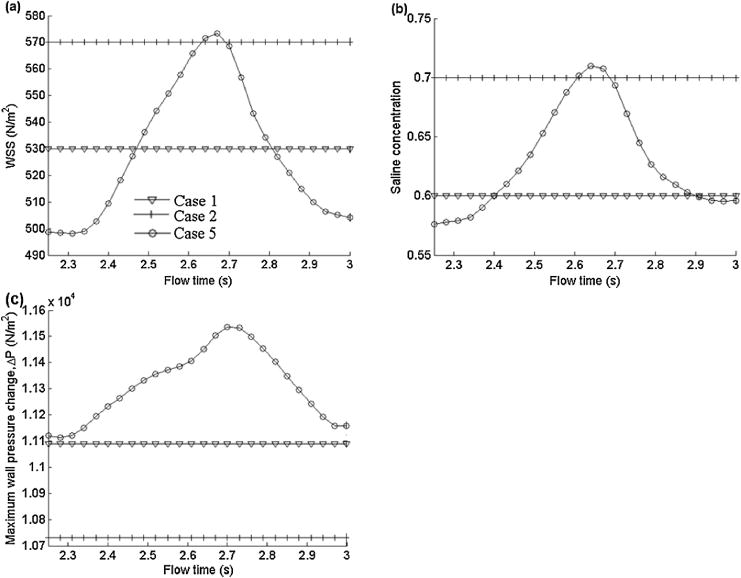
Optical techniques including fluorescence lifetime spectroscopy have demonstrated potential as a tool for study and diagnosis of arterial vessel pathologies. However, their application in the intravascular diagnostic procedures has been hampered by the presence of blood hemoglobin that affects the light delivery to and the collection from the vessel wall. We report a computational fluid dynamics model that allows for the optimization of blood flushing parameters in a manner that minimizes the amount of saline needed to clear the optical field of view and reduces any adverse effects caused by the external saline jet. A 3D turbulence (k - ω) model was employed for Eulerian-Eulerian two-phase flow to simulate the flow inside and around a side-viewing fiber-optic catheter. Current analysis demonstrates the effects of various parameters including infusion and blood flow rates, vessel diameters, and pulsatile nature of blood flow on the flow structure around the catheter tip. The results from this study can be utilized in determining the optimal flushing rate for given vessel diameter, blood flow rate, and maximum wall shear stress that the vessel wall can sustain and subsequently in optimizing the design parameters of optical-based intravascular catheters.
Keywords: Eulerian-Eulerian two-phase flow; k − ω turbulence model; mixture model; multiphase flow.
Copyright © 2014 John Wiley & Sons, Ltd.
Figures


Similar articles
-
Mechanism of pulsatile flushing technique for saline injection via a peripheral intravenous catheter.Clin Biomech (Bristol). 2020 Dec;80:105103. doi: 10.1016/j.clinbiomech.2020.105103. Epub 2020 Jul 15. Clin Biomech (Bristol). 2020. PMID: 32698096
-
Computational fluid dynamics study of intra-arterial chemotherapy for oral cancer.Biomed Eng Online. 2017 May 15;16(1):57. doi: 10.1186/s12938-017-0348-5. Biomed Eng Online. 2017. PMID: 28506222 Free PMC article.
-
A simulation environment for validating ultrasonic blood flow and vessel wall imaging based on fluid-structure interaction simulations: ultrasonic assessment of arterial distension and wall shear rate.Med Phys. 2010 Aug;37(8):4318-30. doi: 10.1118/1.3462592. Med Phys. 2010. PMID: 20879592
-
Computational model of the fluid dynamics of a cannula inserted in a vessel: incidence of the presence of side holes in blood flow.J Biomech. 2002 Dec;35(12):1599-612. doi: 10.1016/s0021-9290(02)00231-2. J Biomech. 2002. PMID: 12445613
-
Numerical modeling of pulsatile turbulent flow in stenotic vessels.J Biomech Eng. 2003 Aug;125(4):445-60. doi: 10.1115/1.1589774. J Biomech Eng. 2003. PMID: 12968569 Review.
Cited by
-
The Performance of a Spherical-tip Catheter for Stent Post-dilation: Finite Element Analysis and Experiments.Front Physiol. 2021 Aug 31;12:734565. doi: 10.3389/fphys.2021.734565. eCollection 2021. Front Physiol. 2021. PMID: 34531765 Free PMC article.
-
The mechanistic causes of peripheral intravenous catheter failure based on a parametric computational study.Sci Rep. 2018 Feb 21;8(1):3441. doi: 10.1038/s41598-018-21617-1. Sci Rep. 2018. PMID: 29467481 Free PMC article.
-
In silico intravascular optical coherence tomography (IVOCT) for quality assured imaging with reduced intervention.Sci Rep. 2024 Jun 5;14(1):12930. doi: 10.1038/s41598-024-61177-1. Sci Rep. 2024. PMID: 38839774 Free PMC article.
References
-
- Drexler W, Morgner U, Kartner FX, Pitris C, Boppart SA, Li XD, Ippen EP, Fujimoto JG. In vivo ultrahigh-resolution optical coherence. Optics Letters. 1999;24(17):1221–1223. - PubMed
-
- Cheng H, Luo Q, Zeng S, Chen S, Cen J, Gong H. Modified laser speckle imaging method with improved spatial resolution. Journal of Biomedical Optics. 2003;8(3):559–564. - PubMed
-
- Kolkman RGM, Hondebrink E, Steenbergen W. In vivo photoacoustic imaging of blood vessels using an extreme-narrow aperture sensor. IEEE Journal of Selected Topics in Quantum Electronics. 2003;9(2):343–346.
-
- Xu M, Wang LV. Photoacoustic imaging in biomedicine. Review of Scientific Instruments. 2006;77(4):041101–22.
Publication types
MeSH terms
Substances
Grants and funding
LinkOut - more resources
Full Text Sources
Other Literature Sources
