. 2014 Jul 17;21(7):841-854.
doi: 10.1016/j.chembiol.2014.05.009. Epub 2014 Jun 19.

Selective chemical modulation of gene transcription favors oligodendrocyte lineage progression

Affiliations

Selective chemical modulation of gene transcription favors oligodendrocyte lineage progression

Mar Gacias et al. Chem Biol. .

Abstract

Lysine acetylation regulates gene expression through modulating protein-protein interactions in chromatin. Chemical inhibition of acetyl-lysine binding bromodomains of the major chromatin regulators BET (bromodomain and extraterminal domain) proteins has been shown to effectively block cell proliferation in cancer and inflammation. However, whether selective inhibition of individual BET bromodomains has distinctive functional consequences remains only partially understood. In this study, we show that selective chemical inhibition of the first bromodomain of BET proteins using our small-molecule inhibitor, Olinone, accelerated the progression of mouse primary oligodendrocyte progenitors toward differentiation, whereas inhibition of both bromodomains of BET proteins hindered differentiation. This effect was target specific, as it was not detected in cells treated with inactive analogs and independent of any effect on proliferation. Therefore, selective chemical modulation of individual bromodomains, rather than use of broad-based inhibitors, may enhance regenerative strategies in disorders characterized by myelin loss such as aging and neurodegeneration.


Figures

Figure 1
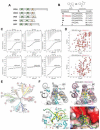
Figure 1. Structure-guided design of Olinone, a selective inhibitor for the BET BrD1
(A) Schematic illustration of domain organization of the members of the BET protein family (BrD: bromodomain; ET: extra-terminal domain). (B) Structure and binding affinity of Olinone and its analogs for the BRD4-BrD1, determined by using isothermal titration calorimetry (ITC) method. Results are representative of three independent experiments and the error is SD. (C) ITC determination of binding affinity of Olinone to the two individual BrDs of BRD4, BRD3, and BRD2. (D) Selectivity binding of Olinone to BRD4-BrD1 vs. BRD4-BrD2, as illustrated by 2D 1H-15N HSQC spectra of a given bromodomain in the free form (black) and in the presence of Olinone (red); as well as by isothermal titration calorimetry. (E) Phylogenetic tree of the human bromodomain family. Dots indicate the BrDs for which Olinone binding affinity was evaluated in the assay described in B, C. Dots are color-coded for high affinity (red), modest affinity (blue), or no binding (gray). (F) Structural basis of selective binding of Olinone to BRD4-BrD1. Upper left, crystal structure of Olinone (yellow) bound to BRD4-BrD1, depicted in a ribbon diagram. The Fo-Fc electron density map was computed after simulated annealing with the compound omitted from the atomic model and shown in blue mesh (contoured to 1.0 σ). Upper right, structural comparison of BRD4-BrD1 and BRD4-BrD2 (pdb: 2YEM), showing steric clash between Olinone with His435 in BRD4-BrD2. Lower left and right, superimposition of crystal structures revealing how Olinone (yellow) and an H4K5ac/K8ac peptide (green) are bound to the BRD4-BrD1 in the protein/ligand complex, depicted in ribbon diagram or electrostatic surface representation (right). Side chains of key amino acid residues at the ligand-binding site in the protein are color-coded by atom type, and bound water molecules are shown as red spheres. See also Figure S1, Figure S2, and Table S1.
Figure 2
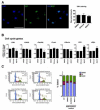
Figure 2. Developmental expression of BET family members in corpus callosum and characterization of BrD inhibition effect in oligodendroglial cells
(A) qRT-PCR showing the transcript levels of Brd2, Brd3 and Brd4-long and -short isoforms in developing corpus callosum relative to 18S expression (n=3 animals per age group. One-Way ANOVA with Bonferroni’s post test, *** P<0.01 vs P0). (B) MTT assay to measure cell viability in primary cultured mouse OPCs, primary cultured mouse astrocytes and Olineu cells after 72 hours of treatment with BrDi at indicated doses (μM). Red lines indicate the dose range matching with the Kd of the inhibitors, showing not toxicity at indicated concentrations. The right panel shows Olinone and MS417 Kd for the first and second bromodomain of BRD4 (n=3; One-Way ANOVA with Dunnett’s post test, *P<0.05, ***P<0.001). (C) Selective BET-BrD inhibition decreases histone acetylation. Top panel, experimental timeline. Bottom panel, automated high throughput confocal screening for histone acetylation. The graph shows the quantification of the average nuclear residue-specific histone acetylation staining intensity referred to DMSO (n=20 sections; n=3) (two tailed t-test **P<0.01, ***P<0.001). Error bars, ± s.e.m. (D) Effect of selective BET-BrD inhibition during the early differentiation phase of mOPCs. qRT-PCR showing the expression levels of differentiation markers after 24 hours of BrDi treatment (Olinone at 1 μM and MS417 at 0.05 μM). Results were normalized to 18S with relative mRNA levels in DMSO treated control cells set to 1 (n=4; One-Way ANOVA with Dunnett’s post test, ***P<0.001). See also Figure S3, and Table S2.
Figure 3
Figure 3. Treatment with BrDi does not affect proliferation of primary cultured mouse OPCs and cell cycle exit upon differentiation stimuli
(A) Representative confocal images of proliferating mOPCs stained with Ki67 antibody (green) and DAPI (blue). Scale bar: 50 mm. The graph represents the % of mean pixel intensity. Results shown are relative DMSO treated control cells (set to 100%). (n=3; One-Way ANOVA with Dunnett’s post test). (B) qRT-PCR showing the expression levels of cell cycle genes after 24 hours of BrDi (Olinone at 1 μM and MS417 at 0.05 μM). Results were normalized to Gapdh, with relative mRNA levels in DMSO treated control cells set to 1 (n=3; One-Way ANOVA with Dunnett’s post test, ***P<0.001). Error bars, ± s.e.m. (C) Cell cycle analysis of BrDi treated mOPCs for 24 hours as indicated. Color bars represent % of cells in each cell cycle phase (n=2; two tailed t-test). Error bars, ± s.e.m.
Figure 4
Figure 4. Temporal control of BrD inhibition on OPC differentiation
(A) BrD inhibitors do not have broad effects on the expression of oligodendrocytic lineage markers in proliferating conditions. Top panel, experimental time line. Bottom panel, qRT-PCR showing the expression levels of differentiation markers after 24 hours of BrDi treatment (Olinone at 1 μM, and MS417 at 0.05 μM) in the presence of mitogens. Results were normalized to 18S with relative mRNA levels in DMSO treated control cells set to 1 (n=4; One-Way ANOVA with Dunnett’s post test, ***P<0.001). (B) Top panel, different experimental paradigms of BrDi treatment during mOPC differentiation. Bottom panel, qRT-PCR results showing the transcript levels of late differentiation markers (Mag, Mog, Mbp, Plp) in mOPC differentiated for 72 hours and treated with BrDi as indicated: I) during 72 hours or II) during the first 24 hours of differentiation and then kept in DM with no BrDi. Doses used: Olinone 1 μM and MS417 0.05 μM. (n=3; One-Way ANOVA with Dunnett’s post test, *P<0.05; **P<0.01; ***P<0.001). (C) Top panel, different experimental paradigms of BrDi treatment. Bottom panel, qRT-PCR results showing the transcript levels of late differentiation markers (Mag, Mog, Mbp, Plp) in mOPC differentiated for 72 hours and treated with BrDi as indicated: I) during 72 hours or III) during the last 36 hours of differentiation. Doses used: Olinone 1 μM and MS417 0.05 μM. (n=3; One-Way ANOVA with Dunnett’s post test, *P<0.05; **P<0.01; ***P<0.001). Error bars, ± s.e.m.
Figure 5
Figure 5. Olinone specifically promotes the expression of the oligodendrocyte intermediate differentiation marker O4
(A) Top panel, experimental timeline. Bottom panel, confocal image of mOPCs treated for 24h with DMSO, Olinone (1 μM), Compound 5 (1 μM), MS417 (0.05 μM) and MS566 (0.05 μM) in differentiation medium (DM) and stained with NG2 (green), O4 (Red) antibodies and DAPI (Blue). Scale bar: 50 mm. (B) The graph shows the quantification of the percentage of NG2+/O4+ staining in treated cells relative to DMSO (n=5-7 sections per condition, n=3 independent experiments. One-Way ANOVA with Dunnett’s post test, **P<0.01). c) qRT-PCR showing the expression levels of differentiation markers after 24 hours of BrDi (Olinone at 1 μM, Compound 5 at 1 μM, MS417 at 0.05 μM, MS566 at 0.05 μM). Results were normalized to Gapdh, with relative mRNA levels in DMSO treated control cells set to 1 (n=4; One-Way ANOVA with Dunnett’s post test, ***P<0.001).
Figure 6
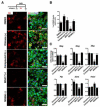
Figure 6. Selective BrDi inhibition differentially affects Brd2 nuclear localization and the progression of primary OPCs towards a fully differentiated phenotype
(A) qRT-PCR showing the relative expression levels of Brd2, Brd3 and the long and short isoforms of Brd4 in mouse primary cultured OPCs. Brd2 is the highly expressed isoform in mOPCs. Olig2 (as a marker of oligodendrocyte lineage), Mbp (as a marker of differentiated oligodendrocytes) and Gfap levels (as a marker of astrocytes) were also determined as controls. Results were normalized to 18S (n=3. Error bars, ± s.e.m). (B) Changes in Brd2 nuclear localization after BrDi treatment ± TSA. Olineu cells transfected with Brd2-eGFP or mutBrd2-eGFP (with two BrDs mutated) in the presence or absence of BrDi (Olinone 1 μM, MS417 0.05 μM), DMSO is used as control. TSA (30 μM) was added after 24 hours of BrDi treatment in order to reduce rapid histone acetylation. Cells were fixed at the indicated time points (1 hour of TSA treatment and 6 hours of TSA treatment). Scale bar= 50 mm. (n=3). Error bars, ± s.e.m. (C) Top panel, experimental timeline. Transcript levels of late differentiation markers (Mag, Mog, Mbp, Plp, Sirt2) and the myelin gene transcriptional inhibitor (Hes5) in response to 72 hours of BrDi treatment (Olinone at 1 μM, Compound 5 at 1 μM, MS417 at 0.05 μM, MS566 at 0.05 μM, MS611 and MS765/RVS208 at 0.5 μM). Results were normalized to Gapdh with relative mRNA level in DMSO treated control cells set to 1 (n=8; One-Way ANOVA with Dunnett’s post test, *P<0.05; **P<0.01; ***P<0.001). Error bars, ± s.e.m. (D) Representative confocal images of mOPCs treated with DMSO, Olinone (1 μM) and MS417 (0.05 μM) during 72 hours in differentiation medium (DM) and stained with MBP antibody (grey) and DAPI (Blue). Scale bar: 100 mm. (E) The graph shows the quantification of the percentage of mature MBP+ membrane bearing cells relative to DMSO (n=3 with 7-8 sections per condition; One-Way ANOVA with Dunnett’s post test, *P<0.05). See also Figure S4, and Figure S5.

Comment in

Similar articles

Cited by

References

    1. Brimacombe KR, Hall MD, Auld DS, Inglese J, Austin CP, Gottesman MM, Fung KL. A dualfluorescence high-throughput cell line system for probing multidrug resistance. Assay DrugDev Technol. 2009;7:233–249. - PMC - PubMed
    1. Chiang CM. Brd4 engagement from chromatin targeting to transcriptional regulation:selective contact with acetylated histone H3 and H4. F1000 Biol Rep. 2009;1:98. - PMC - PubMed
    1. Ciceri P, Muller S, O’Mahony A, Fedorov O, Filippakopoulos P, Hunt JP, Lasater EA, Pallares G, Picaud S, Wells C, et al. Dual kinase-bromodomain inhibitors for rationally designed polypharmacology. Nat Chem Biol. 2014;10:305–312. - PMC - PubMed
    1. Coldham I, Dobson BC, Fletcher SR, Franklin AI. Intramolecular Diploar Cycloaddition Reactions to Give Substituted Indoles - A Formal Synthesis of Deethylibophyllidine. Eur J Org Chem. 2007:2676–2686.
    1. Dawson MA, Prinjha RK, Dittmann A, Giotopoulos G, Bantscheff M, Chan WI, Robson SC, Chung CW, Hopf C, Savitski MM, et al. Inhibition of BET recruitment to chromatin as an effective treatment for MLL-fusion leukaemia. Nature. 2011;478:529–533. - PMC - PubMed

Publication types

MeSH terms

Associated data