. 2014 Jul 7;24(13):1467-1475.
doi: 10.1016/j.cub.2014.05.044. Epub 2014 Jun 19.

Deep proteomics of the Xenopus laevis egg using an mRNA-derived reference database

Affiliations

Deep proteomics of the Xenopus laevis egg using an mRNA-derived reference database

Martin Wühr et al. Curr Biol. .

Abstract

Background: Mass spectrometry-based proteomics enables the global identification and quantification of proteins and their posttranslational modifications in complex biological samples. However, proteomic analysis requires a complete and accurate reference set of proteins and is therefore largely restricted to model organisms with sequenced genomes.

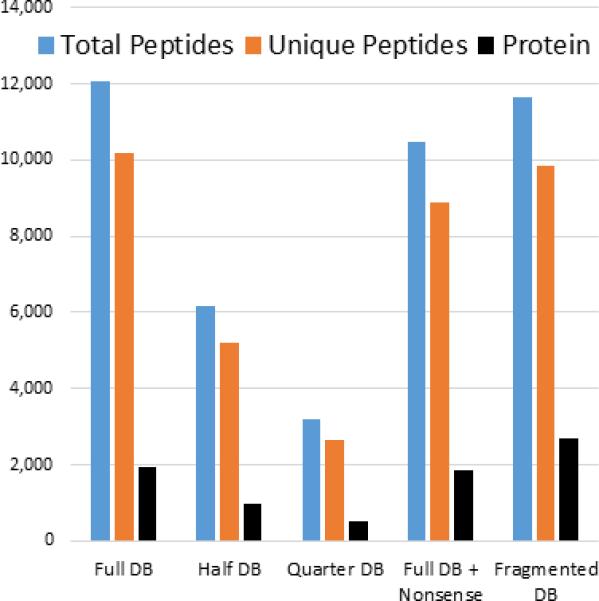
Results: Here, we demonstrate the feasibility of deep genome-free proteomics by using a reference proteome derived from heterogeneous mRNA data. We identify more than 11,000 proteins with 99% confidence from the unfertilized Xenopus laevis egg and estimate protein abundance with approximately 2-fold precision. Our reference database outperforms the provisional gene models based on genomic DNA sequencing and references generated by other methods. Surprisingly, we find that many proteins in the egg lack mRNA support and that many of these proteins are found in blood or liver, suggesting that they are taken up from the blood plasma, together with yolk, during oocyte growth and maturation, potentially contributing to early embryogenesis.

Conclusion: To facilitate proteomics in nonmodel organisms, we make our platform available as an online resource that converts heterogeneous mRNA data into a protein reference set. Thus, we demonstrate the feasibility and power of genome-free proteomics while shedding new light on embryogenesis in vertebrates.


Figures

Figure 1
Figure 1
MS data can be used to evaluate relative reference database quality. Spectra from a tryptic digest of yeast lysate were searched against the standard yeast protein database (Full DB). Shown are the number of total peptide spectral matches (blue), unique peptides (orange), or proteins (black) that were confidently identified. To simulate “poor” reference databases, we removed half (half DB) or three quarters of proteins (Quarter DB) from the reference database. The number of identified PSMs and unique peptides scale approximately with the number or proteins in the database. To test how the addition of nonsense sequences would affect the number of identified peptides, we added randomized human proteins to the full yeast database (Full DB + Nonsense). The numbers of peptides and proteins are negatively affected. To simulate a reference database in which proteins are fragmented, we divided at a random position every protein in the reference into two proteins. While the number of identified peptides slightly decreases, the number of identified proteins substantially increases.
Figure 2
Figure 2
Overview of the steps for constructing the high-quality protein reference set PHROG. Transcripts from four different sources were combined, trimmed and cleaned using SeqClean, masked using RepeatMasker, and clustered/assembled using TGICL/CAP3. The assembled transcripts were aligned against a collection of model vertebrate proteins using BLASTX. The results were used for identifying the correct translation frame, frameshift correction (if appropriate), and for removing sequences without significant similarity to known proteins. Once translated using BioPerl, the longest peptide for each protein is identified, and the ends are trimmed to match tryptic peptides. The collection is processed to remove 100% redundant proteins using CD-HIT, and gene symbols are assigned to the remaining members using the reciprocal or single best BLAST hit against human proteins. The numbers indicate the numbers of transcripts/proteins in each group.
Figure 3
Figure 3
Comparison of protein reference databases for the fractionated X. laevis egg sample (49 MS-runs) A) Number of unique peptides identified with 0.5% FDR on the peptide level. PHROG significantly outperforms the publically available proteins from Xenbase and even the preliminary gene-models from the 7.0 genome assembly as reference database. B) Comparison of the number of proteins identified in the egg, with additional filtering to 1% FDR at the protein level, and maximal parsimony.
Figure 4
Figure 4
Estimation of protein abundance in the Xenopus egg. A) Previously published protein concentrations for 49 proteins versus measured ion-current in MS1 spectrum normalized to protein length. The Pearson correlation is 0.92. On average, the predicted protein concentration is approximately twofold different from the reported protein concentration. B) Histogram of concentration for all identified proteins regressed from normalized MS1 ion current. Median concentration of measured proteins is approximately 30 nM. C) Estimated concentration for subunits of stable complexes is similar. For the APC/C, we additionally distinguished between subunits which were reported to be dimeric (square) or monomeric (triangle) within the complex. While our accuracy is not good enough to separate the two populations, the estimated concentrations for dimeric subunits tend to be higher than monomeric subunits. D) Concentrations for enzymes of a metabolic pathway can vary widely. For each metabolic pathway, the predicted concentrations of its members are plotted (based on KEGG).
Figure 5
Figure 5
mRNA and protein abundance. A) Histogram of mRNA levels in the egg. mRNA for which the protein was also detected is colored in blue. Orange indicates that only mRNA was detected. The median of mRNA concentration is approximately 1000 fold lower than the median for protein abundance. Though we see only a weak correlation between mRNA and protein abundance (0.32 Pearson correlation), the lower the mRNA concentration, the less likely we are to detect the corresponding protein. B) mRNA and protein were matched via assigned gene symbols. MS is able to identify approximately 60% of all gene symbols for which we could detect mRNA. The proteins which we cannot detect via MS are overrepresented by transcription factors, proteins involved in differentiation, and trans-membrane proteins. Contrary, for ~350 gene symbols we could identify only proteins and not mRNA. This group is highly enriched for blood plasma and liver proteins, and were likely endocytosed during oocyte growth.

References

    1. Huttlin EL, Jedrychowski MP, Elias JE, Goswami T, Rad R, Beausoleil SA, Villen J, Haas W, Sowa ME, Gygi SP. A tissue-specific atlas of mouse protein phosphorylation and expression. Cell. 2010;143:1174–1189. - PMC - PubMed
    1. Nagaraj N, Wisniewski JR, Geiger T, Cox J, Kircher M, Kelso J, Paabo S, Mann M. Deep proteome and transcriptome mapping of a human cancer cell line. Mol Syst Biol. 2011;7:548. - PMC - PubMed
    1. Beck M, Schmidt A, Malmstroem J, Claassen M, Ori A, Szymborska A, Herzog F, Rinner O, Ellenberg J, Aebersold R. The quantitative proteome of a human cell line. Mol Syst Biol. 2011;7:549. - PMC - PubMed
    1. Kragl M, Knapp D, Nacu E, Khattak S, Maden M, Epperlein HH, Tanaka EM. Cells keep a memory of their tissue origin during axolotl limb regeneration. Nature. 2009;460:60–65. - PubMed
    1. di Prisco G, Cocca E, Parker S, Detrich H. Tracking the evolutionary loss of hemoglobin expression by the white-blooded Antarctic icefishes. Gene. 2002;295:185–191. - PubMed

Publication types

LinkOut - more resources