. 2014 Aug 28:108:427-44.
doi: 10.1016/j.jprot.2014.06.007. Epub 2014 Jun 18.

Sex differences in the acute in vivo effects of different human SP-A variants on the mouse alveolar macrophage proteome

Affiliations

Sex differences in the acute in vivo effects of different human SP-A variants on the mouse alveolar macrophage proteome

David S Phelps et al. J Proteomics. .

Abstract

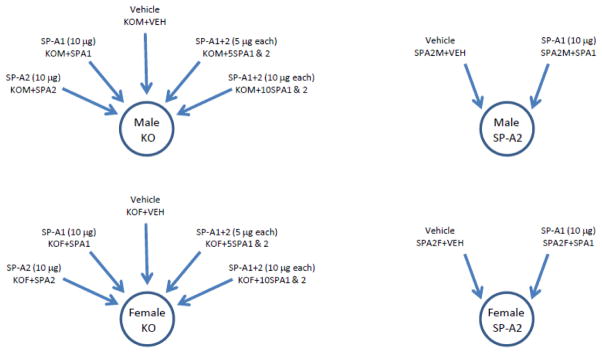
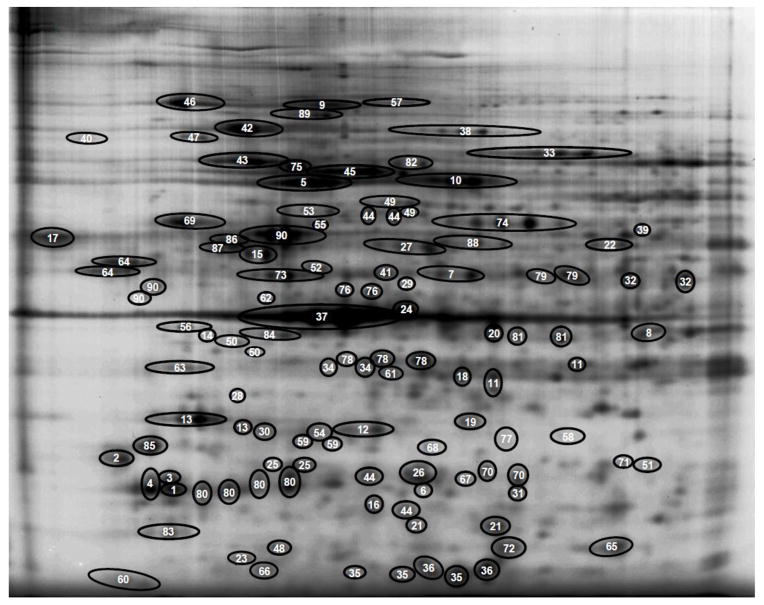
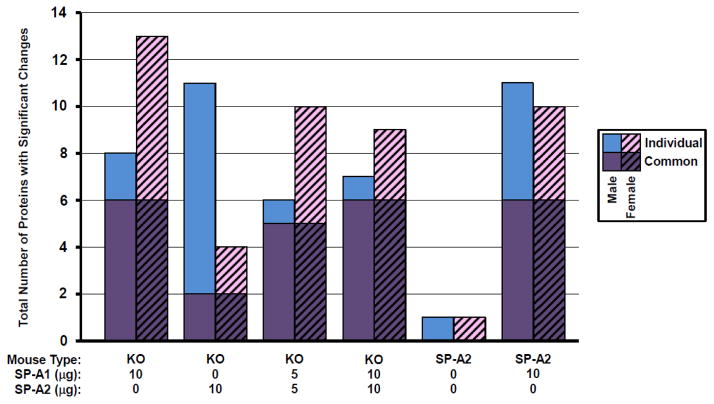
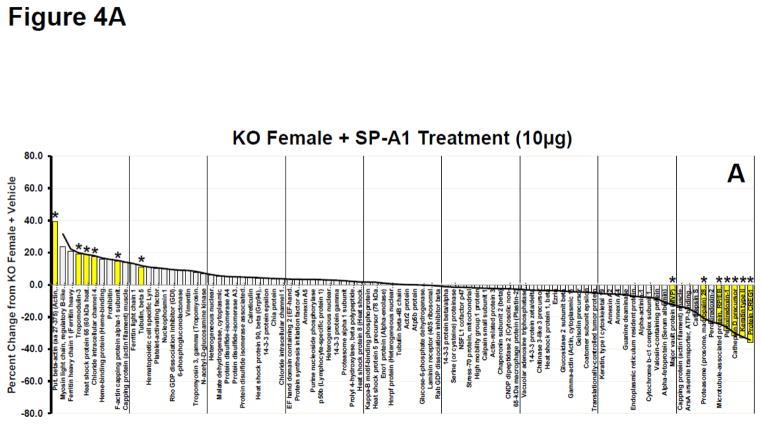
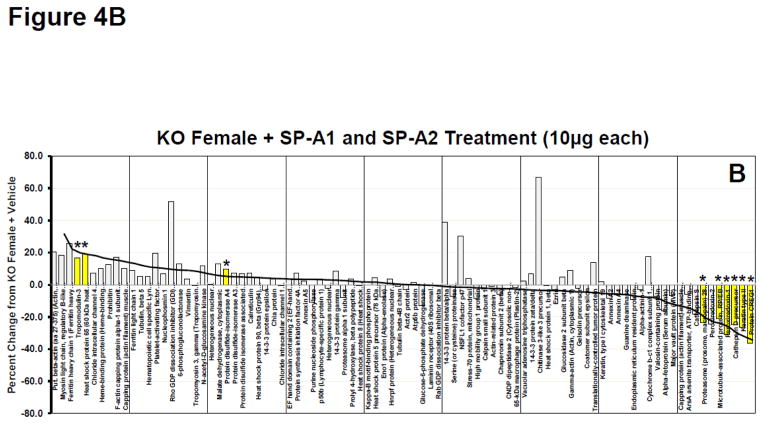
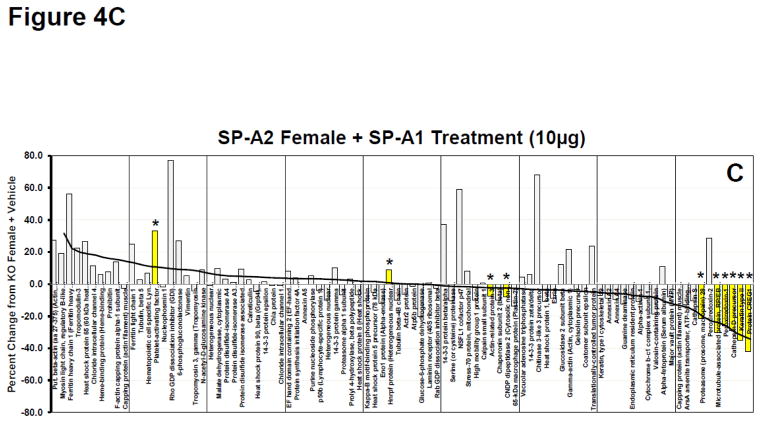
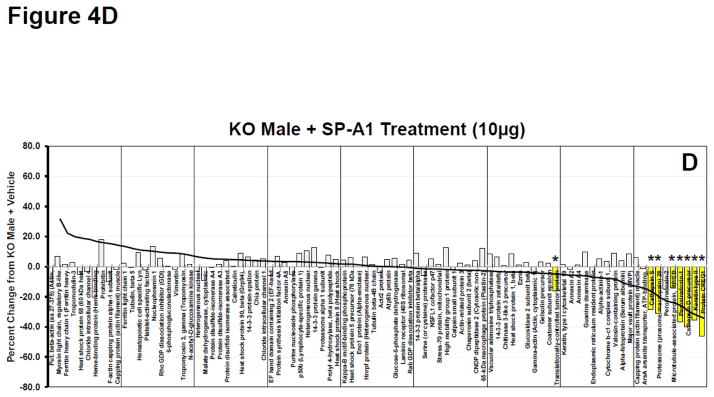
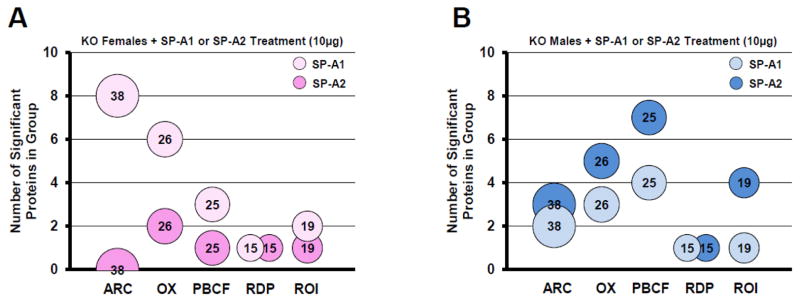
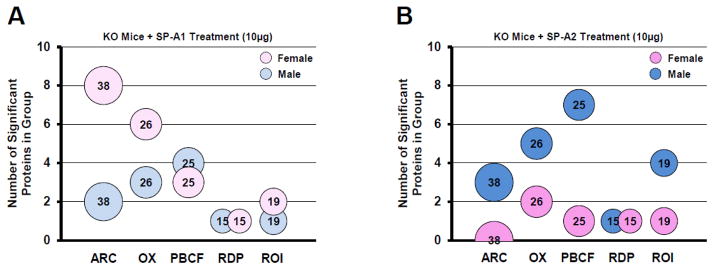
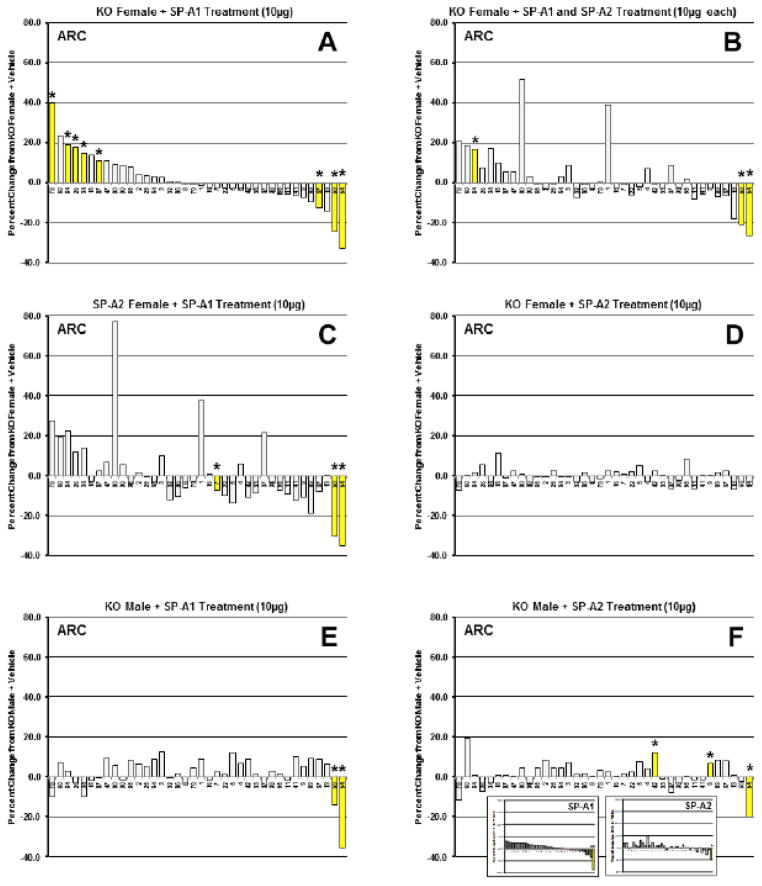
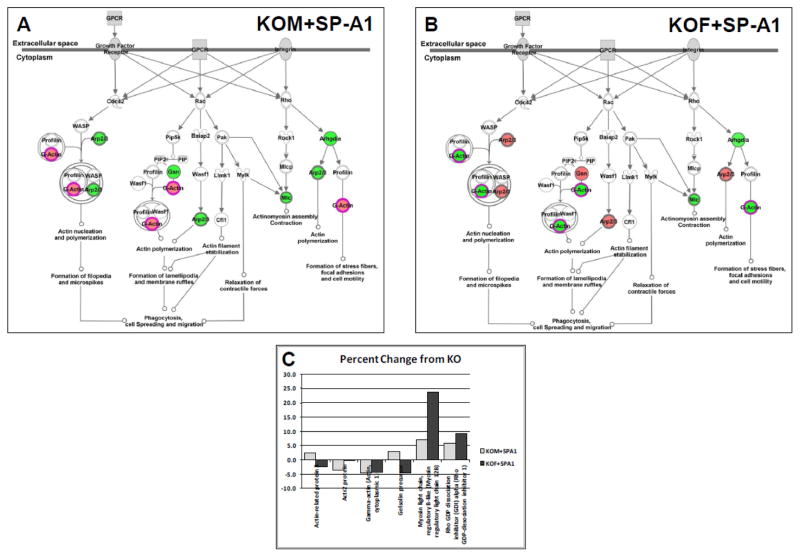
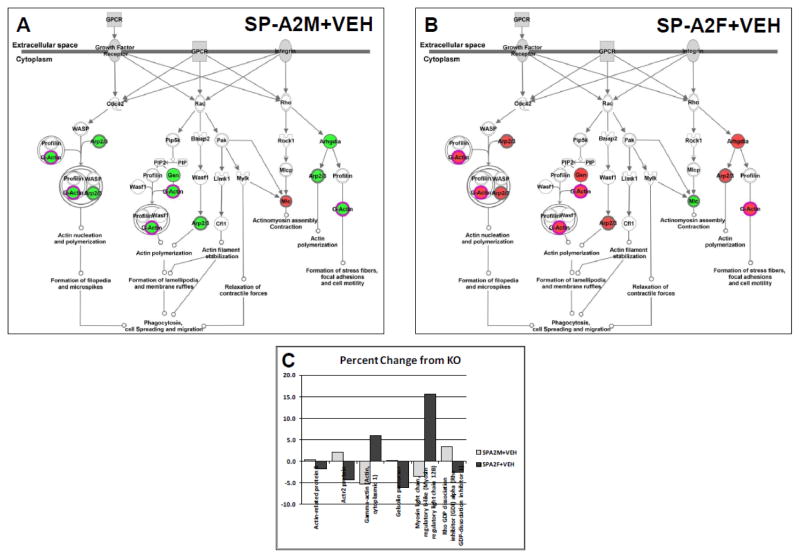
Surfactant protein A (SP-A) is involved in lung innate immunity. Humans have two SP-A genes, SFTPA1 and SFTPA2, each with several variants. We examined the in vivo effects of treatment with specific SP-A variants on the alveolar macrophage (AM) proteome from SP-A knockout (KO) mice. KO mice received either SP-A1, SP-A2, or both. AM were collected and their proteomes examined with 2D-DIGE. We identified 90 proteins and categorized them as related to actin/cytoskeleton, oxidative stress, protease balance/chaperones, regulation of inflammation, and regulatory/developmental processes. SP-A1 and SP-A2 had different effects on the AM proteome and these effects differed between sexes. In males more changes occurred in the oxidative stress, protease/chaperones, and inflammation groups with SP-A2 treatment than with SP-A1. In females most SP-A1-induced changes were in the actin/cytoskeletal and oxidative stress groups. We conclude that after acute SP-A1 and SP-A2 treatment, sex-specific differences were observed in the AM proteomes from KO mice, and that these sex differences differ in response to SP-A1 and SP-A2. Females are more responsive to SP-A1, whereas the gene-specific differences in males were minimal. These observations not only demonstrate the therapeutic potential of exogenous SP-A, but also illustrate sex- and gene-specific differences in the response to it.

Biological significance: This study shows that changes occur in the alveolar macrophage proteome in response to a single in vivo treatment with exogenous SP-A1 and/or SP-A2. We demonstrate that SP-A1 and SP-A2 have different effects on the AM proteome and that sex differences exist in the response to each SP-A1 and SP-A2 gene product. This study illustrates the potential of exogenous SP-A1 and SP-A2 treatment for the manipulation of macrophage function and indicates that the specific SP-A variant used for treatment may vary with sex and with the cellular functions being modified. The observed changes may contribute to sex differences in the incidence of some lung diseases.

Keywords: Actin; Autophagy; Inflammation; Innate immunity; Oxidative stress; Surfactant.


Figures

Figure 1
Figure 1
Schematic representation of experimental design. Male and female SP-A−/− mice (KO) received intrapharyngeal instillations of either: vehicle; SP-A1 (10μg); SP-A2 (10μg); SP-A1+SP-A2 (5μg each); or SP-A1+SP-A2 (10μg each). Male and female SP-A2 humanized transgenic mice received instillations of either: vehicle; or SP-A1 (10μg). Alveolar macrophages were then harvested 18 hours later by bronchoalveolar lavage and studied for protein expression.
Figure 2
Figure 2
Reference gel of AM proteins and protein list. This figure shows an image of the reference gel with identified proteins circled and numbered. The legend contains the names of each identified protein. List of identified proteins in reference gel: 1) 14-3-3 protein beta/alpha; 2) 14-3-3 protein epsilon; 3) 14-3-3 protein gamma; 4) 14-3-3 protein zeta/delta; 5) 65-kDa macrophage protein (Plastin-2); 6) 6-phosphogluconolactonase; 7) Actin-related protein 3; 8) Actr2 protein; 9) Alpha-actinin-1; 10) Alpha-fetoprotein (Serum albumin); 11) Annexin A2; 12) Annexin A4; 13) Annexin A5; 14) ArsA arsenite transporter, ATP-binding, homolog 1; 15) Atp5b protein; 16) Calpain small subunit 1; 17) Calreticulin; 18) Capping protein (actin filament) muscle Z-line, alpha 2 (F-actin-capping protein subunit alpha-2); 19) Capping protein (actin filament) muscle Z-line, beta isoform a (F-actin-capping protein subunit beta); 20) Cathepsin D precursor; 21) Cathepsin S; 22) Chaperonin subunit 2 (beta); 23) Chia protein; 24) Chitinase 3-like 3 precursor; 25) Chloride intracellular channel 1 (Chloride intracellular channel protein 1); 26) Chloride intracellular channel 4 (mitochondrial); 27) CNDP dipeptidase 2 (Cytosolic non-specific dipeptidase); 28) Coatomer subunit epsilon; 29) Cytochrome b-c1 complex subunit 1, mitochondrial; 30) EF hand domain containing 2 (EF-hand domain-containing protein D2); 31) Endoplasmic reticulum resident protein 29; 32) Eno1 protein (Alpha-enolase); 33) Ezrin; 34) F-actin capping protein alpha-1 subunit (F-actin-capping protein subunit alpha-1); 35) Ferritin heavy chain 1 (Ferritin heavy chain); 36) Ferritin light chain 1; 37) Gamma-actin (Actin, cytoplasmic 2); 38) Gelsolin precursor; 39) Glucose-6-phosphate dehydrogenase X-linked; 40) Glucosidase 2 subunit beta; 41) Guanine deaminase; 42) Heat shock protein 1, beta; 43) Heat shock protein 5 precursor (78 kDa glucose-regulated protein); 44) Heat shock protein 65 (60 kDa heat shock protein, mitochondrial); 45) Heat shock protein 8 (Heat shock cognate 71 kDa protein); 46) Heat shock protein 90, beta (Grp94), member 1 (Endoplasmin); 47) Hematopoietic cell specific Lyn substrate 1 (Hematopoietic lineage cell-specific protein); 48) Heme-binding protein (Heme-binding protein 1); 49) Heterogeneous nuclear ribonucleoprotein K; 50) Heterogeneous nuclear ribonucleoproteins C1/C2; 51) High mobility group 1 protein; 52) Hnrpf protein (Heterogeneous nuclear ribonucleoprotein F); 53) Kappa-B motif-binding phosphoprotein; 54) Keratin type II; 55) Keratin, type I cytoskeletal 19; 56) Laminin receptor (40S ribosomal protein SA); 57) Major vault protein (MVP); 58) Malate dehydrogenase, cytoplasmic; 59) Microtubule-associated protein, RP/EB family, member 1; 60) Myosin light chain, regulatory B-like (Myosin regulatory light chain 12B); 61) N-acetyl-D-glucosamine kinase; 62) NSFL1 cofactor p47; 63) Nucleophosmin 1; 64) p50b (Lymphocyte-specific protein 1); 65) Peroxiredoxin-1; 66) Peroxiredoxin-2; 67) Platelet-activating factor acetylhydrolase IB subunit beta; 68) Prohibitin; 69) Prolyl 4-hydroxylase, beta polypeptide precursor; 70) Proteasome (prosome, macropain) 28 subunit, alpha (Proteasome activator complex subunit 1); 71) Proteasome alpha 1 subunit; 72) Protein CREG1; 73) Protein disulfide isomerase associated 6 (Protein disulfide-isomerase A6); 74) Protein disulfide-isomerase A3 precursor (Protein disulfide-isomerase A3); 75) Protein disulfide-isomerase A4; 76) Protein synthesis initiation factor 4A (Eukaryotic initiation factor 4A–I); 77) Purine nucleoside phosphorylase; 78) Put. beta-actin (aa 27–375) (Actin, cytoplasmic 2); 79) Rab GDP dissociation inhibitor beta; 80) Rho GDP dissociation inhibitor (GDI) alpha (Rho GDP-dissociation inhibitor 1); 81) Serine (or cysteine) proteinase inhibitor, clade B, member 1a (Leukocyte elastase inhibitor A); 82) Stress-70 protein, mitochondrial; 83) Translationally-controlled tumor protein; 84) Tropomodulin-3; 85) Tropomyosin 3, gamma (Tropomyosin alpha-3 chain); 86) Tubulin beta-4B chain; 87) Tubulin, beta 5; 88) Vacuolar adenosine triphosphatase subunit B; 89) Valosin-containing protein; 90) Vimentin.
Figure 3
Figure 3
Histogram summarizing all significant changes in both sexes. The total number of proteins with significant changes is graphed when each treatment group is compared to the KO + Vehicle group. Purple portions of bars are proteins with significant changes that are common to both males (solid) and females (hatched). Blue and pink portions of bars are additional proteins with significant changes that are unique to either males or females, respectively. As indicated in the key, male bars are blue solid and female bars are pink hatched.
Figure 4
Figure 4
Waterfall plots of whole AM proteome. A. Waterfall plot showing the percent change for KO Female + SP-A1 treatment (10μg) compared to KO Female + Vehicle treatment for all proteins. This group is used as the index group and all plots (Panels AD) are presented with the proteins in this order. Proteins are arranged in order from greatest percent increase from KO+Vehicle to greatest percent decrease from KO+Vehicle as indicated by the trendline. Yellow bars with asterisks are proteins with significant changes (p<0.05) from KO + Vehicle. Names of proteins can be seen for each bar on the x-axis. B. Same as in 4A (with same protein order) for KO Female + SP-A1 and SP-A2 treatment (10 μg each). The trend line from 4A is superimposed on the histogram to facilitate comparison. C. Same as in 4A (with same protein order) for SP-A2 Female + SP-A1 treatment (10 μg). The trend line from 4A is superimposed on the histogram. D. Same as in 4A (with same protein order) for KO Male + SP-A1 treatment (10 μg). The trend line from 4A is superimposed on the histogram.
Figure 4
Figure 4
Waterfall plots of whole AM proteome. A. Waterfall plot showing the percent change for KO Female + SP-A1 treatment (10μg) compared to KO Female + Vehicle treatment for all proteins. This group is used as the index group and all plots (Panels AD) are presented with the proteins in this order. Proteins are arranged in order from greatest percent increase from KO+Vehicle to greatest percent decrease from KO+Vehicle as indicated by the trendline. Yellow bars with asterisks are proteins with significant changes (p<0.05) from KO + Vehicle. Names of proteins can be seen for each bar on the x-axis. B. Same as in 4A (with same protein order) for KO Female + SP-A1 and SP-A2 treatment (10 μg each). The trend line from 4A is superimposed on the histogram to facilitate comparison. C. Same as in 4A (with same protein order) for SP-A2 Female + SP-A1 treatment (10 μg). The trend line from 4A is superimposed on the histogram. D. Same as in 4A (with same protein order) for KO Male + SP-A1 treatment (10 μg). The trend line from 4A is superimposed on the histogram.
Figure 5
Figure 5
Changes in functional groups in each sex. Bubble charts depicting the number of significantly different proteins per functional group: ARC, actin-related/cytoskeletal; OX, oxidative stress; PBCF, protease balance/chaperone function; RDP, regulatory/developmental processes, and ROI, regulation of inflammation. Bubble size and the number within each bubble indicate the number of proteins in the overall group. The number of significant differences is indicated by y-axis values. Panel A shows groups from KO females treated with SP-A1 (10μg) (light pink bubbles) or treated with SP-A2 (10μg) (dark pink bubbles). Panel B shows groups from KO males treated with SP-A1 (10μg) (light blue bubbles) or treated with SP-A2 (10μg) (dark blue bubbles).
Figure 6
Figure 6
Changes in functional groups with each SP-A gene product. Bubble charts depicting the number of significantly different proteins per group: ARC, actin-related cytoskeletal; OX, oxidative stress; PBCF, protease balance/chaperone function; RDP, regulatory/developmental processes, and ROI, regulation of inflammation. Bubble size and the number within each bubble indicate the number of proteins in the overall group. The number of significant differences is indicated by the y-axis values. Panel A shows groups from KO mice treated with SP-A1 (10μg) for males (light blue) or females (light pink). Panel B shows groups from KO mice treated with SP-A2 (10μg) for males (dark blue) or females (dark pink).
Figure 7
Figure 7
Waterfall plots for ARC proteins. Waterfall plots of percent change from KO + Vehicle for actin-related/cytoskeletal proteins (ARC). Panel A, KO female + SP-A1 treatment (10μg). This group is used as the index group, and all plots (Panels A-F, except inset in 7F) are presented with the proteins in this order (greatest percent increase from KO to greatest percent decrease from KO). Panel B, KO female + SP-A1 and SP-A2 treatment (10μg each); Panel C, SP-A2 female + SP-A1 treatment (10μg); Panel D, KO female + SP-A2 treatment (10μg); Panel E, KO male + SP-A1 treatment (10μg); Panel F, KO male + SP-A2 treatment (10μg). Inset: The inset in Panel F shows the expression patterns of the ARC proteins in males after SP-A1 or SP-A2 treatment (arranged by the SP-A1 treatment order) to facilitate comparison of these two treatments. Yellow bars with asterisks are proteins with significant changes (p<0.05) from KO + Vehicle. Numbers of proteins from the reference gel can be seen for each bar on the x-axis (see Fig. 2 and Supp. File 3 for protein names).
Figure 8
Figure 8
Pathway diagram for ARC proteins after SP-A1 treatment. A diagram from Ingenuity Pathways Analysis is shown for some of the ARC proteins identified in this study. Red spots are increased relative to KO values and green spots are decreased. A. Changes in the pathways after KO males were treated with SP-A1. B. Changes in the pathways after KO females were treated with SP-A1. C. Histogram showing percent change from KO values (on y-axis) after SP-A1 treatment in males (light bars) and females (dark bars) for proteins depicted in the pathway diagram.
Figure 9
Figure 9
Pathway diagram for ARC proteins from SP-A2 transgenic mice. A diagram from Ingenuity Pathways Analysis is shown for some of the ARC proteins identified in this study. Red spots are increased relative to KO values and green spots are decreased. A. Changes in the pathways when KO males were compared with SP-A2 transgenic males. B. Changes in the pathways when KO females were compared with SP-A2 transgenic females. C. Histogram showing percent change from KO values (on y-axis) in SP-A2 transgenics in males (light bars) and females (dark bars) for proteins depicted in the pathway diagram.

Similar articles

Cited by

References

    1. Goto H, Ledford JG, Mukherjee S, Noble PW, Williams KL, Wright JR. The role of surfactant protein A in bleomycin-induced acute lung injury. Am J Respir Crit Care Med. 2010;181:1336–1344. - PMC - PubMed
    1. Gil HW, Oh MH, Woo KM, Lee EY, Oh MH, Hong SY. Relationship between pulmonary surfactant protein and lipid peroxidation in lung injury due to paraquat intoxication in rats. Korean J Intern Med. 2007;22:67–72. - PMC - PubMed
    1. Madan T, Reid KB, Clark H, Singh M, Nayak A, Sarma PU, et al. Susceptibility of mice genetically deficient in SP-A or SP-D gene to invasive pulmonary aspergillosis. Mol Immunol. 2010;47:1923–1930. - PubMed
    1. Famuyide ME, Hasday JD, Carter HC, Chesko KL, He JR, Viscardi RM. Surfactant protein-A limits Ureaplasma-mediated lung inflammation in a murine pneumonia model. Pediatr Res. 2009;66:162–167. - PMC - PubMed
    1. George CL, Goss KL, Meyerholz DK, Lamb FS, Snyder JM. Surfactant-associated protein A provides critical immunoprotection in neonatal mice. Infect Immun. 2008;76:380–390. - PMC - PubMed

Publication types

MeSH terms