. 2014 Jul 14;26(1):33-47.
doi: 10.1016/j.ccr.2014.05.005. Epub 2014 Jun 19.

Quiescent sox2(+) cells drive hierarchical growth and relapse in sonic hedgehog subgroup medulloblastoma

Affiliations

Quiescent sox2(+) cells drive hierarchical growth and relapse in sonic hedgehog subgroup medulloblastoma

Robert J Vanner et al. Cancer Cell. .

Abstract

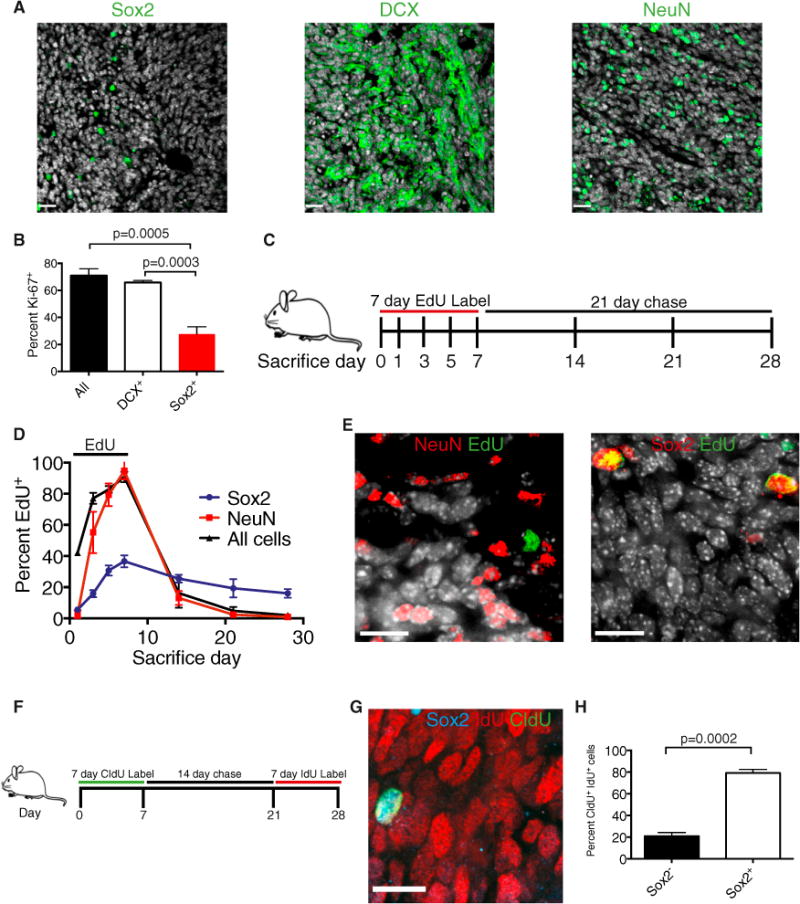
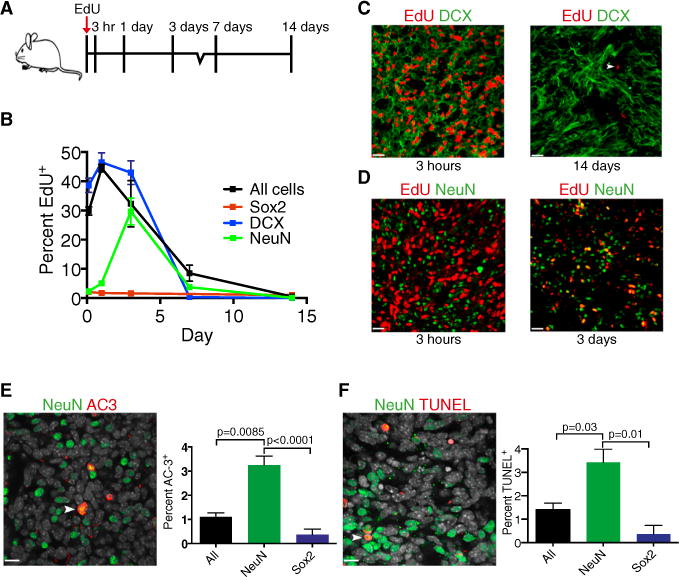
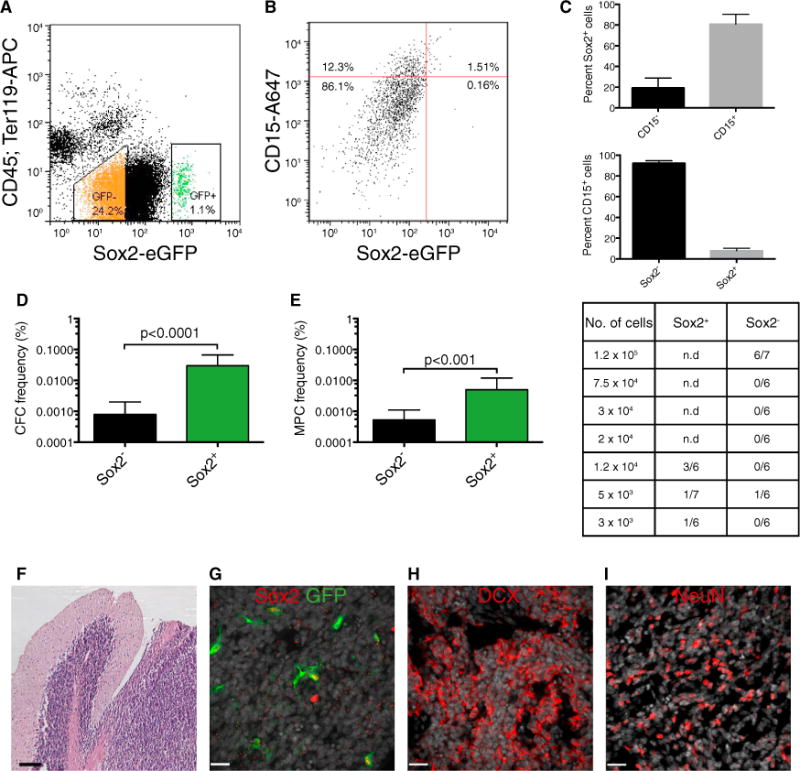
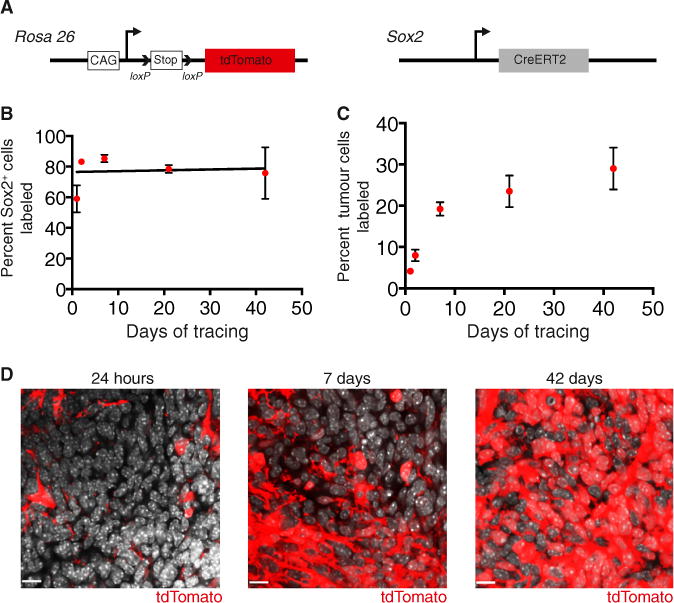
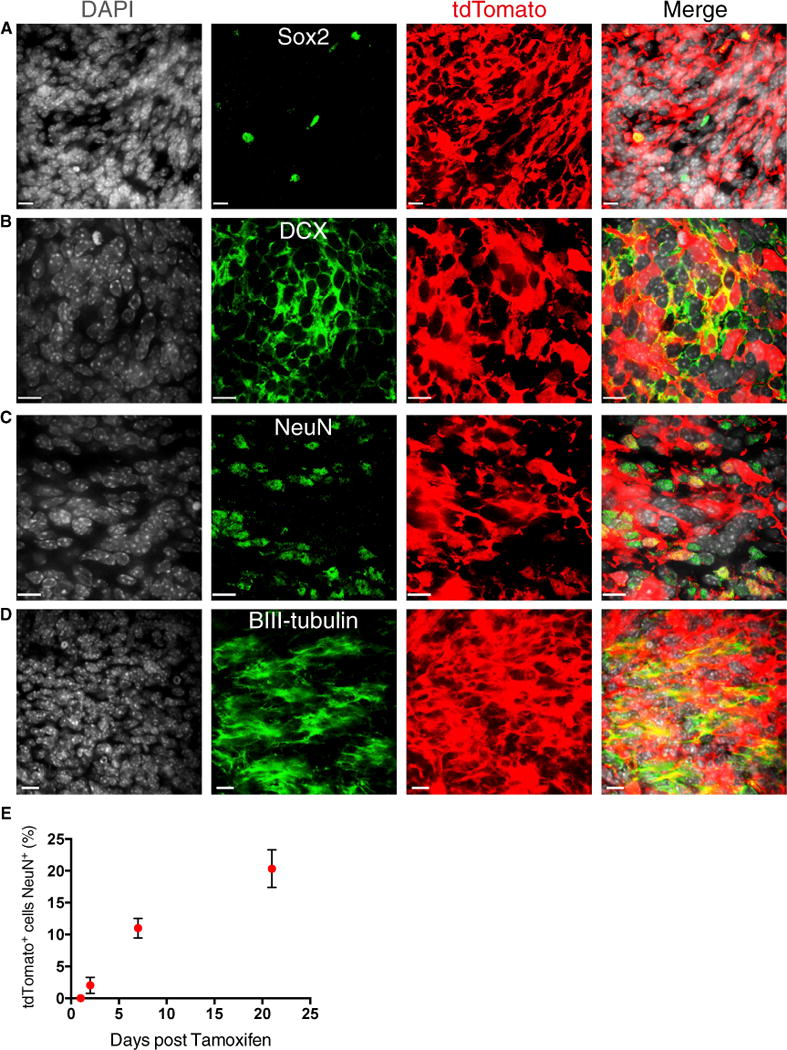
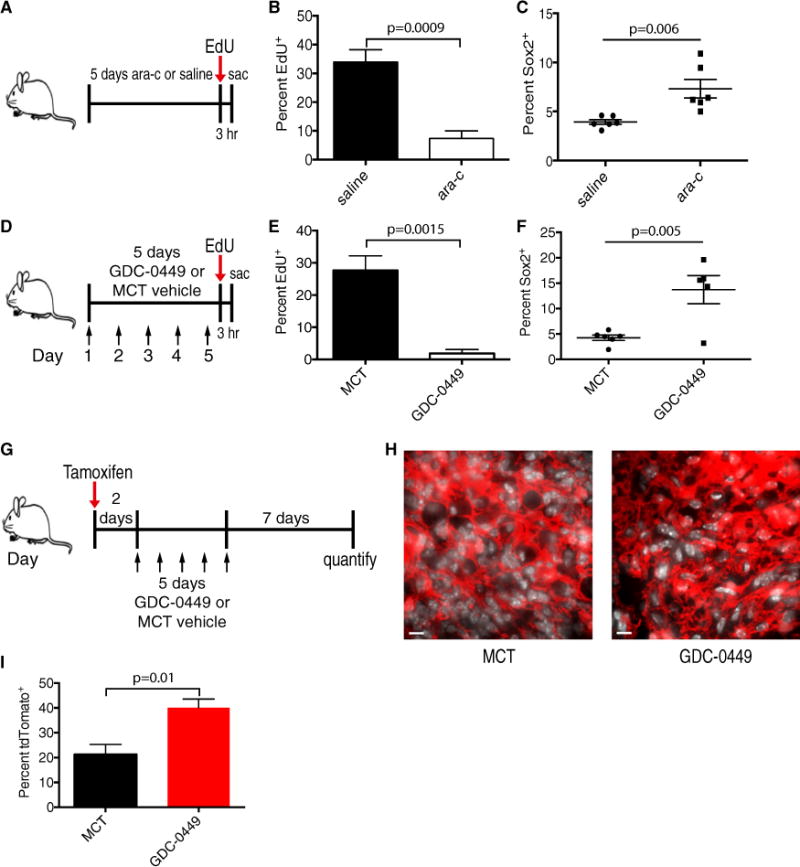
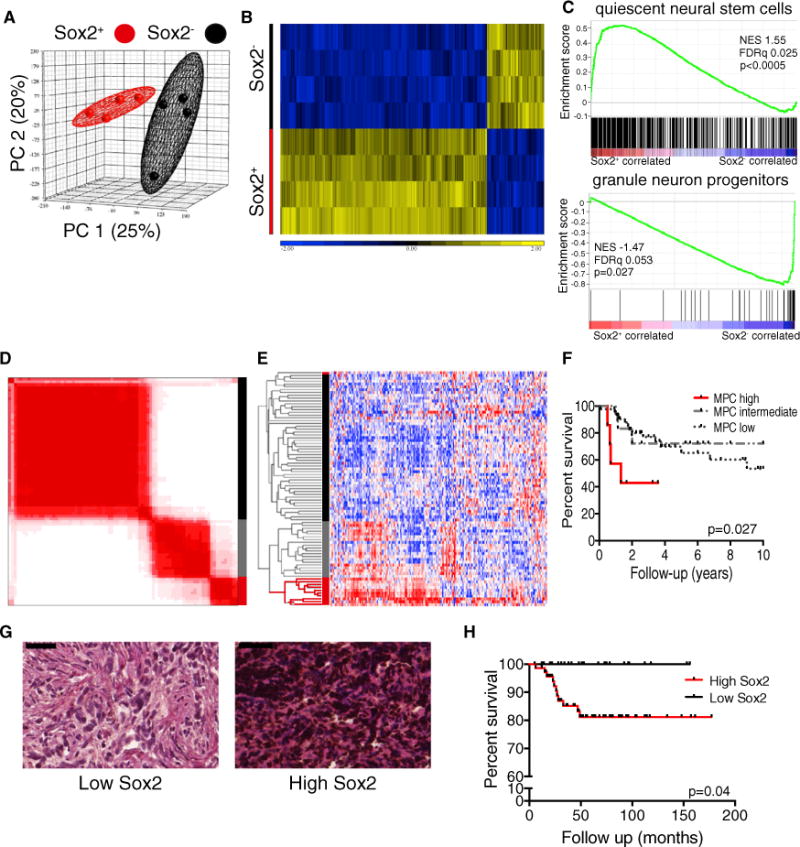
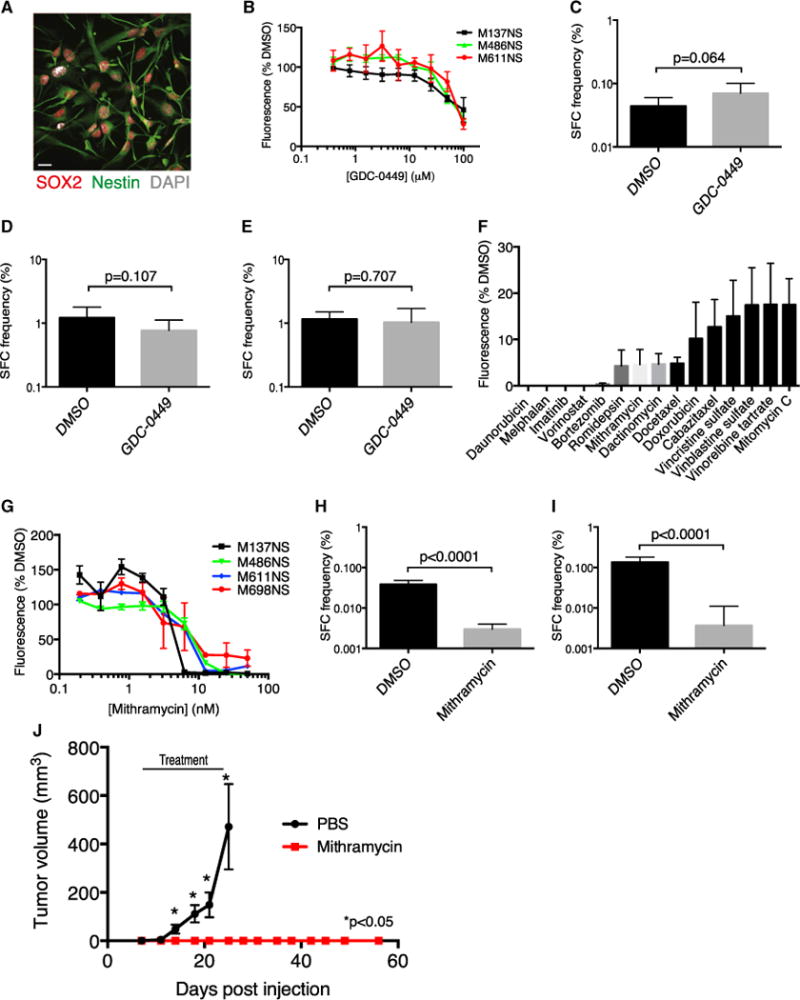
Functional heterogeneity within tumors presents a significant therapeutic challenge. Here we show that quiescent, therapy-resistant Sox2(+) cells propagate sonic hedgehog subgroup medulloblastoma by a mechanism that mirrors a neurogenic program. Rare Sox2(+) cells produce rapidly cycling doublecortin(+) progenitors that, together with their postmitotic progeny expressing NeuN, comprise tumor bulk. Sox2(+) cells are enriched following anti-mitotic chemotherapy and Smoothened inhibition, creating a reservoir for tumor regrowth. Lineage traces from Sox2(+) cells increase following treatment, suggesting that this population is responsible for relapse. Targeting Sox2(+) cells with the antineoplastic mithramycin abrogated tumor growth. Addressing functional heterogeneity and eliminating Sox2(+) cells presents a promising therapeutic paradigm for treatment of sonic hedgehog subgroup medulloblastoma.


Figures

Figure 1
Figure 1. Sox2+ Ptc MB Cells Are Quiescent
(A) Representative images of Ptc MB containing Sox2+ cells (<5%), DCX-expressing cells (60%), and NeuN-expressing cells (30%). DAPI is shown in white. Scale bars, 25 μm. (B) Frequency of Ki67 expression in primary tumor cells: all counts, DCX+ cells, and Sox2+ cells (n = 3, mean ± SEM, two-tailed unpaired t test). (C) Experimental design for (D) and (E). 31-day-old Ptc mice were administered 0.82 mg/mL EdU drinking water for 7 days (experimental days 0–7), followed by a 21-day chase. Mice were sacrificed on the indicated days of label or chase. (D) The frequency of all EdU+ cells as well as NeuN+ and Sox2+ cells that are also EdU+ was quantified from primary tumor sections throughout the labeling and chase (n = 3 per group, mean ± SEM). (E) Representative immunofluorescence images at the end of the chase (day 28). DAPI is shown in white. Scale bars, 14 μm. (F) Experimental design for (G) and (H). 31-day-old Ptc mice were administered (0.74 mg/ml) CldU drinking water for 7 days, returned to normal drinking water for 2 weeks, and were then administered (1 mg/ml) IdU drinking water for 7 days. Mice were sacrificed at the end of the IdU labeling (day 28). (G) A representative immunofluorescence image of a Sox2+ cell that retained the CldU label and acquired IdU. Scale bar, 14 μm. (H) The frequency of Sox2-expressing cells within the CldU+ IdU+ population at day 28 (n = 3 per group, mean ± SEM, two-tailed unpaired t test). See also Figure S1.
Figure 2
Figure 2. NeuN+ Cells Are the Short-Lived, Differentiated Progeny of Cycling DCX+ Cells
(A) Experimental design for (B–D). Ptc mice were injected with 30 mg/kg EdU and sacrificed at successive time points thereafter. (B) The frequency of all EdU+ cells as well as DCX+, NeuN+, and Sox2+ cells that were also EdU+ was quantified in primary tumor sections at each postinjection time point (n = 3 per group, mean ± SEM). (C) Representative immunofluorescence images of DCX and EdU at 3 hr and 14 days postinjection. The arrowhead indicates a rare EdU+ label-retaining cell. Scale bars, 20 μm. (D) Representative immunofluorescence images of NeuN and EdU at 3 hr and 3 days postinjection. Scale bars, 20 μm. (E) Representative image of activated caspase 3+ (AC3) NeuN+ cells (arrowhead). The frequency of AC3 events in all cells, NeuN+ cells, and Sox2+ primary tumor cells is quantified (n = 3 [all], n = 3 [Sox2], n = 8 [NeuN], mean ± SEM, two-tailed unpaired t test [NeuN versus all and NeuN versus Sox2]). DAPI is shown in white. Scale bars, 14 μm. (F) Representative image of TUNEL staining in NeuN+ cells (arrowhead). The frequency of TUNEL events in all, NeuN+ cells, and Sox2+ primary tumor cells is quantified (n = 3 per group, mean ± SEM, two-tailed unpaired t test [NeuN versus all and NeuN versus Sox]). DAPI is shown in white. Scale bars, 14 μm. See also Figure S2.
Figure 3
Figure 3. Sox2+ MB Cells Are Tumor Propagating
(A) Representative gating scheme with typical GFP+ and GFP frequencies for FACS of a Ptc; Sox2-eGFP tumor depleted for cells expressing CD45 or Ter-119. (B) Typical FACS plot showing CD15+ and Sox2+ cell frequencies in primary Ptc; Sox2-eGFP tumor cells. (C) Breakdown of Sox2+ cells by their expression of CD15 (top) and CD15+ cells by their expression of Sox2 (bottom) (n = 3 per group, mean ± SEM). n.d., no data. (D) In vitro limiting dilution analysis comparing colony-forming cell (CFC) frequency in primary Sox2+ and Sox2 Ptc tumor cells. (estimate plus upper limit, χ2 = 34.0, p < 0.0001). (E) In vivo limiting dilution analysis comparing medulloblastoma-propagating cell (MPC) frequency of primary Sox2+ and Sox2 Ptc tumor cells. A summary of the frequency of allograft formation at each cell dose injected is shown at the right (estimate plus upper limit, χ2 = 11.1, p < 0.001). (F) Representative hematoxylin and eosin stain of an allograft tumor derived from Sox2-eGFP+ cells. Scale bar, 100 μm. (G) Representative Sox2 and GFP colocalization in an allograft tumor derived from Sox2-eGFP+ cells. DAPI is shown in white. Scale bar, 20 μm. (H and I) Representative DCX (H) and NeuN (I) expression in an allograft tumor derived from Sox2-eGFP+ cells. DAPI is shown in white. Scale bar, 20 μm. See also Figure S3.
Figure 4
Figure 4. Sox2+ Cells Propagate Ptc MBs In Situ
(A) To perform lineage tracing in MB, mice with a loxP-stop-loxP tdTomato reporter gene at the Rosa 26 locus and Sox2creER knock in mice were crossed to the Ptc model. (B) Quantification of the frequency of cells labeled with tdTomato within the Sox2+ tumor population following a 5 mg tamoxifen injection (n = 3–5 per time point, mean ± SEM). (C) Quantification of tdTomato labeling of tumor cells following a 5 mg tamoxifen injection (n = 4–6 per time point, mean ± SEM). (D) Representative images of tumor labeling with tdTomato at 24 hr, 7 days, and 42 days post-tamoxifen. DAPI is shown in white. Scale bar, 11 μm. See also Figure S4.
Figure 5
Figure 5. Sox2+ Cells Self-renew and Differentiate to grow Ptc MB
(A–D) Representative image of tdTomato labeled Sox2+ (A), DCX+ (B), NeuN+ (C), and βIII-tubulin+ (D) cells at 21 days of tracing. Scale bars, 11 μm. (E) The fraction of tdTomato+ tumor cells that are NeuN+ increases over time (n = 3 per time point, mean ± SEM). Scale bars, 11 μm. See also Figure S5.
Figure 6
Figure 6. MPCs Are Enriched following Antimitotic Chemotherapy and Smoothened Inhibition
(A) Day 70 Ptc mice were administered 2% Ara-C or saline vehicle intracranially bymicro-osmotic pump for 5 days and then injected with 30 mg/kg EdU 3 hr prior to sacrifice (sac) on treatment day 5. (B) Quantification of EdU incorporation in saline- and Ara-C-treated Ptc tumors (n = 4 per group, mean ± SEM, two-tailed unpaired t test). (C) Quantification of Sox2+ cell frequency in saline and Ara-C treated Ptc tumors (n = 6 per group, mean ± SEM, two-tailed unpaired t test). (D) Day 70 Ptc mice were administered methylcellulose Tween 80 (methylcellulose Tween [MCT]) vehicle or 50 mg/kg GDC-0449 once daily for 5 days (arrows) and injected with 30 mg/kg EdU 3 hr prior to sacrifice. (E) Quantification of EdU incorporation in MCT- and GDC-0449-treated tumors (n = 5 per group, mean ± SEM, two-tailed unpaired t test). (F) Quantification of Sox2+ cell frequency in MCT- and GDC-0449-treated tumors (n = 5 per group, mean ± SEM, two-tailed unpaired t test). (G) Day70 Ptc; Sox2creER; loxP-stop-loxP tdTomato mice were administered tamoxifen 48 hr prior toa 5-day treatment with 50 mg/kg GDC-0449 orMCT vehicle once daily (arrows) and were chased for 7 days post-therapy. (H) Representative images of tdTomato labeling in MCT vehicle- or GDC-0449-treated tumors 7 days post-treatment. DAPI is shown in white. Scale bars, 40 μm. (I) Quantification of (H) (n = 4 mice per group, mean ± SEM, two-tailed unpaired t test). See also Figure S6.
Figure 7
Figure 7. Sox2+ MB Cells Have a Quiescent Stem Cell Gene Signature that Predicts a Poor Prognosis in Human SHH MB
(A) Principle component analysis of gene expression profiles of primary Sox2+ and Sox2 Ptc cells (n = 4 per group). (B) Hierarchical clustering of four matched primary Sox2+ and Sox2 samples based on the 628 genes expressed differentially between the two groups (one-way ANOVA, FDR < 0.05, fold change is shown). (C) GSEA comparing Sox2+ and Sox2 cells for enrichment of a quiescent neural stem cell gene set (top) and a granule neuron progenitor gene set (bottom). NES, normalized enrichment score. (D) Consensus clustering by k-means of 82 SHH subgroup MBs based on a mouse MPC gene signature yields three distinct groups. (E) Hierarchical clustering of 82 SHH subgroup MBs based on a mouse MPC gene signature yields three identical groups to consensus clustering except for one outlier. (F) Kaplan-Meier curve showing overall survival of patients with high, intermediate, or low expression of a MPC gene signature (n = 76, log rank test). (G) Representative images from a tissue microarray of human MB samples exhibiting low and high frequency of SOX2+ cells. SOX2 reactivity was detected using 3,3′-diaminobenzidine (brown), and tissues were counterstained with hematoxylin and eosin. Scale bar, 50 μm. (H) Kaplan-Meier curve showing overall survival of SHH MB patients with high or low frequencies of Sox2+ cells (n = 98, log rank test). See also Figure S7 and Table S1.
Figure 8
Figure 8. SOX2+ Cells Can Be Targeted Using Mithramycin
(A) A representative immunofluorescence image of cells derived from a human SHH MB tumor expressing SOX2 and the neural stem cell marker nestin. Scale bar, 20 μm. (B) Human SHH MB cell viability was measured by Alamar Blue fluorescence at 591 nm after 5 days of treatment with increasing concentrations of GDC-0449 (mean ± SEM normalized to DMSO control). (C) In vitro LDA comparing sphere-forming cell (SFC) frequency of primary Ptc cells treated with the DMSO control or 5 μM GDC-0449 (χ2 = 03.42, p = 0.064). (D and E) Primary human SHH MB cells from patient M693 (χ2 = 2.6, p = 0.107 [D]) or patient M698 (χ2 = 0.141, p = 0.707 [E]) were plated in an in vitro LDA comparing SFC frequency in neural stem cell medium containing DMSO or 5 μM GDC-0449. (F) The top 15 hits from a screen of four human SHH MB cultures with the NCI oncology drug set. Cell viability was assessed by Alamar Blue fluorescence at 591 nm (n = 4, mean ± SEM, normalized to DMSO). (G) Human SHH-MB cell viability was measured by Alamar Blue fluorescence at 591 nm after 5 days of treatment with increasing doses of mithramycin (mean ± SEM, normalized to DMSO). (H) In vitro LDA comparing SFC frequency between primary Ptc cells treated with the DMSO control or 25 nM mithramycin (n = 4 tumors, χ2 = 219, p < 0.0001). (I) Secondary LDA of primary spheres from (H) plated without drug (n = 3 tumors, χ2 = 95.2, p < 0.0001). (J) NSG mice engrafted subcutaneously with 5 × 10⁵ Ptc cells were randomized to receive PBS or 1 mg/kg mithramycin on Monday, Wednesday, and Friday when tumors were first palpable and were treated until mice treated with PBS reached the end point (day 25) (n = 10per group, mean ± SEM).*, p<0.05, two-tailed unpaired t test. Bar charts for LDAs in (C–E), (H), and (I) are shown as estimate plus upper limit. See also Figure S8.

Comment in

References

    1. Ahlfeld J, Favaro R, Pagella P, Kretzschmar HA, Nicolis S, Schüller U. Sox2 requirement in sonic hedgehog-associated medulloblastoma. Cancer Res. 2013;73:3796–3807. - PubMed
    1. Arnold K, Sarkar A, Yram MA, Polo JM, Bronson R, Sengupta S, Seandel M, Geijsen N, Hochedlinger K. Sox2(+) adult stem and progenitor cells are important for tissue regeneration and survival of mice. Cell Stem Cell. 2011;9:317–329. - PMC - PubMed
    1. Bailey P, Cushing H. Medulloblastoma cerebelli: A common type of midcerebellar glioma of childhood. Arch Neurol Psychiatry. 1925;14:192–224.
    1. Chen J, Li Y, Yu TS, McKay RM, Burns DK, Kernie SG, Parada LF. A restricted cell population propagates glioblastoma growth after chemotherapy. Nature. 2012;488:522–526. - PMC - PubMed
    1. Crawford JR, MacDonald TJ, Packer RJ. Medulloblastoma in childhood: new biological advances. Lancet Neurol. 2007;6:1073–1085. - PubMed

MeSH terms

Substances

Associated data