

Women in Charnley class C fail to improve in mobility to a higher degree after total hip replacement
- PMID: 24954483
- PMCID: PMC4105762
- DOI: 10.3109/17453674.2014.931199
Women in Charnley class C fail to improve in mobility to a higher degree after total hip replacement
Abstract
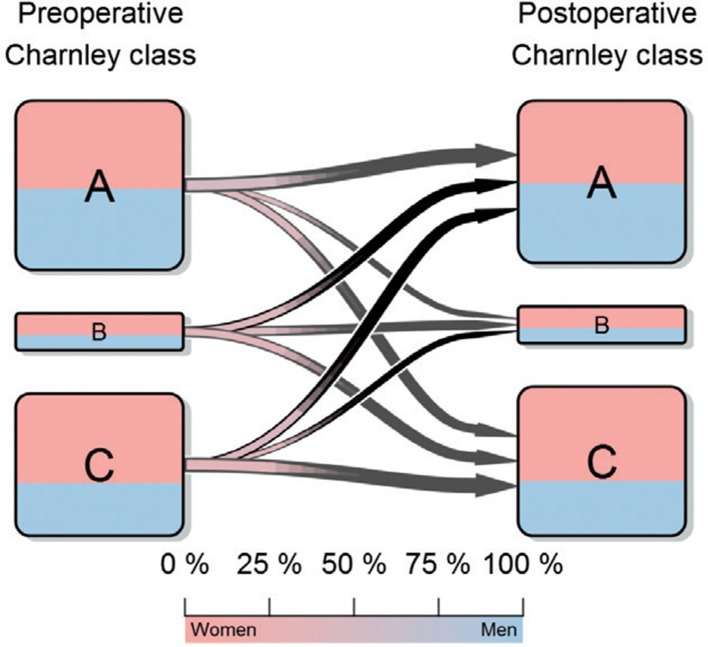
Background: The Charnley comorbidity classification organizes patients into 3 classes: (A) 1 hip involved, (B) 2 hips involved, and (C) other severe comorbidities. Although this simple classification is a known predictor of health-related quality of life (HRQoL) after total hip replacement (THR), interactions between Charnley class, sex, and age have not been investigated and there is uncertainty regarding whether A and B should be grouped together.
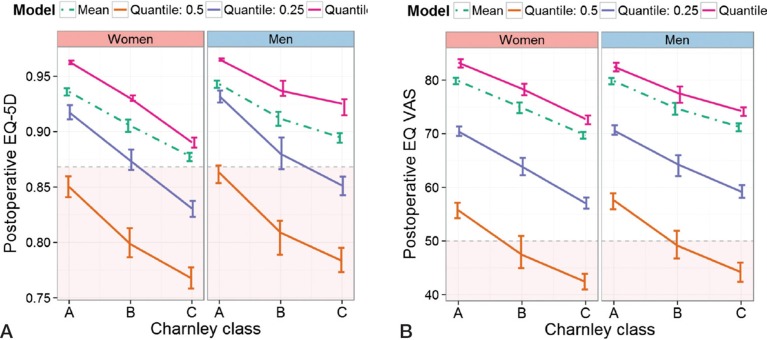
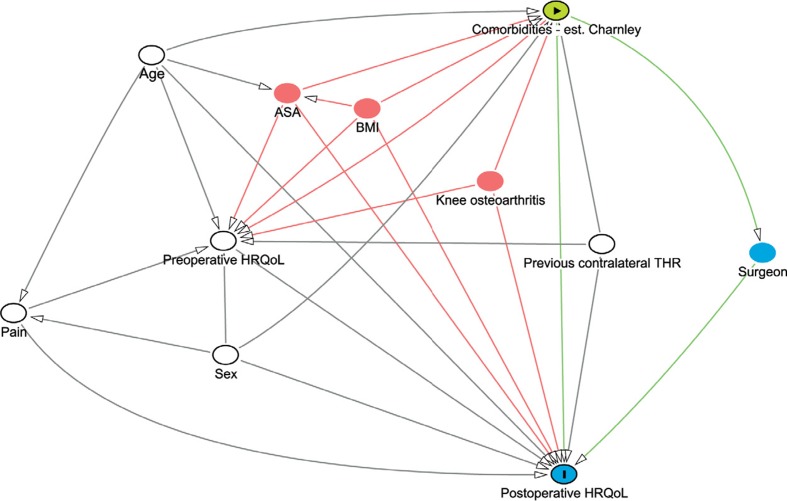
Methods: We selected a nationwide cohort of patients from the Swedish Hip Arthroplasty Register operated with THR due to primary osteoarthritis between 2008 and 2010. For estimation of HRQoL, we used the generic health outcome questionnaire EQ-5D of the EuroQol group. This consists of 2 parts: the EQ-5D index and the EQ VAS estimates. We modeled the EQ-5D index and the EQ VAS against the self-administered Charnley classification. Confounding was controlled for using preoperative HRQoL values, pain, and previous contralateral hip surgery.
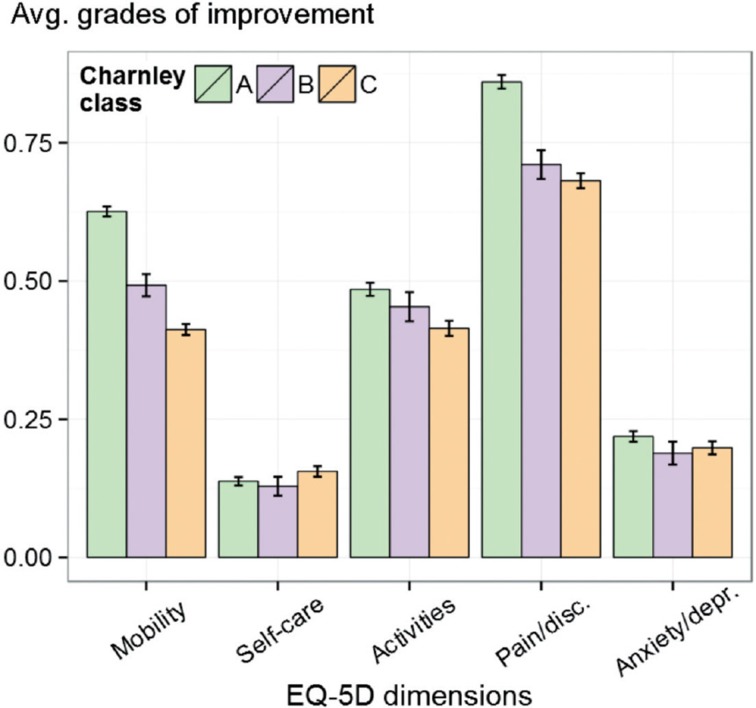
Results: We found that women in class C had a poorer EQ-5D outcome than men. This effect was mostly due to the fact that women failed to improve in the mobility dimension; only 40% improved, while about 50% of men improved. Age did not interact with Charnley class. We also found that the classification performed best without splitting or aggregating classes.
Interpretation: Our results suggests that the self-administered Charnley classification should be used in its full capacity and that it may be interesting to devote special attention to women in Charnley class C.
Figures
Comment in
-
Patient-reported outcome measures in arthroplasty registries Report of the Patient-Reported Outcome Measures Working Group of the International Society of Arthroplasty Registries Part II. Recommendations for selection, administration, and analysis.Acta Orthop. 2016 Jul;87 Suppl 1(Suppl 1):9-23. doi: 10.1080/17453674.2016.1181816. Epub 2016 May 26. Acta Orthop. 2016. PMID: 27228230 Free PMC article.
References
-
- Bjorgul K, Novicoff WM, Saleh KJ. Evaluating comorbidities in total hip and knee arthroplasty: available i... . J Orthop Traumatol. 2010;11:203–9. - PMC - PubMed
-
- Burström K, Johannesson M, Diderichsen F. A comparison of individual and social time trade-off values for health s... . Health Policy. 2006;76(3):359–70. - PubMed
-
- Burström K, Sun S, Gerdtham U-G, Henriksson M, Johannesson M, Levin L-Å, et al. Swedish experience-based value sets for EQ-5D health states . Qual Life Res. 2013;22:1–12. - PMC - PubMed
-
- Callaghan JJ, Dysart SH, Savory CF, Hopkinson WJ. Assessing the results of hip replacement. A comparison of five different... . J Bone Joint Surg (Br) 1990;72(6):1008–9. - PubMed
-
- Charnley J. The long-term results of low-friction arthroplasty of the hip performed ... . J Bone Joint Surg (Br) 1972;54(1):61–76. - PubMed
MeSH terms
LinkOut - more resources
Full Text Sources
Other Literature Sources
Medical