

PHLDA1 expression is controlled by an estrogen receptor-NFκB-miR-181 regulatory loop and is essential for formation of ER+ mammospheres
- PMID: 24954507
- PMCID: PMC4275416
- DOI: 10.1038/onc.2014.180
PHLDA1 expression is controlled by an estrogen receptor-NFκB-miR-181 regulatory loop and is essential for formation of ER+ mammospheres
Abstract
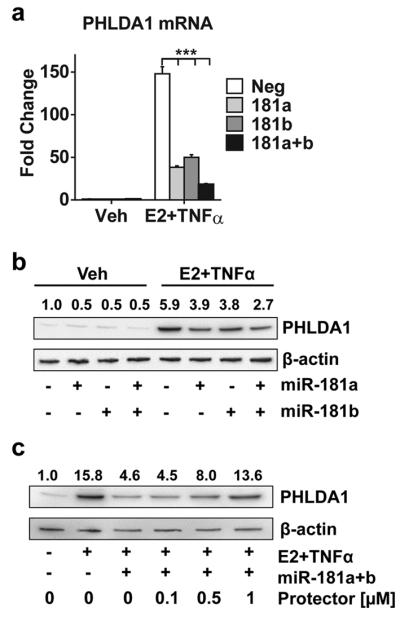
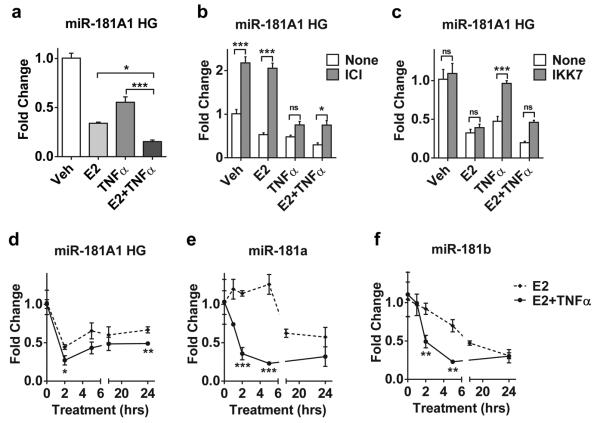
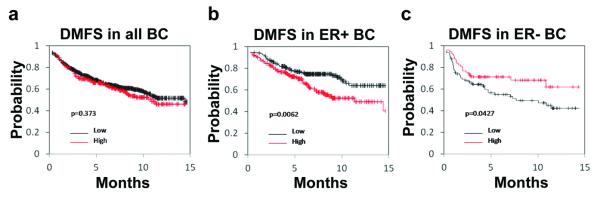
Crosstalk between estrogen receptor (ER) and the inflammatory nuclear factor κB (NFκB) pathway in ER+ breast cancers may contribute to a more aggressive phenotype. Pleckstrin Homology-Like Domain, Family A, member 1 (PHLDA1), a target gene of ER-NFκB crosstalk, has been implicated in cell survival and stem cell properties. 17β-estradiol (E2), acting through ERα, and pro-inflammatory cytokines, acting through NFκB, increase the nascent transcript and PHLDA1 messenger RNA stability, indicating both transcriptional and post-transcriptional control of PHLDA1 expression. We show that PHLDA1 is a direct target of miR-181 and that mature miR-181a and b, as well as their host gene, are synergistically downregulated by E2 and tumor necrosis factor α, also in an ER- and NFκB-dependent manner. Thus, ER and NFκB work together to upregulate PHLDA1 directly through enhanced transcription and indirectly through repression of miR-181a and b. Previous studies have suggested that PHLDA1 may be a stem cell marker in the human intestine that contributes to tumorigenesis. Our findings that PHLDA1 is upregulated in mammospheres (MS) of ER+ breast cancer cells and that PHLDA1 knockdown impairs both MS formation and the expansion of aldehyde dehydrogenase (ALDH)-positive population, suggest that PHLDA1 may play a similar role in breast cancer cells. Upregulation of PHLDA1 in MS is largely dependent on the NFκB pathway, with downregulated miR-181 expression a contributing factor. Over-expression of miR-181 phenocopied PHLDA1 knockdown and significantly impaired MS formation, which was reversed, in part, by protection of the PHLDA1 3' untranslated region (UTR) or overexpression of PHLDA1 lacking the 3'UTR. Furthermore, we find that elevated PHLDA1 expression is associated with a higher risk of distant metastasis in ER+ breast cancer patients. Altogether, these data suggest that high PHLDA1 expression is controlled through an ER-NFκB-miR-181 regulatory axis and may contribute to a poor clinical outcome in patients with ER+ breast tumors by enhancing stem-like properties in these tumors.
Figures


Similar articles
-
Transcriptional up-regulation of PHLDA1 by 17beta-estradiol in MCF-7 breast cancer cells.Braz J Med Biol Res. 2008 Jul;41(7):579-82. doi: 10.1590/s0100-879x2008005000029. Epub 2008 Jun 30. Braz J Med Biol Res. 2008. PMID: 18641796
-
MicroRNA-520/373 family functions as a tumor suppressor in estrogen receptor negative breast cancer by targeting NF-κB and TGF-β signaling pathways.Oncogene. 2012 Sep 13;31(37):4150-63. doi: 10.1038/onc.2011.571. Epub 2011 Dec 12. Oncogene. 2012. PMID: 22158050
-
miR-191/DAB2 axis regulates the tumorigenicity of estrogen receptor-positive breast cancer.IUBMB Life. 2018 Jan;70(1):71-80. doi: 10.1002/iub.1705. Epub 2017 Dec 16. IUBMB Life. 2018. PMID: 29247596
-
Update on the Role of NFκB in Promoting Aggressive Phenotypes of Estrogen Receptor-Positive Breast Cancer.Endocrinology. 2020 Oct 1;161(10):bqaa152. doi: 10.1210/endocr/bqaa152. Endocrinology. 2020. PMID: 32887995 Free PMC article. Review.
-
NFκB affects estrogen receptor expression and activity in breast cancer through multiple mechanisms.Mol Cell Endocrinol. 2015 Dec 15;418 Pt 3(0 3):235-9. doi: 10.1016/j.mce.2014.09.013. Epub 2014 Oct 18. Mol Cell Endocrinol. 2015. PMID: 25450861 Free PMC article. Review.
Cited by
-
Identification of microRNA-181a-5p and microRNA-4454 as mediators of facet cartilage degeneration.JCI Insight. 2016 Aug 4;1(12):e86820. doi: 10.1172/jci.insight.86820. JCI Insight. 2016. PMID: 27699225 Free PMC article.
-
Non-Coding RNAs as Regulators and Markers for Targeting of Breast Cancer and Cancer Stem Cells.Cancers (Basel). 2020 Feb 4;12(2):351. doi: 10.3390/cancers12020351. Cancers (Basel). 2020. PMID: 32033146 Free PMC article. Review.
-
DNA methylation alters transcriptional rates of differentially expressed genes and contributes to pathophysiology in mice fed a high fat diet.Mol Metab. 2017 Feb 3;6(4):327-339. doi: 10.1016/j.molmet.2017.02.001. eCollection 2017 Apr. Mol Metab. 2017. PMID: 28377872 Free PMC article.
-
Multiomics Analysis of the PHLDA Gene Family in Different Cancers and Their Clinical Prognostic Value.Curr Issues Mol Biol. 2024 May 30;46(6):5488-5510. doi: 10.3390/cimb46060328. Curr Issues Mol Biol. 2024. PMID: 38921000 Free PMC article.
-
The Association between Five Genetic Variants in MicroRNAs (rs2910164, rs11614913, rs3746444, rs11134527, and rs531564) and Cervical Cancer Risk: A Meta-Analysis.Biomed Res Int. 2021 Mar 15;2021:9180874. doi: 10.1155/2021/9180874. eCollection 2021. Biomed Res Int. 2021. PMID: 33816633 Free PMC article.
References
-
- Zhou Y, Eppenberger-Castori S, Marx C, Yau C, Scott GK, Eppenberger U, et al. Activation of nuclear factor-kappaB (NFkappaB) identifies a high-risk subset of hormone-dependent breast cancers. Int J Biochem Cell Biol. 2005;37:1130–1144. - PubMed
-
- Jones RL, Rojo F, A’Hern R, Villena N, Salter J, Corominas JM, et al. Nuclear NF-kappaB/p65 expression and response to neoadjuvant chemotherapy in breast cancer. J Clin Pathol. 2011;64:130–135. - PubMed
-
- deGraffenried LA, Chandrasekar B, Friedrichs WE, Donzis E, Silva J, Hidalgo M, et al. NF-kappa B inhibition markedly enhances sensitivity of resistant breast cancer tumor cells to tamoxifen. Ann Oncol. 2004;15:885–890. - PubMed
-
- Riggins RB, Zwart A, Nehra R, Clarke R. The nuclear factor kappa B inhibitor parthenolide restores ICI 182,780 (Faslodex; fulvestrant)-induced apoptosis in antiestrogen-resistant breast cancer cells. Mol Cancer Ther. 2005;4:33–41. - PubMed
Publication types
MeSH terms
Substances
Grants and funding
LinkOut - more resources
Full Text Sources
Other Literature Sources
Medical
Research Materials
