

Ancestral repeats have shaped epigenome and genome composition for millions of years in Arabidopsis thaliana
- PMID: 24954583
- PMCID: PMC4090718
- DOI: 10.1038/ncomms5104
Ancestral repeats have shaped epigenome and genome composition for millions of years in Arabidopsis thaliana
Abstract
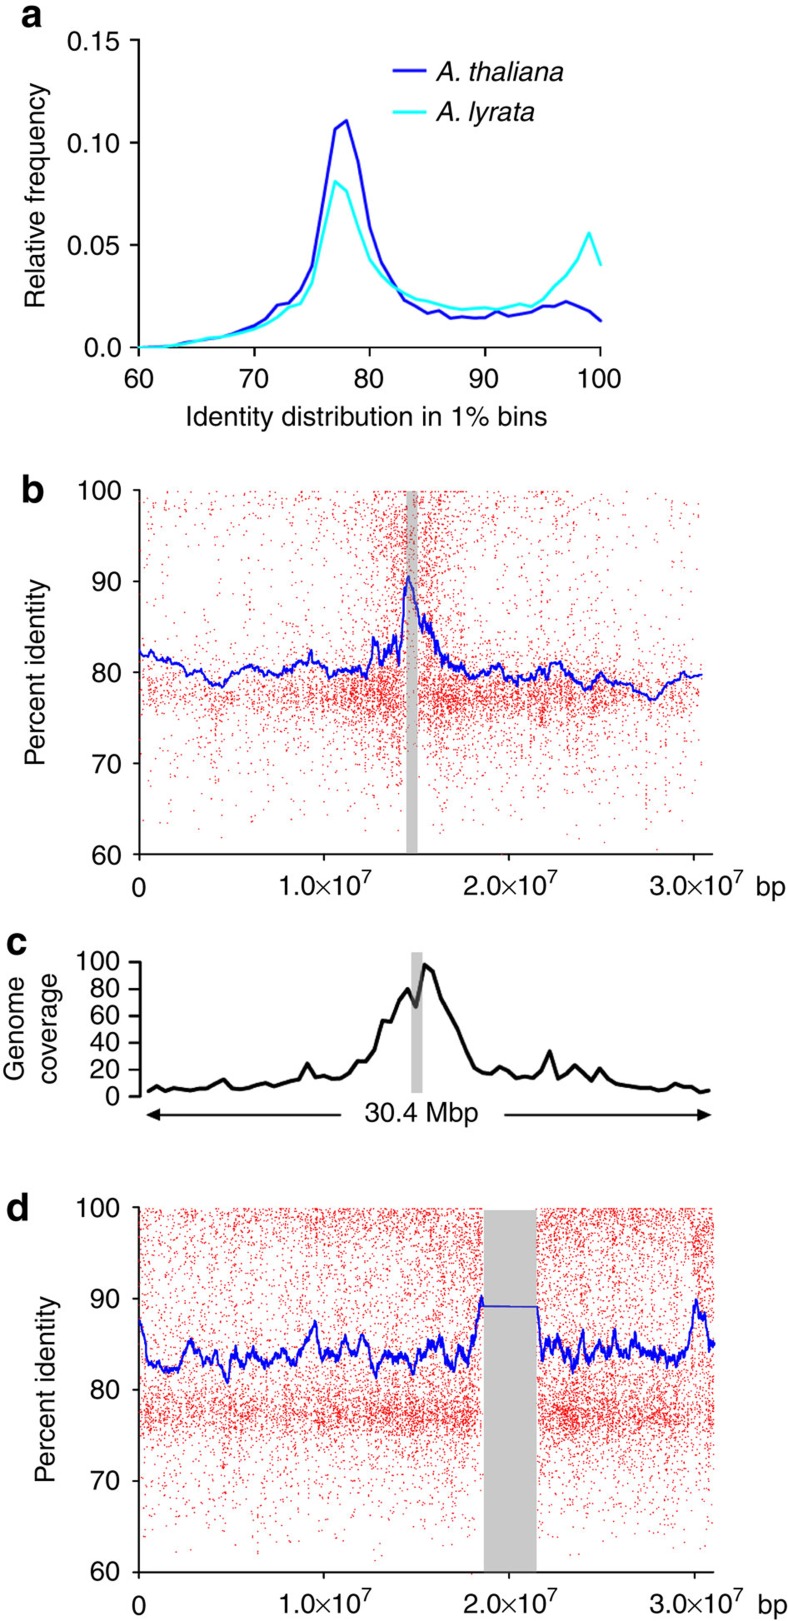
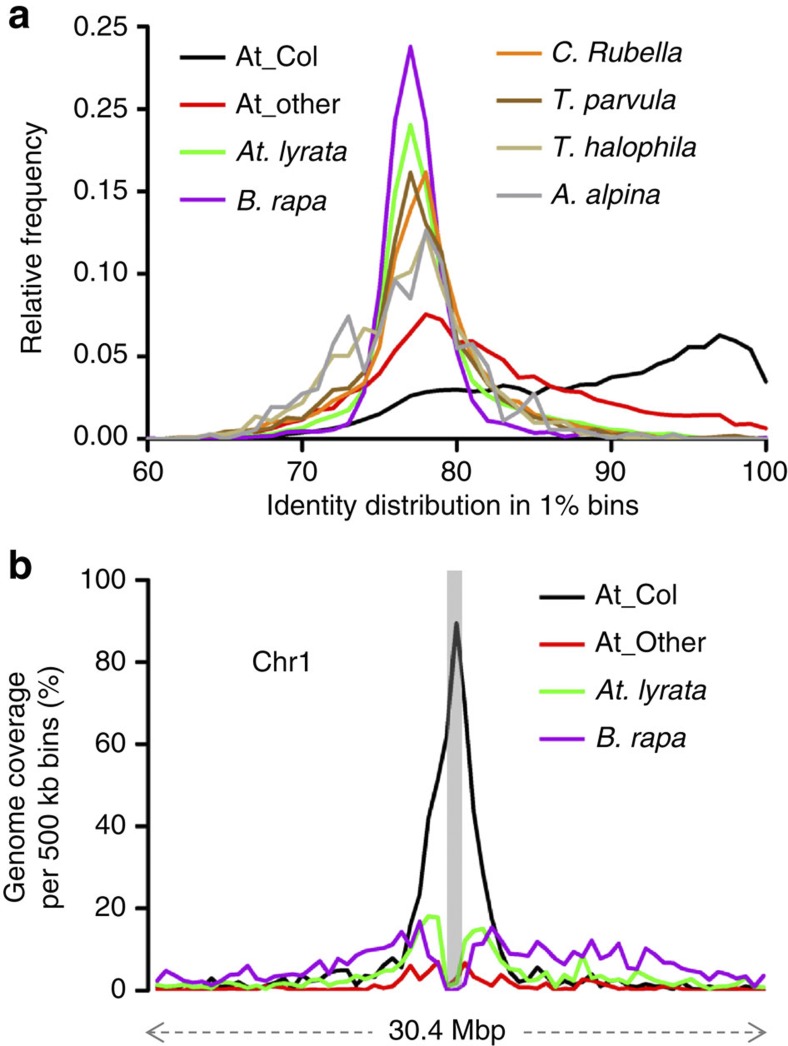
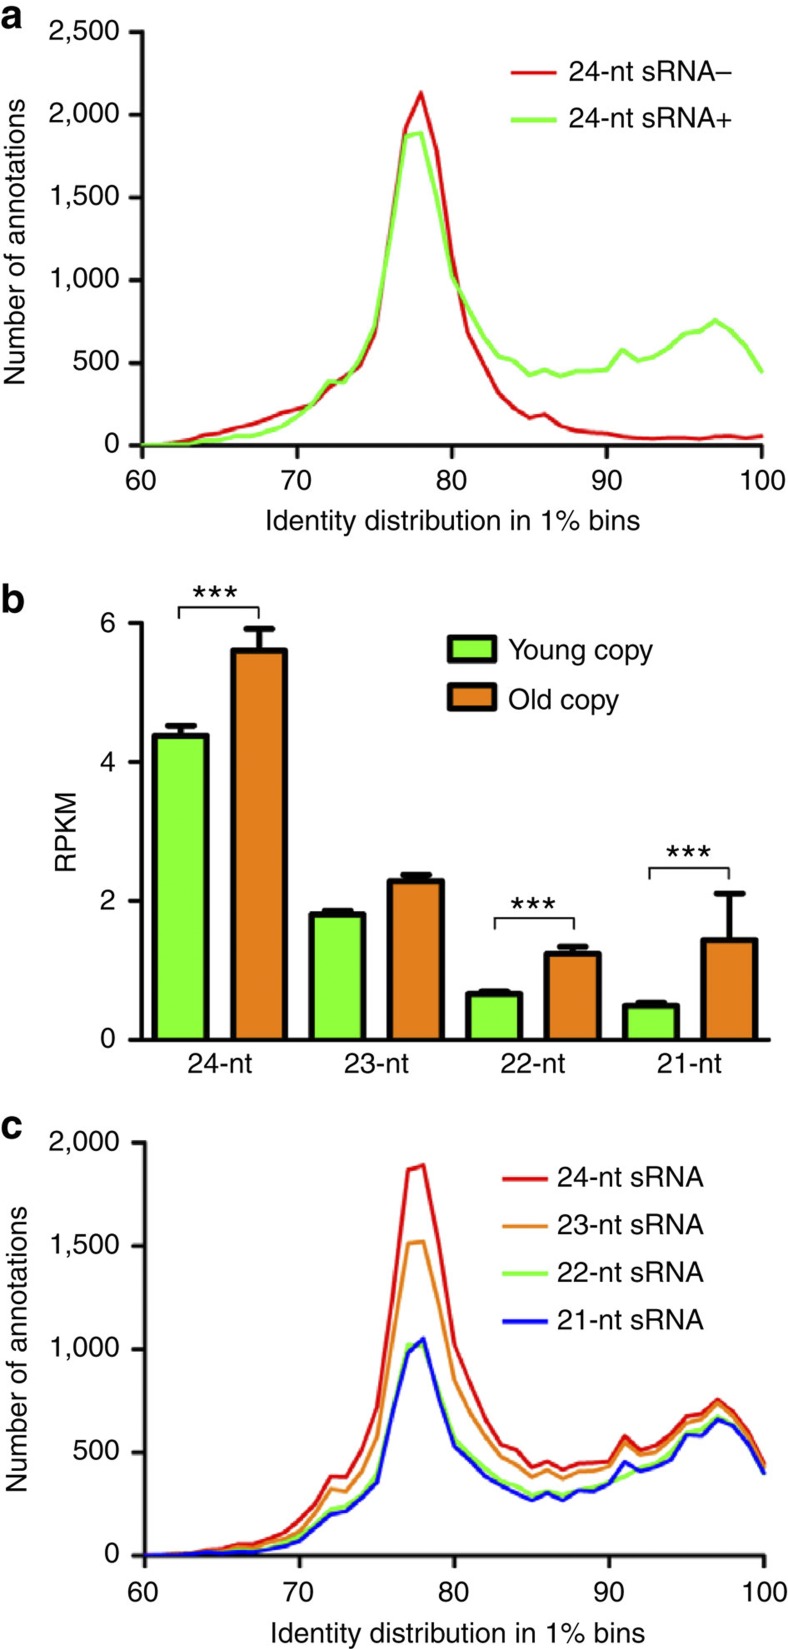
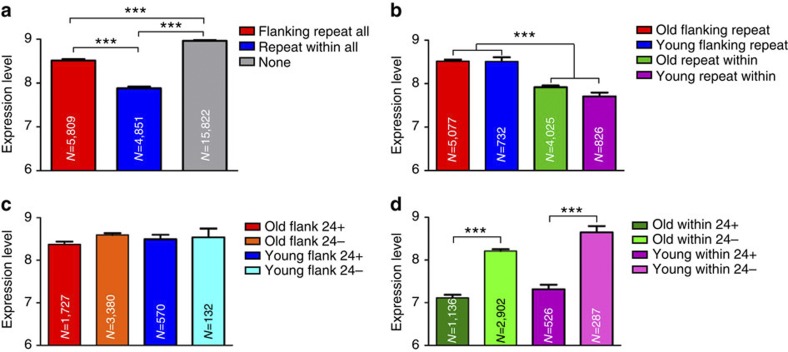
Little is known about the evolution of repeated sequences over long periods of time. Using two independent approaches, we show that the majority of the repeats found in the Arabidopsis thaliana genome are ancient and likely to derive from the retention of fragments deposited during ancestral bursts that occurred early in the Brassicaceae evolution. We determine that the majority of young repeats are found in pericentromeric domains, while older copies are frequent in the gene-rich regions. Our results further suggest that the DNA methylation of repeats through small RNA-mediated pathways can last over prolonged periods of time. We also illustrate the way repeated sequences are composted by mutations towards genomic dark matter over time, probably driven by the deamination of methylcytosines, which also have an impact on epigenomic landscapes. Overall, we show that the ancient proliferation of repeat families has long-term consequences on A. thaliana biology and genome composition.
Figures
Similar articles
-
Deep investigation of Arabidopsis thaliana junk DNA reveals a continuum between repetitive elements and genomic dark matter.PLoS One. 2014 Apr 7;9(4):e94101. doi: 10.1371/journal.pone.0094101. eCollection 2014. PLoS One. 2014. PMID: 24709859 Free PMC article.
-
Epigenetic Distribution of Recombinant Plant Chromosome Fragments in a Human-Arabidopsis Hybrid Cell Line.Int J Mol Sci. 2021 May 21;22(11):5426. doi: 10.3390/ijms22115426. Int J Mol Sci. 2021. PMID: 34063996 Free PMC article.
-
Evolution of DNA methylation patterns in the Brassicaceae is driven by differences in genome organization.PLoS Genet. 2014 Nov 13;10(11):e1004785. doi: 10.1371/journal.pgen.1004785. eCollection 2014 Nov. PLoS Genet. 2014. PMID: 25393550 Free PMC article.
-
Intertwined evolution of plant epigenomes and genomes.Curr Opin Plant Biol. 2021 Jun;61:101990. doi: 10.1016/j.pbi.2020.101990. Epub 2021 Jan 11. Curr Opin Plant Biol. 2021. PMID: 33445143 Review.
-
Piecing together cis-regulatory networks: insights from epigenomics studies in plants.Wiley Interdiscip Rev Syst Biol Med. 2018 May;10(3):e1411. doi: 10.1002/wsbm.1411. Epub 2017 Nov 30. Wiley Interdiscip Rev Syst Biol Med. 2018. PMID: 29194997 Review.
Cited by
-
The Arabidopsis thaliana mobilome and its impact at the species level.Elife. 2016 Jun 3;5:e15716. doi: 10.7554/eLife.15716. Elife. 2016. PMID: 27258693 Free PMC article.
-
Satellitome Analysis of Rhodnius prolixus, One of the Main Chagas Disease Vector Species.Int J Mol Sci. 2021 Jun 3;22(11):6052. doi: 10.3390/ijms22116052. Int J Mol Sci. 2021. PMID: 34205189 Free PMC article.
-
TIPPo: A User-Friendly Tool for De Novo Assembly of Organellar Genomes with High-Fidelity Data.Mol Biol Evol. 2025 Jan 6;42(1):msae247. doi: 10.1093/molbev/msae247. Mol Biol Evol. 2025. PMID: 39800935 Free PMC article.
-
What Can Long Terminal Repeats Tell Us About the Age of LTR Retrotransposons, Gene Conversion and Ectopic Recombination?Front Plant Sci. 2020 May 20;11:644. doi: 10.3389/fpls.2020.00644. eCollection 2020. Front Plant Sci. 2020. PMID: 32508870 Free PMC article.
-
Distinct Life Histories Impact Dikaryotic Genome Evolution in the Rust Fungus Puccinia striiformis Causing Stripe Rust in Wheat.Genome Biol Evol. 2020 May 1;12(5):597-617. doi: 10.1093/gbe/evaa071. Genome Biol Evol. 2020. PMID: 32271913 Free PMC article.
References
-
- Orgel L. E. & Crick F. H. C. Selfish DNA: the ultimate parasite. Nature 284, 604–607 (1980). - PubMed
-
- SanMiguel P., Gaut B. S., Tikhonov A., Nakajima Y. & Bennetzen J. L. The paleontology of intergene retrotransposons of maize. Nat. Genet. 20, 43–45 (1998). - PubMed
-
- Capy P., Gasperi G., Biemont C. & Bazin C. Stress and transposable elements: co-evolution or useful parasites? Heredity (Edinb) 85, (Pt 2): 101–106 (2000). - PubMed
-
- Casacuberta E. & Gonzalez J. The impact of transposable elements in environmental adaptation. Mol. Ecol. 22, 1503–1517 (2013). - PubMed
Publication types
MeSH terms
LinkOut - more resources
Full Text Sources
Other Literature Sources
