

Network based analyses of gene expression profile of LCN2 overexpression in esophageal squamous cell carcinoma
- PMID: 24954627
- PMCID: PMC4066265
- DOI: 10.1038/srep05403
Network based analyses of gene expression profile of LCN2 overexpression in esophageal squamous cell carcinoma
Abstract
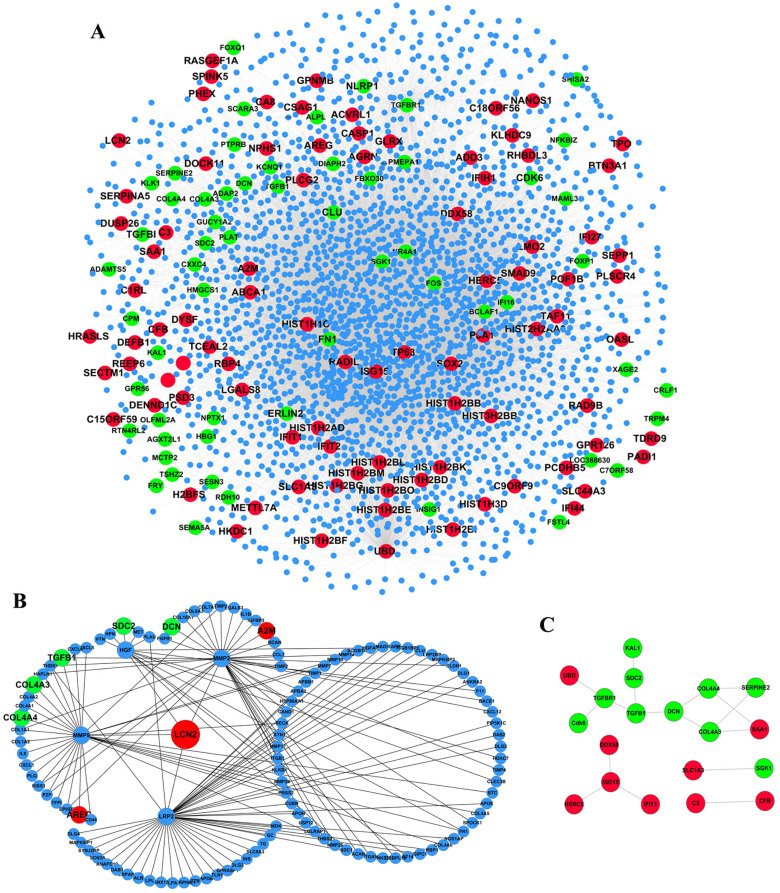
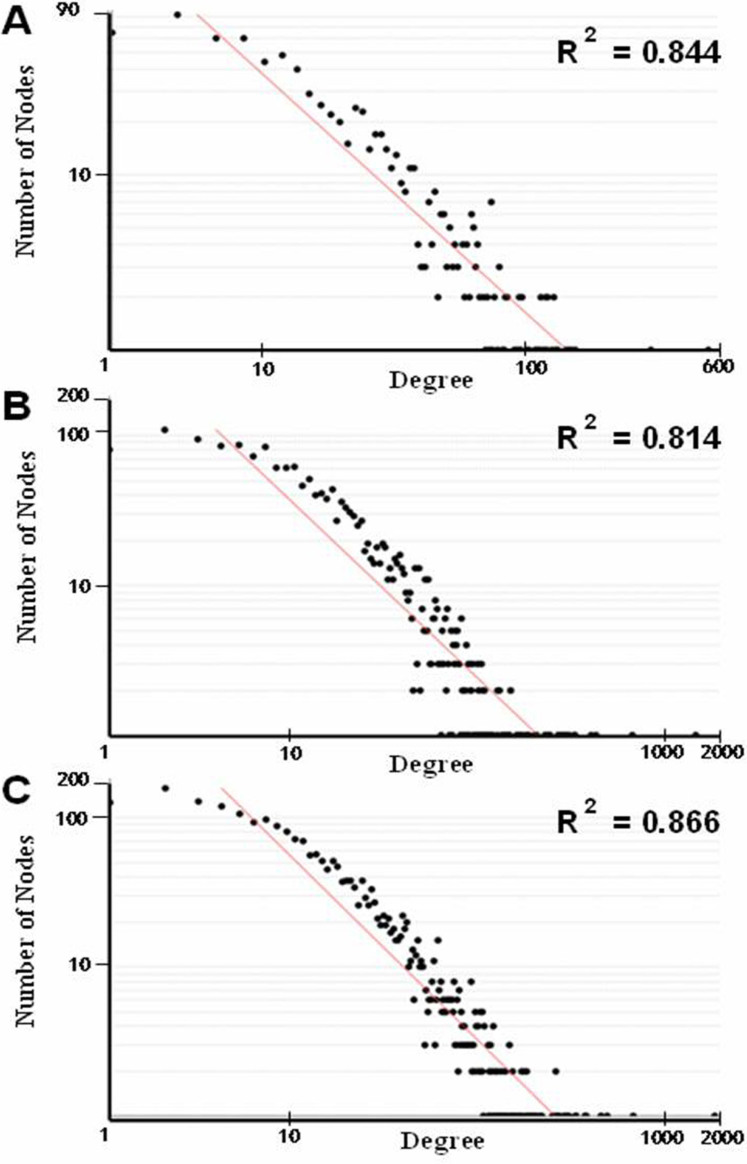
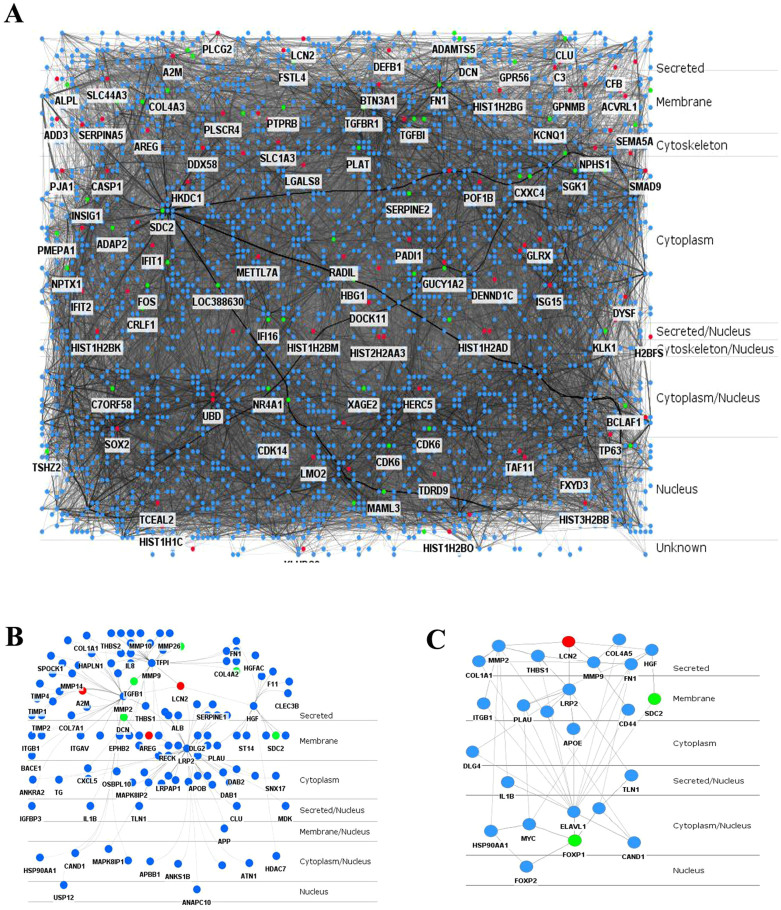
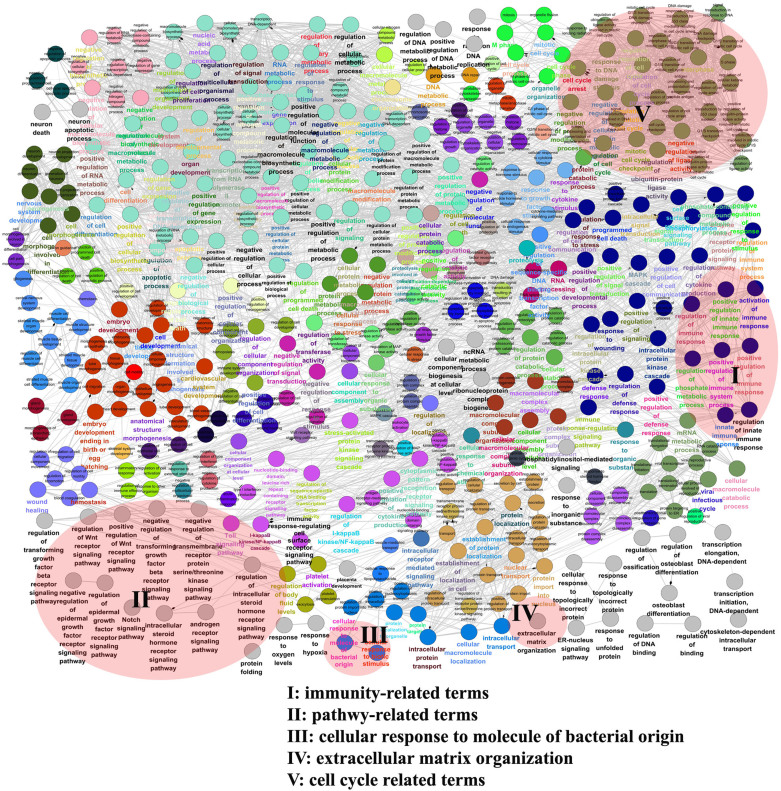
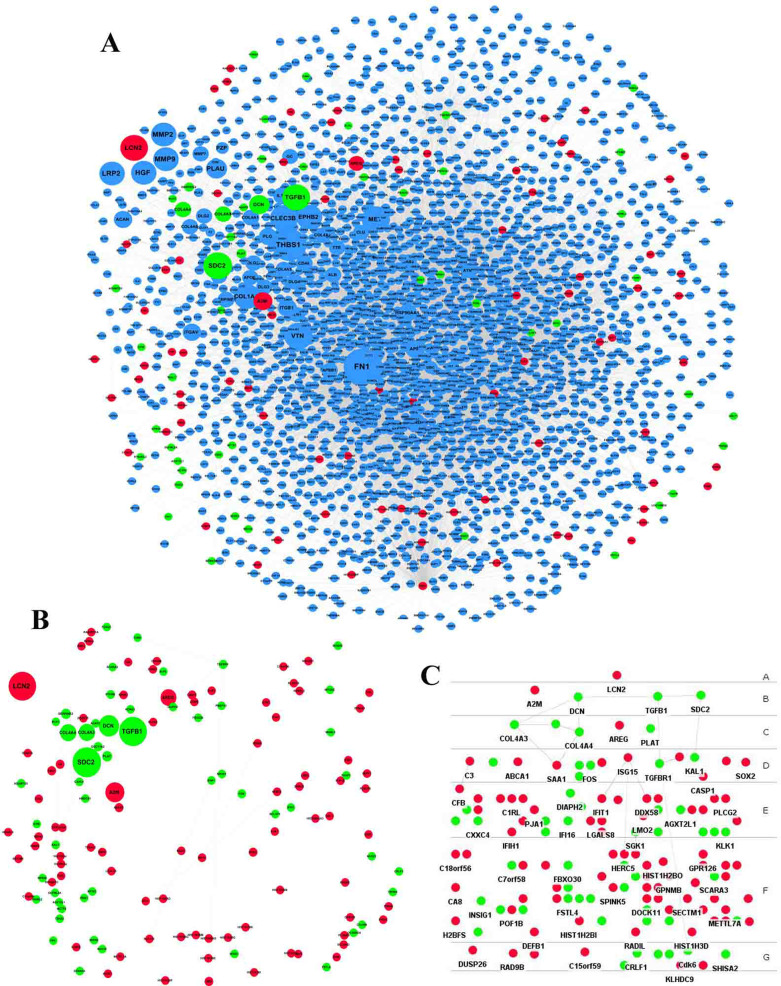
LCN2 (lipocalin 2) is a member of the lipocalin family of proteins that transport small, hydrophobic ligands. LCN2 is elevated in various cancers including esophageal squamous cell carcinoma (ESCC). In this study, LCN2 was overexpressed in the EC109 ESCC cell line and we applied integrated analyses of the gene expression data to identify protein-protein interactions (PPI) network to enhance our understanding of the role of LCN2 in ESCC. Through further mining of PPI sub-networks, hundreds of differentially expressed genes (DEGs) were identified to interact with thousands of other proteins. Subcellular localization analyses found the DEGs and their directly or indirectly interacting proteins distributed in multiple layers, which was applied to analyze the possible paths between two DEGs. Gene Ontology annotation generated a functional annotation map and found hundreds of significant terms, especially those associated with the known and potential roles of LCN2 protein. The algorithm of Random Walk with Restart was applied to prioritize the DEGs and identified several cancer-related DEGs ranked closest to LCN2 protein. These analyses based on PPI network have greatly expanded our understanding of the mRNA expression profile of LCN2 overexpression for future examination of the roles and mechanisms of LCN2.
Figures
Similar articles
-
Lipocalin 2 promotes the migration and invasion of esophageal squamous cell carcinoma cells through a novel positive feedback loop.Biochim Biophys Acta. 2015 Oct;1853(10 Pt A):2240-50. doi: 10.1016/j.bbamcr.2015.07.007. Epub 2015 Jul 17. Biochim Biophys Acta. 2015. PMID: 26190820
-
PPI network analysis of mRNA expression profile of ezrin knockdown in esophageal squamous cell carcinoma.Biomed Res Int. 2014;2014:651954. doi: 10.1155/2014/651954. Epub 2014 Jul 14. Biomed Res Int. 2014. PMID: 25126570 Free PMC article.
-
Functional analysis of the mRNA profile of neutrophil gelatinase‑associated lipocalin overexpression in esophageal squamous cell carcinoma using multiple bioinformatic tools.Mol Med Rep. 2014 Oct;10(4):1800-12. doi: 10.3892/mmr.2014.2465. Epub 2014 Aug 7. Mol Med Rep. 2014. PMID: 25109818 Free PMC article.
-
The potential of lipocalin-2/NGAL as biomarker for inflammatory and metabolic diseases.Biomarkers. 2015;20(8):565-71. doi: 10.3109/1354750X.2015.1123354. Epub 2015 Dec 15. Biomarkers. 2015. PMID: 26671823 Free PMC article. Review.
-
From the periphery to the brain: Lipocalin-2, a friend or foe?Prog Neurobiol. 2015 Aug;131:120-36. doi: 10.1016/j.pneurobio.2015.06.005. Epub 2015 Jul 6. Prog Neurobiol. 2015. PMID: 26159707 Review.
Cited by
-
A systematic analysis of human lipocalin family and its expression in esophageal carcinoma.Sci Rep. 2015 Jul 1;5:12010. doi: 10.1038/srep12010. Sci Rep. 2015. PMID: 26131602 Free PMC article.
-
STAT1, IGF1, RAC1, and MDM2 Are Associated with Recurrence of Giant Cell Tumor of Bone.J Immunol Res. 2018 Jan 31;2018:4564328. doi: 10.1155/2018/4564328. eCollection 2018. J Immunol Res. 2018. PMID: 29651441 Free PMC article.
-
A powerful score-based statistical test for group difference in weighted biological networks.BMC Bioinformatics. 2016 Feb 12;17:86. doi: 10.1186/s12859-016-0916-x. BMC Bioinformatics. 2016. PMID: 26867929 Free PMC article.
-
Teeth loss, teeth brushing and esophageal carcinoma: a systematic review and meta-analysis.Sci Rep. 2015 Oct 14;5:15203. doi: 10.1038/srep15203. Sci Rep. 2015. PMID: 26462879 Free PMC article.
-
Anti-tumor effects of dual PI3K-HDAC inhibitor CUDC-907 on activation of ROS-IRE1α-JNK-mediated cytotoxic autophagy in esophageal cancer.Cell Biosci. 2022 Aug 21;12(1):135. doi: 10.1186/s13578-022-00855-x. Cell Biosci. 2022. PMID: 35989326 Free PMC article.
References
-
- Yan L., Borregaard N., Kjeldsen L. & Moses M. A. The high molecular weight urinary matrix metalloproteinase (MMP) activity is a complex of gelatinase B/MMP-9 and neutrophil gelatinase-associated lipocalin (NGAL). Modulation of MMP-9 activity by NGAL. J Biol Chem 276, 37258–65 (2001). - PubMed
-
- Yang J. et al. An iron delivery pathway mediated by a lipocalin. Mol Cell 10, 1045–56 (2002). - PubMed
-
- Bolignano D1. et al. Neutrophil gelatinase-associated lipocalin (NGAL) in human neoplasias: a new protein enters the scene. Cancer Lett 288, 10–6 (2010). - PubMed
Publication types
MeSH terms
Substances
LinkOut - more resources
Full Text Sources
Other Literature Sources
Medical
Molecular Biology Databases
Miscellaneous
