

Prefrontal cortical recordings with biomorphic MEAs reveal complex columnar-laminar microcircuits for BCI/BMI implementation
- PMID: 24954713
- PMCID: PMC4595476
- DOI: 10.1016/j.jneumeth.2014.05.029
Prefrontal cortical recordings with biomorphic MEAs reveal complex columnar-laminar microcircuits for BCI/BMI implementation
Abstract
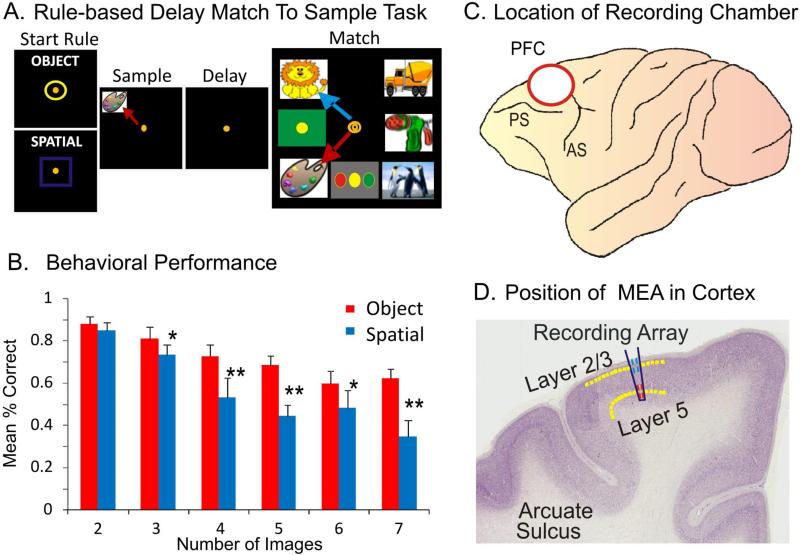
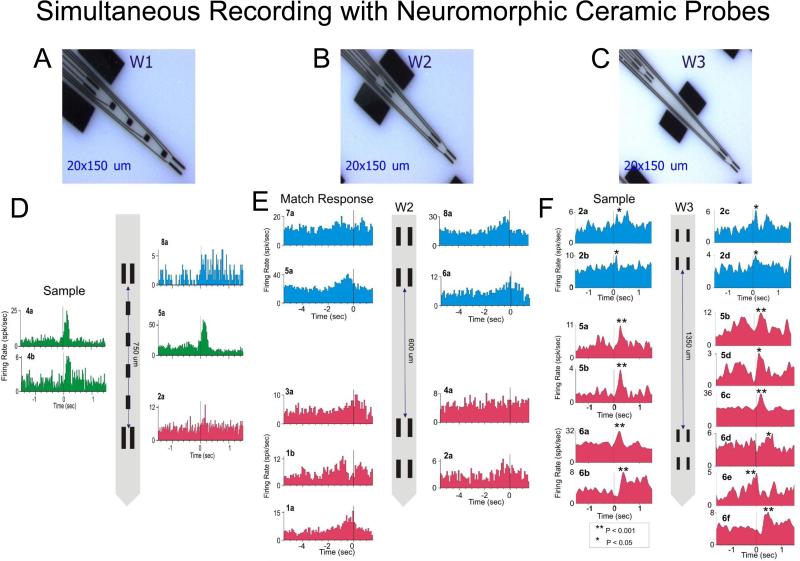
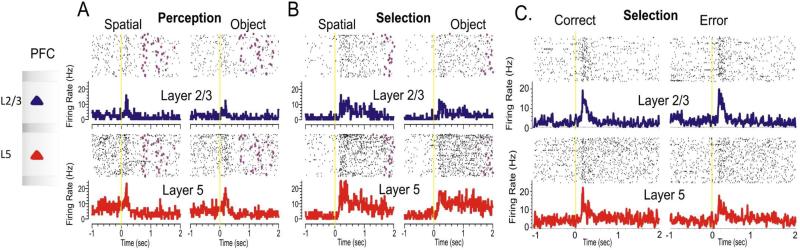
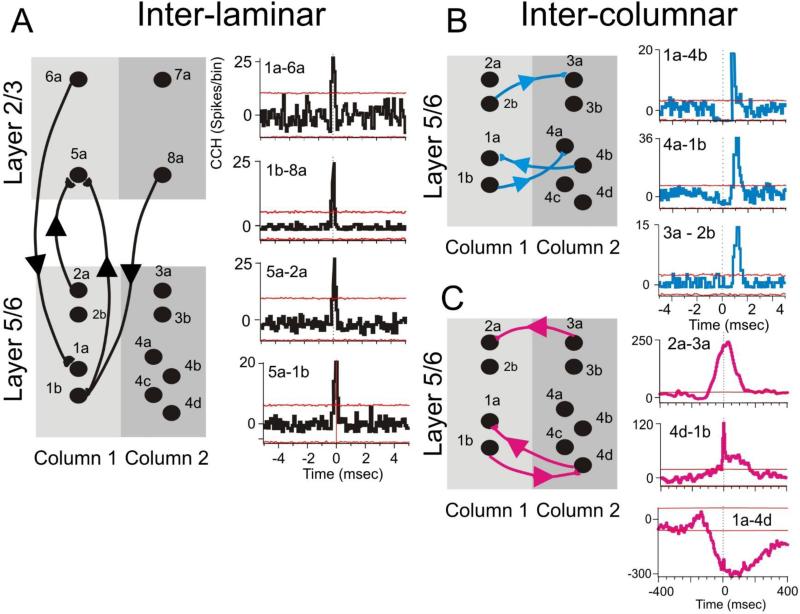
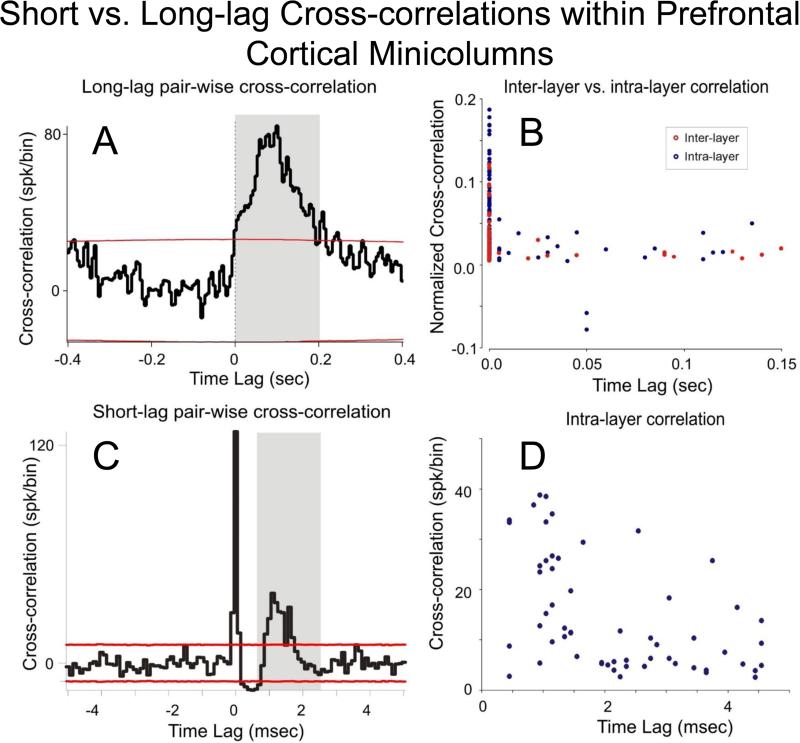
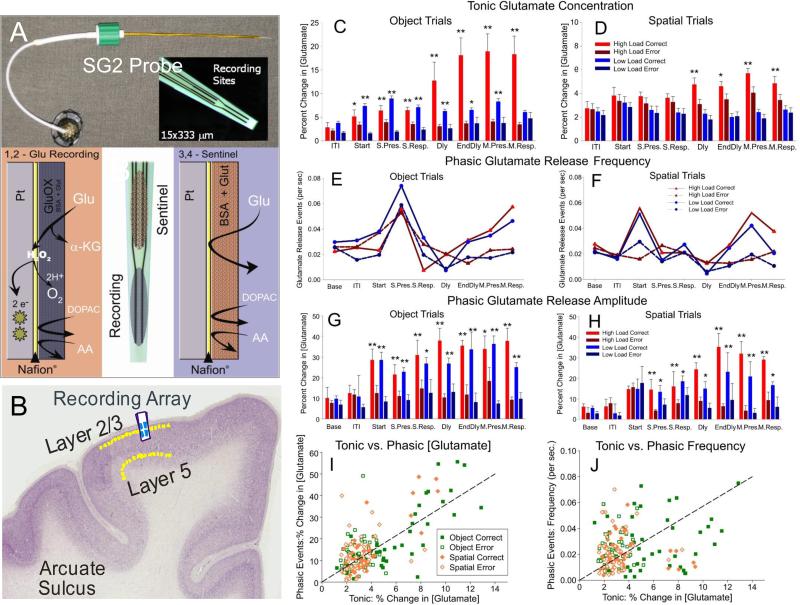
The mammalian prefrontal cortex known as the seat of high brain functions uses a six layer distribution of minicolumnar neurons to coordinate the integration of sensory information and the selection of relevant signals for goal driven behavior. To reveal the complex functionality of these columnar microcircuits we employed simultaneous recordings with several configurations of biomorphic microelectrode arrays (MEAs) within cortical layers in adjacent minicolumns, in four nohuman primates (NHPs) performing a delayed match-to-sample (DMS) visual discrimination task. We examined: (1) the functionality of inter-laminar, and inter-columnar interactions between pairs of cells in the same or different minicolumns by use of normalized cross-correlation histograms (CCH), (2) the modulation of glutamate concentration in layer 2/3, and (3) the potential interactions within these microcircuits. The results demonstrate that neurons in both infra-granular and supra-granular layers interact through inter-laminar loops, as well as through intra-laminar to produce behavioral response signals. These results provide new insights into the manner in which prefrontal cortical microcircuitry integrates sensory stimuli used to provide behaviorally relevant signals that may be implemented in brain computer/machine interfaces (BCI/BMIs) during performance of the task.
Keywords: Columnar processing; Executive control; Glutamate modulation; Microcircuits; Nonhuman primates; Prefrontal cortex.
Copyright © 2014 Elsevier B.V. All rights reserved.
Figures
Similar articles
-
What Is the Evidence for Inter-laminar Integration in a Prefrontal Cortical Minicolumn?Front Neuroanat. 2017 Dec 14;11:116. doi: 10.3389/fnana.2017.00116. eCollection 2017. Front Neuroanat. 2017. PMID: 29311848 Free PMC article.
-
Closing the loop in primate prefrontal cortex: inter-laminar processing.Front Neural Circuits. 2012 Nov 22;6:88. doi: 10.3389/fncir.2012.00088. eCollection 2012. Front Neural Circuits. 2012. PMID: 23189041 Free PMC article.
-
Facilitation and restoration of cognitive function in primate prefrontal cortex by a neuroprosthesis that utilizes minicolumn-specific neural firing.J Neural Eng. 2012 Oct;9(5):056012. doi: 10.1088/1741-2560/9/5/056012. Epub 2012 Sep 13. J Neural Eng. 2012. PMID: 22976769 Free PMC article.
-
Prefrontal cortical minicolumn: from executive control to disrupted cognitive processing.Brain. 2014 Jul;137(Pt 7):1863-75. doi: 10.1093/brain/awt359. Epub 2014 Feb 14. Brain. 2014. PMID: 24531625 Free PMC article. Review.
-
Neural dynamics and information representation in microcircuits of motor cortex.Front Neural Circuits. 2013 May 3;7:85. doi: 10.3389/fncir.2013.00085. eCollection 2013. Front Neural Circuits. 2013. PMID: 23653596 Free PMC article. Review.
Cited by
-
What Is the Evidence for Inter-laminar Integration in a Prefrontal Cortical Minicolumn?Front Neuroanat. 2017 Dec 14;11:116. doi: 10.3389/fnana.2017.00116. eCollection 2017. Front Neuroanat. 2017. PMID: 29311848 Free PMC article.
-
Neurotechnologies for Human Cognitive Augmentation: Current State of the Art and Future Prospects.Front Hum Neurosci. 2019 Jan 31;13:13. doi: 10.3389/fnhum.2019.00013. eCollection 2019. Front Hum Neurosci. 2019. PMID: 30766483 Free PMC article. Review.
-
Brain augmentation and neuroscience technologies: current applications, challenges, ethics and future prospects.Front Syst Neurosci. 2022 Sep 23;16:1000495. doi: 10.3389/fnsys.2022.1000495. eCollection 2022. Front Syst Neurosci. 2022. PMID: 36211589 Free PMC article. Review.
-
Simulating laminar neuroimaging data for a visual delayed match-to-sample task.Neuroimage. 2018 Jun;173:199-222. doi: 10.1016/j.neuroimage.2018.02.037. Epub 2018 Feb 22. Neuroimage. 2018. PMID: 29476912 Free PMC article.
-
Human Brain/Cloud Interface.Front Neurosci. 2019 Mar 29;13:112. doi: 10.3389/fnins.2019.00112. eCollection 2019. Front Neurosci. 2019. PMID: 30983948 Free PMC article.
References
-
- Baddeley A. Fractionating the central executive. In: Stuss DT, Knight RT, editors. Principles of Frontal Lobe Function. Oxford University Press; New York: 2002. pp. 246–260.
-
- Burmeister JJ, Coates TD, Gerhardt GA. Multisite microelectrode arrays for measurements of multiple neurochemicals. Conf Proc IEEE Eng Med Biol Soc. 2004;7:5348–5351. - PubMed
-
- Burmeister JJ, Pomerleau F, Huettl P, Gash CR, Werner CE, Bruno JP, Gerhardt GA. Ceramic-based multisite microelectrode arrays for simultaneous measures of choline and acetylcholine in CNS. Biosens Bioelectron. 2008;23:1382–1389. - PubMed
Publication types
MeSH terms
Substances
Grants and funding
LinkOut - more resources
Full Text Sources
Other Literature Sources
