

Long noncoding RNA profiles identify five distinct molecular subtypes of colorectal cancer with clinical relevance
- PMID: 24954858
- PMCID: PMC5528608
- DOI: 10.1016/j.molonc.2014.05.010
Long noncoding RNA profiles identify five distinct molecular subtypes of colorectal cancer with clinical relevance
Abstract
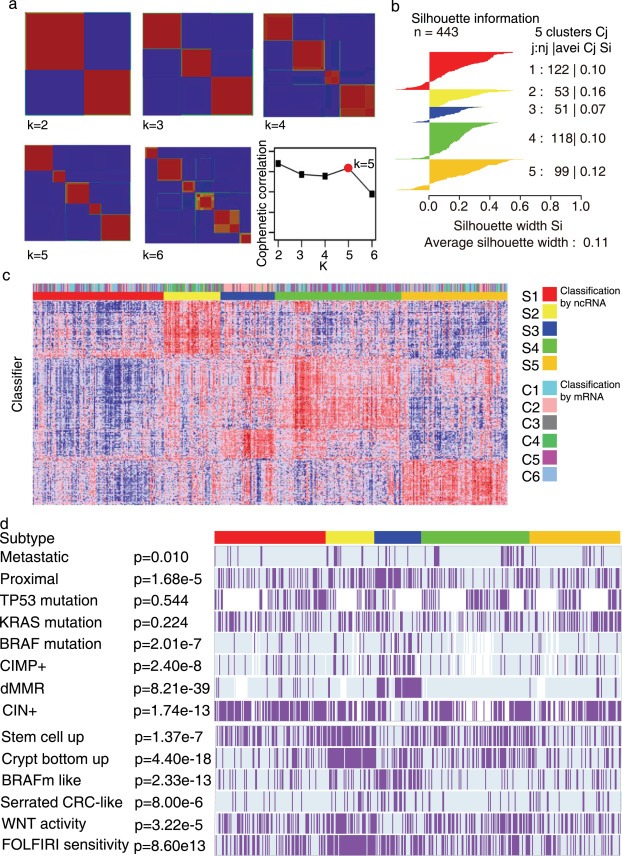
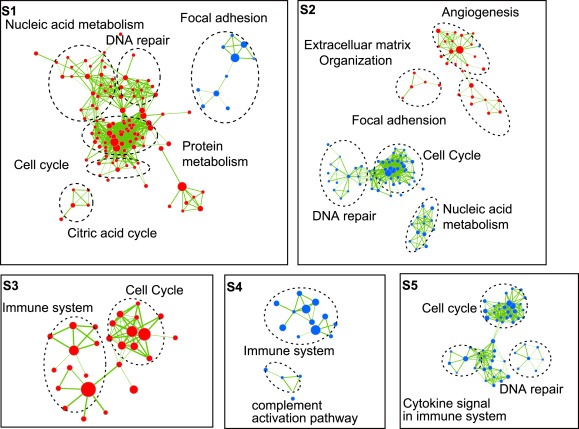
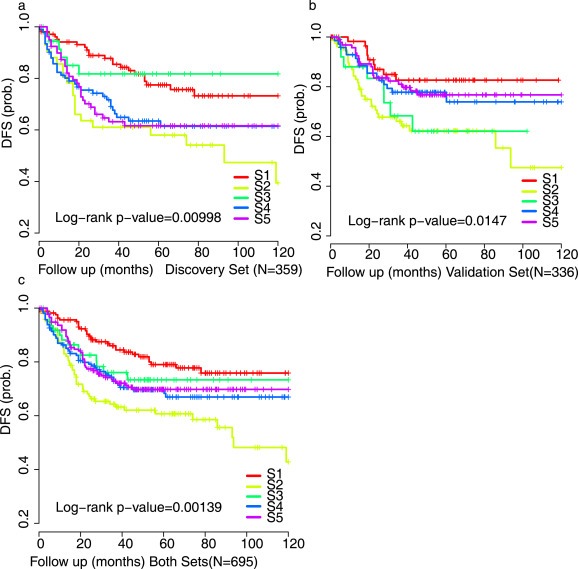
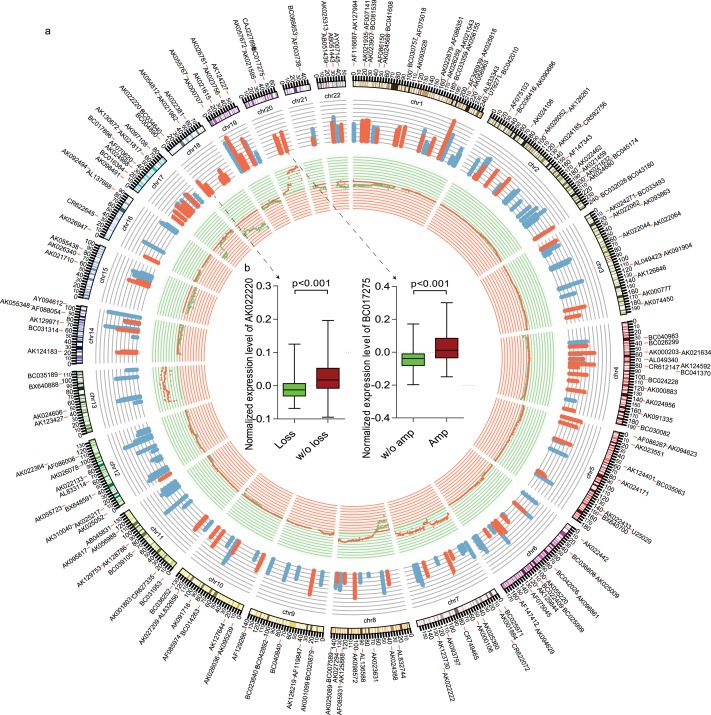
Colorectal cancer (CRC) is a heterogeneous disease in terms of clinical behavior and response to therapy. Increasing evidence suggests that long noncoding RNAs (lncRNAs) are frequently aberrantly expressed in cancers, and some of them have been implicated in CRC biogenesis and prognosis. Using an lncRNA-mining approach, we constructed lncRNAs expression profiles in approximately 888 CRC samples. By applying unsupervised consensus clustering to LncRNA expression profiles, we identified five distinct molecular subtypes of CRC with different biological pathways and phenotypically distinct in their clinical outcome in both univariate and multivariate analysis. The prognostic significance of the lncRNA-based classifier was confirmed in independent patient cohorts. Further analysis revealed that most of the signature lncRNAs positively correlated with somatic copy number alterations (SCNAs). This lncRNAs-based classification schema thus provides a molecular classification applicable to individual tumors that has implications to influence treatment decisions.
Keywords: Colorectal cancer; Consensus clustering; Gene expression profiling; Gene set enrichment analysis; Somatic copy number alterations; Survival; lncRNA.
Copyright © 2014 Federation of European Biochemical Societies. Published by Elsevier B.V. All rights reserved.
Figures
Similar articles
-
Discovery of a novel six-long non-coding RNA signature predicting survival of colorectal cancer patients.J Cell Biochem. 2018 Apr;119(4):3574-3585. doi: 10.1002/jcb.26548. Epub 2018 Jan 15. J Cell Biochem. 2018. PMID: 29227531
-
A long non-coding RNA signature to improve prognosis prediction of colorectal cancer.Oncotarget. 2014 Apr 30;5(8):2230-42. doi: 10.18632/oncotarget.1895. Oncotarget. 2014. PMID: 24809982 Free PMC article.
-
An eight-long noncoding RNA expression signature for colorectal cancer patients' prognosis.J Cell Biochem. 2019 Apr;120(4):5636-5643. doi: 10.1002/jcb.27847. Epub 2018 Oct 15. J Cell Biochem. 2019. PMID: 30320902
-
Identification of MFI2-AS1, a Novel Pivotal lncRNA for Prognosis of Stage III/IV Colorectal Cancer.Dig Dis Sci. 2020 Dec;65(12):3538-3550. doi: 10.1007/s10620-020-06064-1. Epub 2020 Jan 20. Dig Dis Sci. 2020. PMID: 31960204 Review.
-
The relevance of long noncoding RNAs in colorectal cancer biology and clinical settings.J Cancer Res Ther. 2020 Dec;16(Supplement):S22-S33. doi: 10.4103/jcrt.JCRT_327_18. J Cancer Res Ther. 2020. PMID: 33380647 Review.
Cited by
-
Effect of long non-coding RNA PVT1 on cell proliferation and migration in melanoma.Int J Mol Med. 2018 Mar;41(3):1275-1282. doi: 10.3892/ijmm.2017.3335. Epub 2017 Dec 20. Int J Mol Med. 2018. PMID: 29286144 Free PMC article.
-
ZNF692 promotes colon adenocarcinoma cell growth and metastasis by activating the PI3K/AKT pathway.Int J Oncol. 2019 May;54(5):1691-1703. doi: 10.3892/ijo.2019.4733. Epub 2019 Feb 27. Int J Oncol. 2019. PMID: 30816443 Free PMC article.
-
Identification and Validation of a Four-Long Non-coding RNA Signature Associated With Immune Infiltration and Prognosis in Colon Cancer.Front Genet. 2021 Jul 5;12:671128. doi: 10.3389/fgene.2021.671128. eCollection 2021. Front Genet. 2021. PMID: 34290738 Free PMC article.
-
A three-long noncoding RNA signature as a diagnostic biomarker for differentiating between triple-negative and non-triple-negative breast cancers.Medicine (Baltimore). 2017 Mar;96(9):e6222. doi: 10.1097/MD.0000000000006222. Medicine (Baltimore). 2017. PMID: 28248879 Free PMC article.
-
Knockdown of long non-coding RNA prostate cancer-associated ncRNA transcript 1 inhibits multidrug resistance and c-Myc-dependent aggressiveness in colorectal cancer Caco-2 and HT-29 cells.Mol Cell Biochem. 2018 Apr;441(1-2):99-108. doi: 10.1007/s11010-017-3177-8. Epub 2017 Sep 7. Mol Cell Biochem. 2018. PMID: 28884413
References
-
- Beroukhim, R. , Mermel, C.H. , Porter, D. , Wei, G. , Raychaudhuri, S. , Donovan, J. , Barretina, J. , Boehm, J.S. , Dobson, J. , Urashima, M. , Mc Henry, K.T. , Pinchback, R.M. , Ligon, A.H. , Cho, Y.J. , Haery, L. , Greulich, H. , Reich, M. , Winckler, W. , Lawrence, M.S. , Weir, B.A. , Tanaka, K.E. , Chiang, D.Y. , Bass, A.J. , Loo, A. , Hoffman, C. , Prensner, J. , Liefeld, T. , Gao, Q. , Yecies, D. , Signoretti, S. , Maher, E. , Kaye, F.J. , Sasaki, H. , Tepper, J.E. , Fletcher, J.A. , Tabernero, J. , Baselga, J. , Tsao, M.S. , Demichelis, F. , Rubin, M.A. , Janne, P.A. , Daly, M.J. , Nucera, C. , Levine, R.L. , Ebert, B.L. , Gabriel, S. , Rustgi, A.K. , Antonescu, C.R. , Ladanyi, M. , Letai, A. , Garraway, L.A. , Loda, M. , Beer, D.G. , True, L.D. , Okamoto, A. , Pomeroy, S.L. , Singer, S. , Golub, T.R. , Lander, E.S. , Getz, G. , Sellers, W.R. , Meyerson, M. , 2010. The landscape of somatic copy-number alteration across human cancers. Nature. 463, 899–905. - PMC - PubMed
-
- Budinska, E. , Popovici, V. , Tejpar, S. , D'Ario, G. , Lapique, N. , Sikora, K.O. , Di Narzo, A.F. , Yan, P. , Hodgson, J.G. , Weinrich, S. , Bosman, F. , Roth, A. , Delorenzi, M. , 2013. Gene expression patterns unveil a new level of molecular heterogeneity in colorectal cancer. J. Pathology. 231, 63–76. - PMC - PubMed
-
- De Sousa, E.M.F. , Wang, X. , Jansen, M. , Fessler, E. , Trinh, A. , de Rooij, L.P. , de Jong, J.H. , de Boer, O.J. , van Leersum, R. , Bijlsma, M.F. , Rodermond, H. , van der Heijden, M. , van Noesel, C.J. , Tuynman, J.B. , Dekker, E. , Markowetz, F. , Medema, J.P. , Vermeulen, L. , 2013. Poor-prognosis colon cancer is defined by a molecularly distinct subtype and develops from serrated precursor lesions. Nat. Medicine. 19, 614–618. - PubMed
Publication types
MeSH terms
Substances
LinkOut - more resources
Full Text Sources
Other Literature Sources
Medical
