. 2014 Oct;60(4):1302-13.
doi: 10.1002/hep.27275. Epub 2014 Aug 25.

A cell-surface β-hydroxylase is a biomarker and therapeutic target for hepatocellular carcinoma

Affiliations

A cell-surface β-hydroxylase is a biomarker and therapeutic target for hepatocellular carcinoma

Arihiro Aihara et al. Hepatology. 2014 Oct.

Abstract

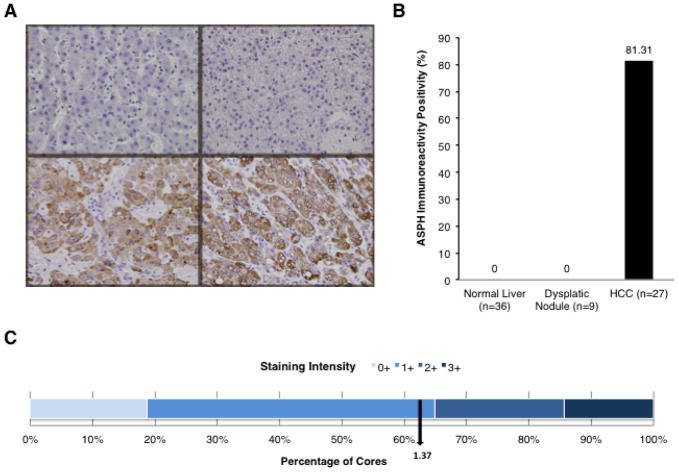
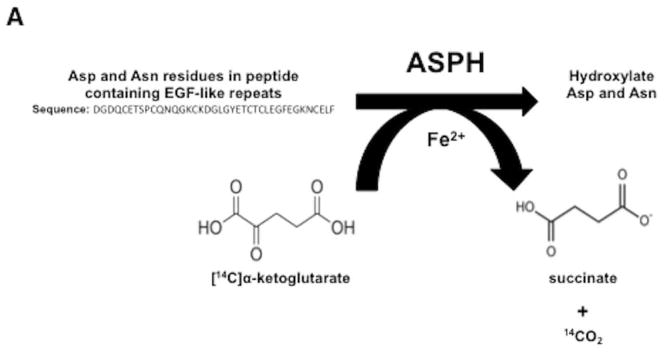
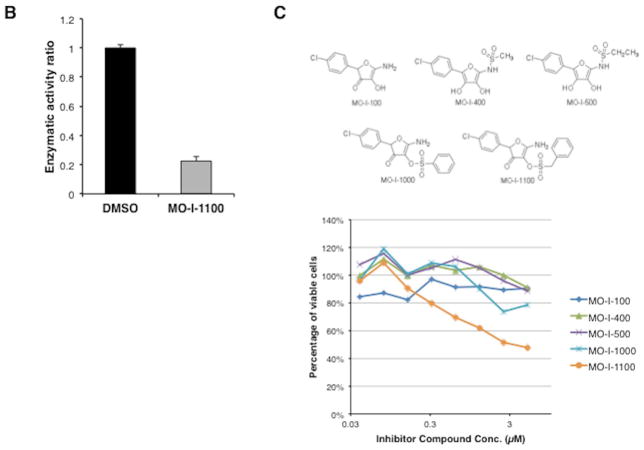
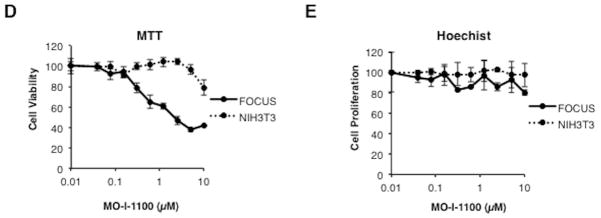
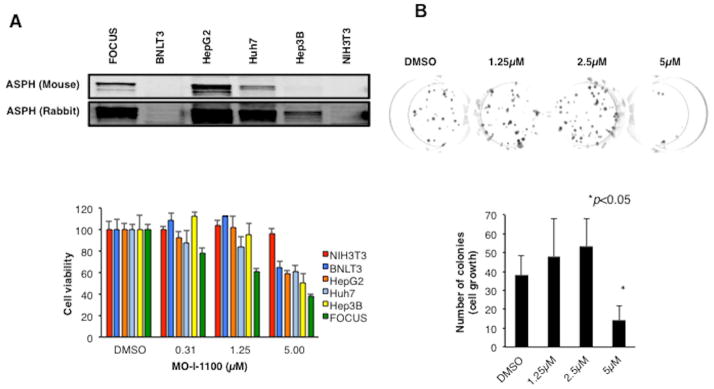
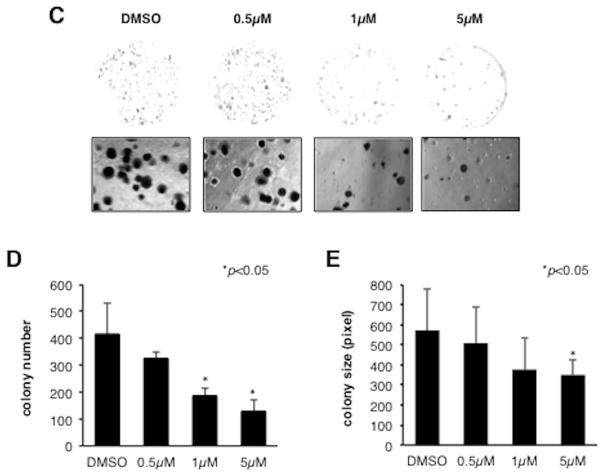
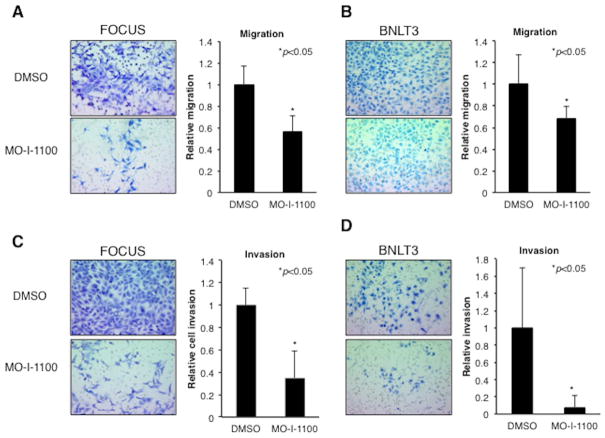
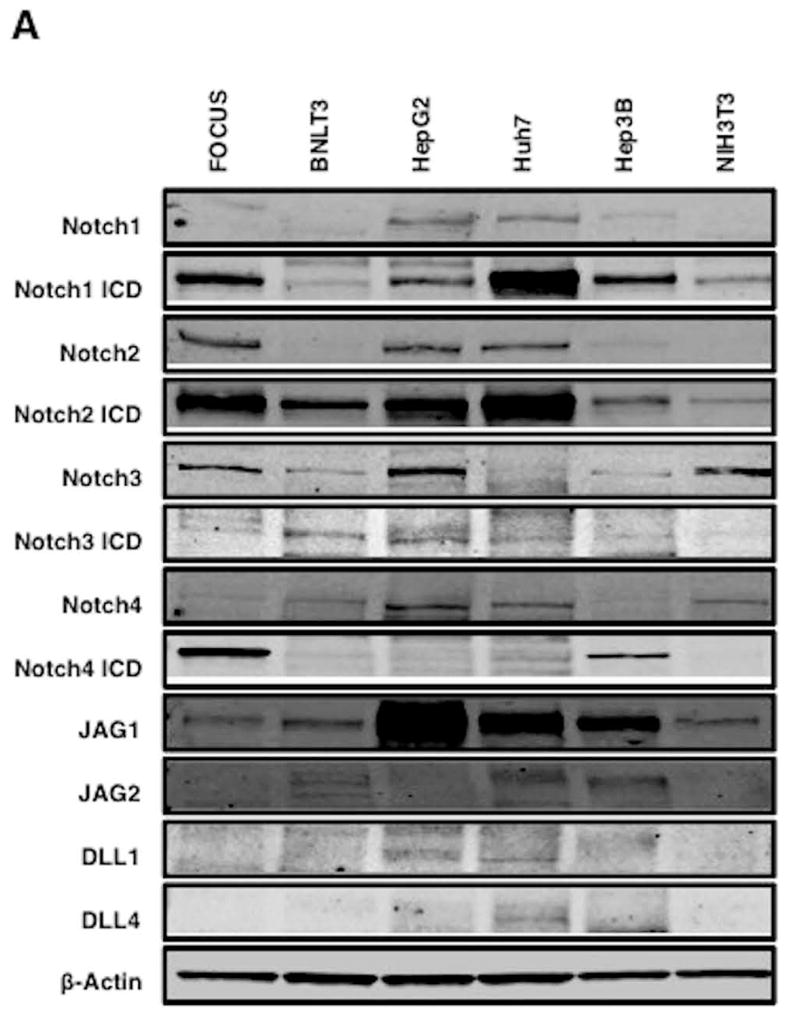
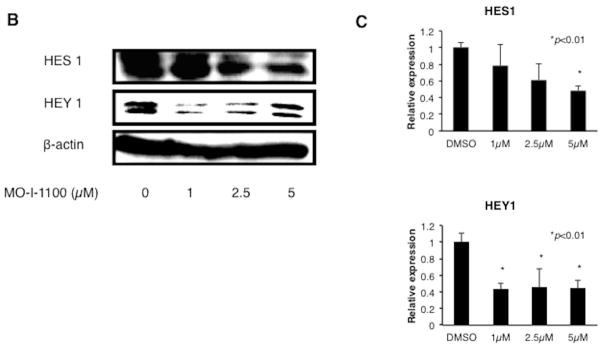
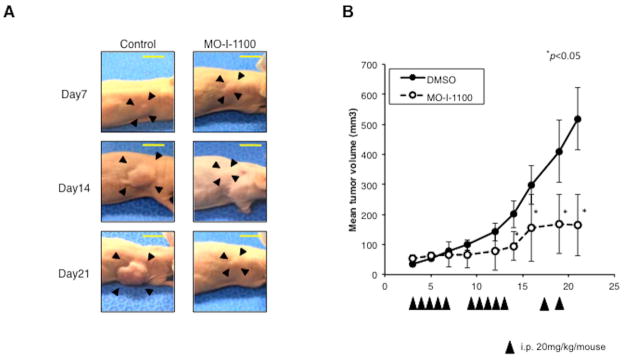
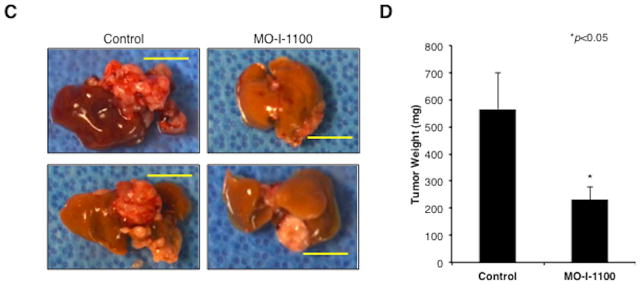
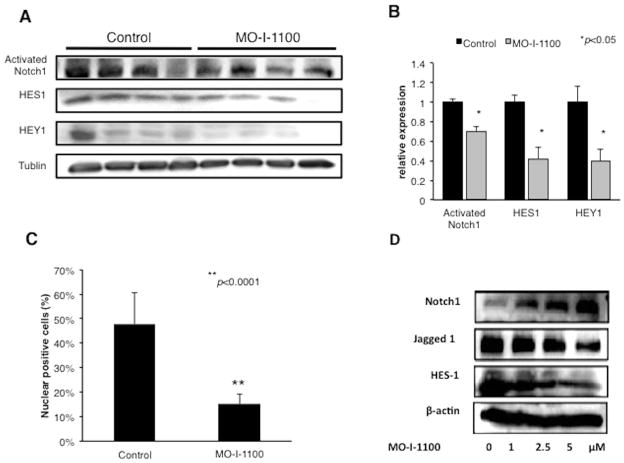
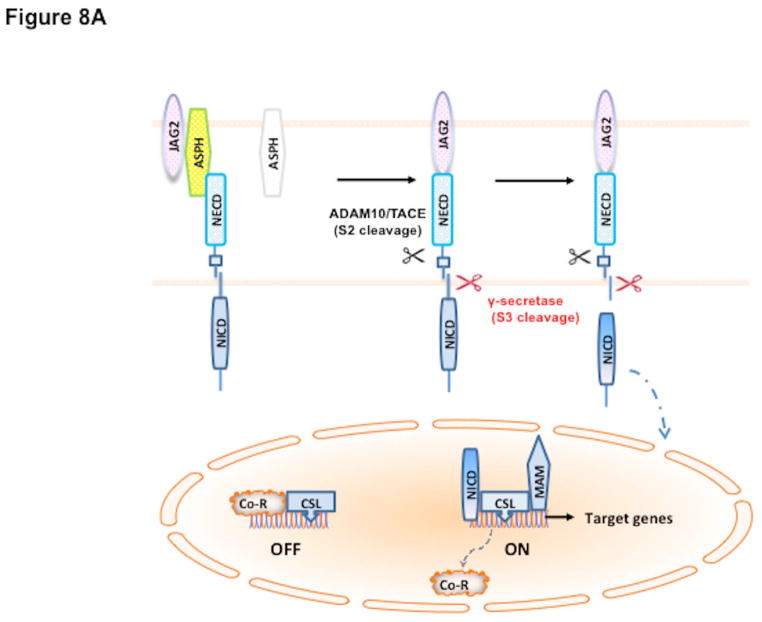
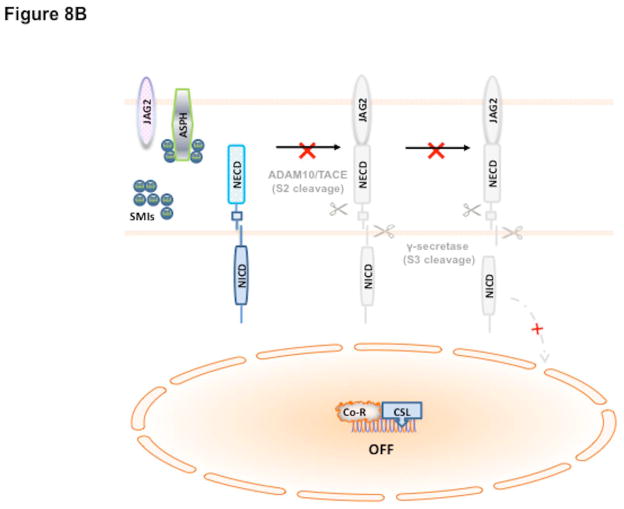
Hepatocellular carcinoma (HCC) has a poor prognosis as a result of widespread intra- and extrahepatic metastases. There is an urgent need to understand signaling cascades that promote disease progression. Aspartyl-(asparaginyl)-β-hydroxylase (ASPH) is a cell-surface enzyme that generates enhanced cell motility, migration, invasion, and metastatic spread in HCC. We hypothesize that inhibition of its enzymatic activity could have antitumor effects. Small molecule inhibitors (SMIs) were developed based on the crystal structure of the ASPH catalytic site followed by computer-assisted drug design. Candidate compounds were tested for inhibition of β-hydroxylase activity and selected for their capability to modulate cell proliferation, migration, invasion, and colony formation in vitro and to inhibit HCC tumor growth in vivo using orthotopic and subcutaneous murine models. The biological effects of SMIs on the Notch signaling cascade were evaluated. The SMI inhibitor, MO-I-1100, was selected because it reduced ASPH enzymatic activity by 80% and suppressed HCC cell migration, invasion, and anchorage-independent growth. Furthermore, substantial inhibition of HCC tumor growth and progression was observed in both animal models. The mechanism(s) for this antitumor effect was associated with reduced activation of Notch signaling both in vitro and in vivo.

Conclusions: These studies suggest that the enzymatic activity of ASPH is important for hepatic oncogenesis. Reduced β-hydroxylase activity generated by the SMI MO-I-1100 leads to antitumor effects through inhibiting Notch signaling cascade in HCC. ASPH promotes the generation of an HCC malignant phenotype and represents an attractive molecular target for therapy of this fatal disease.


Conflict of interest statement

Conflict of interest: We have no conflict of interest.

Figures

Fig. 1
Fig. 1. Expression of ASPH in HCC
ASPH expression in human HCC tumors, dysplastic nodules and adjacent uninvolved normal liver. (A) represents IHS of normal liver (upper left), dysplastic nodules (upper right) and human HCCs (bottom two). (B) percent of ASPH positive expression in human HCC tumors (86 TMA cores) at 400×. ASPH was highly expressed in tumor tissues compared with normal liver. Negative staining was observed for all components of adjacent uninvolved liver and dysplastic (regenerating) nodules. (C) semiquantatative analysis of staining intensity distribution of ASPH levels in HCC (0, negative; 1+, moderate; 2+, strong; and 3+, very strong immunoreactivity).
Fig. 2
Fig. 2. Analysis of β-hydroxylase activity
(A) The biochemical reaction catalyzed by ASPH. (B) Inhibition by 80% of β-hydroxylase activity by a SMI MO-I-1100. (C) Representative structures of compounds screening as potential inhibitors of β-hydroxylase activity (top). The MTT assay was used as a secondary screen for effects on FOCUS cell viability over a concentration range of 0.3–5 μM (bottom). Note that MO-I-1100 reduced both enzymatic activity and cell viability and was therefore, selected for further functional studies. (D) Dose-response curve of MO-I-1100 levels on FOCUS cells (high level ASPH expression) compared to NIH3T3 cells (no expression) with respect to cell viability using the MTT assay. (E) There was no effect on cell proliferation by MO-I-1100 over a 24 hour period at the concentrations indicated.
Fig. 3
Fig. 3. Effects of MO-I-1100 on cell viability, growth and anchorage independent colony formation in HCC cell lines
(A) (Top) HCC cell lines have variable levels of ASPH expression. Note that all HCC cell lines (including the murine BNLT3 hepatoma cells) studied expressed ASPH; NIH3T3 cells lack expression. (Bottom) Effects of different concentrations of MO-I-1100 on cell viability. There was a general correlation of ASPH expression with sensitivity to the β-hydroxylase inhibitor. (B) A three week exposure to MO-I-1100 (5 μM) reduced cell growth. (C) The β-hydroxylase inhibitor reduced colony formation in a dose dependent manner. (D) and (E) Graphic presentation of number and size of colony-forming units from three independent experiments. Vertical bar represents standard deviation (S.D.); *P < 0.05.
Fig. 4
Fig. 4. β-hydroxylase inhibitor reduced cell motility and invasiveness in human and murine HCC cell lines
Measurement of motility and invasiveness of HCC cell lines after treatment with MO-I-1100. (A) Representative examples of the microscopic image of the migrated FOCUS cells and graphic presentation of the results with MO-I-1100 treatment. (B) Representative examples of the microscopic image of migrated cells in BNLT3 murine HCC cells and their reduction following MO-I-1100 exposure. (C) Representative examples of FOCUS cell invasion; note reduction following MO-I-1100 treatment. (D) Effects of MO-I-1100 on invasive properties of murine BNLT3 cells. Magnification is 100×. All graphs depict the mean ± S.D. of results obtained from multiple independent culture experiments (*p < 0.05).
Fig. 5
Fig. 5. Alterations in Notch signaling produced by MO-I-1100
(A) Notch protein expression in HCC cell lines. Note that there is expression of Notch receptors, activated NICDs and ligands (JAG1) in most HCC cell lines. (B) and (C) Treatment of FOCUS cells with a range of MO-I-1100 concentrations reduces the expression of downstream Notch regulated HES1 and HEY1 genes compared to DMSO control (*p < 0.01).
Fig. 6
Fig. 6. In vivo effects of MO-I-1100 on HCC growth and progression
Animals with established s.c. tumor xenografts generated by FOCUS cells were treated with i.p. injection of MO-I-1100 at 20 mg/kg or saline (control) on 5 consecutive days per week for 2 weeks, and then kept on an every other day regimen until the end of study. (A) Examples of subcutaneous grown FOCUS tumors in mice on days 7, 14, and 21 following treatment with MO-I-1100 (right) compared to the saline injected controls (left). (B) Tumor volumes were measured and plotted every other day in MO-I-1100-treated or control mice (n = 10). Arrows indicate timing of administration; vertical bars, standard error (*p < 0.05). (C) Appearance of intrahepatic grown tumors 4 weeks after administration of MO-I-1100 (right) compared to the controls (left). Horizontal yellow bars indicate 1 cm length. (D) Liver tumor weight was analyzed at 4 weeks after administration of MO-I-1100 compared to control (n = 12). HCC tumor size and weight was significantly reduced by MO-I-1100 treatment (*p < 0.05).
Fig. 7
Fig. 7. Inhibition of Notch signaling by a SMI in HCC tumors
We determined the length of time that may be necessary to generate inhibitor effects on Notch signaling by MO-I-1100 treatment. (A) Western blot analysis of activated NICD, HES1 and HEY1 expression from xenograft tumors generated by FOCUS cells after treatment with MO-I-1100 at 50 mg/kg/day for 5 days compared to the control. (B) Densitometric analyses of protein expression. (C) Graft depicts IHS of NICD in xenograft tumor nuclei following treatment with MO-I-1100 compared to control. Note that MO-I-1100 therapy of established tumors strikingly reduced the generation and nuclear translocation of NICD and was associated with downregulation of HES1 and HEY1 gene expression. (D) The enzymatic activity of ASPH is involved in the regulation of Notch proteins. Increasing concentrations of MO-I-1100 enhanced Notch 1 but reduced Jagged1 and downstream HES1 gene expression after a 24 hour exposure of FOCUS HCC cells in vitro (*p < 0.05; **p<0.001).
Fig. 8
Fig. 8
Hypothesis of how ASPH may be involved in HCC growth and progression through Notch activation (38). The catalytic domain of ASPH (Yellow) contains the catalytic site sequence M670HPGTH675. Both Notch and JAG are substrates of ASPH since they have EGF-like domains: thus, ASPH acts as an “adaptor” for direct physical interaction with Notch1 with JAG2 on the surface of two neighbored cells. (A) In the presence of β-hydroxylase activity of ASPH, binding of the JAG2 ligand (pink) on one cell to the Notch receptor (blue) on another cell results in two sequential proteolytic cleavage of the receptor. The ADAM10 or TACE (TNF-α-converting enzyme; ADAM17) metalloprotease (black) catalyzes the S2 cleavage and generates a substrate for S3 cleavage by the γ-secretase complex (red). This proteolytic process mediates release of the Notch intracellular domain (NICD), which enters the nucleus and interacts with the DNA-binding CSL [CBF1, Su(H) and LAG-1] protein. The co-activator Mastermind (MAM) and other transcription factors are recruited to the CSL complex, whereas co-repressors (Co-R) are released in this context. The Notch signaling is “ON” and the downstream target genes are expressed: HES1 and HEY1 are involved in cell proliferation, migration, invasion, tumor growth and metastasis in HCC. (B) Small molecule inhibitors (SMIs) such as MO-I-1100 can block the catalytic site of ASPH, which leads to loss of β-hydroxylase activity and failure of Notch activation as manifested by reduced generation and nuclear translocation of NICDs and downregulation of responsive genes such as HES1 and HEY1. Therefore, Notch signaling is “OFF” and its oncogenic effects are reduced in HCC.
Fig. 8
Fig. 8
Hypothesis of how ASPH may be involved in HCC growth and progression through Notch activation (38). The catalytic domain of ASPH (Yellow) contains the catalytic site sequence M670HPGTH675. Both Notch and JAG are substrates of ASPH since they have EGF-like domains: thus, ASPH acts as an “adaptor” for direct physical interaction with Notch1 with JAG2 on the surface of two neighbored cells. (A) In the presence of β-hydroxylase activity of ASPH, binding of the JAG2 ligand (pink) on one cell to the Notch receptor (blue) on another cell results in two sequential proteolytic cleavage of the receptor. The ADAM10 or TACE (TNF-α-converting enzyme; ADAM17) metalloprotease (black) catalyzes the S2 cleavage and generates a substrate for S3 cleavage by the γ-secretase complex (red). This proteolytic process mediates release of the Notch intracellular domain (NICD), which enters the nucleus and interacts with the DNA-binding CSL [CBF1, Su(H) and LAG-1] protein. The co-activator Mastermind (MAM) and other transcription factors are recruited to the CSL complex, whereas co-repressors (Co-R) are released in this context. The Notch signaling is “ON” and the downstream target genes are expressed: HES1 and HEY1 are involved in cell proliferation, migration, invasion, tumor growth and metastasis in HCC. (B) Small molecule inhibitors (SMIs) such as MO-I-1100 can block the catalytic site of ASPH, which leads to loss of β-hydroxylase activity and failure of Notch activation as manifested by reduced generation and nuclear translocation of NICDs and downregulation of responsive genes such as HES1 and HEY1. Therefore, Notch signaling is “OFF” and its oncogenic effects are reduced in HCC.

References

    1. Fong Y, Sun RL, Jarnagin W, Blumgart LH. An analysis of 412 cases of hepatocellular carcinoma at a Western center. Ann Surg. 1999;229:790–799. discussion 799–800. - PMC - PubMed
    1. Llovet JM, Ricci S, Mazzaferro V, Hilgard P, Gane E, Blanc JF, de Oliveira AC, et al. Sorafenib in advanced hepatocellular carcinoma. N Engl J Med. 2008;359:378–390. - PubMed
    1. Cheng AL, Kang YK, Chen Z, Tsao CJ, Qin S, Kim JS, Luo R, et al. Efficacy and safety of sorafenib in patients in the Asia-Pacific region with advanced hepatocellular carcinoma: a phase III randomised, double-blind, placebo-controlled trial. Lancet Oncol. 2009;10:25–34. - PubMed
    1. Jia S, VanDusen WJ, Diehl RE, Kohl NE, Dixon RA, Elliston KO, Stern AM, et al. cDNA cloning and expression of bovine aspartyl (asparaginyl) beta-hydroxylase. J Biol Chem. 1992;267:14322–14327. - PubMed
    1. Engel J. EGF-like domains in extracellular matrix proteins: localized signals for growth and differentiation? FEBS Lett. 1989;251:1–7. - PubMed

Publication types

MeSH terms