Imaging mouse lung allograft rejection with (1)H MRI
- PMID: 24954886
- PMCID: PMC4272671
- DOI: 10.1002/mrm.25313
Imaging mouse lung allograft rejection with (1)H MRI
Abstract
Purpose: To demonstrate that longitudinal, noninvasive monitoring via MRI can characterize acute cellular rejection in mouse orthotopic lung allografts.
Methods: Nineteen Balb/c donor to C57BL/6 recipient orthotopic left lung transplants were performed, further divided into control-Ig versus anti-CD4/anti-CD8 treated groups. A two-dimensional multislice gradient-echo pulse sequence synchronized with ventilation was used on a small-animal MR scanner to acquire proton images of lung at postoperative days 3, 7, and 14, just before sacrifice. Lung volume and parenchymal signal were measured, and lung compliance was calculated as volume change per pressure difference between high and low pressures.
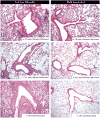
Results: Normalized parenchymal signal in the control-Ig allograft increased over time, with statistical significance between day 14 and day 3 posttransplantation (0.046→0.789; P < 0.05), despite large intermouse variations; this was consistent with histopathologic evidence of rejection. Compliance of the control-Ig allograft decreased significantly over time (0.013→0.003; P < 0.05), but remained constant in mice treated with anti-CD4/anti-CD8 antibodies.
Conclusion: Lung allograft rejection in individual mice can be monitored by lung parenchymal signal changes and by lung compliance through MRI. Longitudinal imaging can help us better understand the time course of individual lung allograft rejection and response to treatment.
Keywords: MRI; acute cellular rejection; compliance; lung transplant.
© 2014 Wiley Periodicals, Inc.
Figures


Similar articles
-
CD8(+)IL-17(+) T Cells Mediate Neutrophilic Airway Obliteration in T-bet-Deficient Mouse Lung Allograft Recipients.Am J Respir Cell Mol Biol. 2015 May;52(5):622-33. doi: 10.1165/rcmb.2014-0059OC. Am J Respir Cell Mol Biol. 2015. PMID: 25286244 Free PMC article.
-
Liver allograft rejection in rats depleted of CD8+ cells.Transpl Int. 1996;9(5):499-505. doi: 10.1007/BF00336829. Transpl Int. 1996. PMID: 8875794
-
Aggressive skin allograft rejection in CD28-/- mice independent of the CD40/CD40L costimulatory pathway.Transpl Immunol. 2001 Oct;9(1):13-7. doi: 10.1016/s0966-3274(01)00043-0. Transpl Immunol. 2001. PMID: 11680567
-
Non-depleting anti-CD4, but not anti-CD8, antibody induces long-term survival of xenogeneic and allogeneic hearts in alpha1,3-galactosyltransferase knockout (GT-Ko) mice.Xenotransplantation. 2000 Nov;7(4):275-83. doi: 10.1034/j.1399-3089.2000.00977.x. Xenotransplantation. 2000. PMID: 11081762
-
Murine orthotopic lung transplant models: A comprehensive overview of genetic mismatch degrees and histopathological insights into chronic lung allograft dysfunction.Am J Transplant. 2024 Nov;24(11):1930-1940. doi: 10.1016/j.ajt.2024.07.033. Epub 2024 Aug 2. Am J Transplant. 2024. PMID: 39098448 Review.
Cited by
-
Murine pulmonary imaging at 7T: T2* and T1 with anisotropic UTE.Magn Reson Med. 2018 Apr;79(4):2254-2264. doi: 10.1002/mrm.26872. Epub 2017 Aug 15. Magn Reson Med. 2018. PMID: 28812309 Free PMC article.
References
-
- Kotloff RM, Thabut G. Lung transplantation. Am J Respir Crit Care Med. 2011;184(2):159–171. - PubMed
-
- Christie JD, Edwards LB, Kucheryavaya AY, et al. The registry of the international society for heart and lung transplantation: 29th adult lung and heart-lung transplant report-2012. J Heart Lung Transplant. 2012;31(10):1073–1086. - PubMed
-
- Belperio JA, Weigt SS, Fishbein MC, Lynch JP., 3rd Chronic lung allograft rejection: Mechanisms and therapy. Proc Am Thorac Soc. 2009;6(1):108–121. - PubMed
-
- Todd JL, Palmer SM. Bronchiolitis obliterans syndrome: The final frontier for lung transplantation. Chest. 2011;140(2):502–508. - PubMed
Publication types
MeSH terms
Substances
Grants and funding
LinkOut - more resources
Full Text Sources
Other Literature Sources
Medical
Research Materials

