Inequality and City Size
- PMID: 24954958
- PMCID: PMC4063360
- DOI: 10.1162/REST_a_00328
Inequality and City Size
Abstract
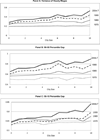
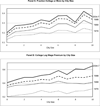
Between 1979 and 2007 a strong positive monotonic relationship between wage inequality and city size has developed. This paper investigates the links between this emergent city size inequality premium and the contemporaneous nationwide increase in wage inequality. After controlling for the skill composition of the workforce across cities of different sizes, we show that at least 23 percent of the overall increase in the variance of log hourly wages in the United States from 1979 to 2007 is explained by the more rapid growth in the variance of log wages in larger locations relative to smaller locations. This influence occurred throughout the wage distribution and was most prevalent during the 1990s. More rapid growth in within skill group inequality in larger cities has been by far the most important force driving these city size specific patterns in the data. Differences in the industrial composition of cities of different sizes explain up to one-third of this city size effect. These results suggest an important role for agglomeration economies in generating changes in the wage structure during the study period.
Figures


References
-
- Acemoglu Daron. Why Do New Technologies Complement Skills? Directed Technical Change and Wage Inequality. Quarterly Journal of Economics. 1998;113(3):1055–1089.
-
- Athey Susan, Imbens Guido W. Identification and Inference in Nonlinear Difference-in-Differences Models. Econometrica. 2006;74(2):431–497.
-
- Autor David H, Katz Lawrence F, Kearney Melissa S. Trends in U.S. Wage Inequality: Revising the Revisionists. Review of Economics and Statistics. 2008;90(2):300–323.
-
- Autor David H, Katz Lawrence F, Krueger Alan B. Have Computers Changed the Labor Market? Quarterly Journal of Economics. 1998;113(3):1169–1213.
Grants and funding
LinkOut - more resources
Full Text Sources
Other Literature Sources
