

Multi-modal molecular diffuse optical tomography system for small animal imaging
- PMID: 24954977
- PMCID: PMC4061700
- DOI: 10.1088/0957-0233/24/10/105405
Multi-modal molecular diffuse optical tomography system for small animal imaging
Abstract
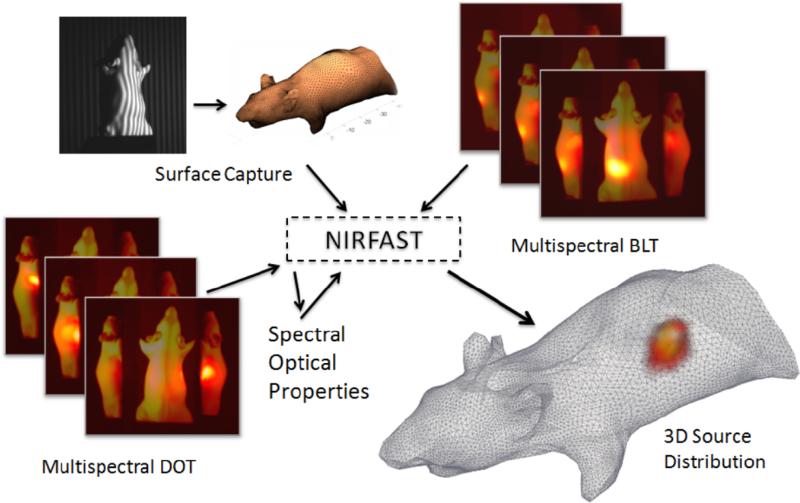
A multi-modal optical imaging system for quantitative 3D bioluminescence and functional diffuse imaging is presented, which has no moving parts and uses mirrors to provide multi-view tomographic data for image reconstruction. It is demonstrated that through the use of trans-illuminated spectral near infrared measurements and spectrally constrained tomographic reconstruction, recovered concentrations of absorbing agents can be used as prior knowledge for bioluminescence imaging within the visible spectrum. Additionally, the first use of a recently developed multi-view optical surface capture technique is shown and its application to model-based image reconstruction and free-space light modelling is demonstrated. The benefits of model-based tomographic image recovery as compared to 2D planar imaging are highlighted in a number of scenarios where the internal luminescence source is not visible or is confounding in 2D images. The results presented show that the luminescence tomographic imaging method produces 3D reconstructions of individual light sources within a mouse-sized solid phantom that are accurately localised to within 1.5mm for a range of target locations and depths indicating sensitivity and accurate imaging throughout the phantom volume. Additionally the total reconstructed luminescence source intensity is consistent to within 15% which is a dramatic improvement upon standard bioluminescence imaging. Finally, results from a heterogeneous phantom with an absorbing anomaly are presented demonstrating the use and benefits of a multi-view, spectrally constrained coupled imaging system that provides accurate 3D luminescence images.
Keywords: Bioluminescence Imaging; Bioluminescence Tomography; Diffuse Optical Tomography; Image Reconstruction; Imaging Systems; Molecular Imaging; Multimodality; Small Animal Imaging; Surface Capture.
Figures


Similar articles
-
Spectrally resolved bioluminescence tomography using the reciprocity approach.Med Phys. 2008 Nov;35(11):4863-71. doi: 10.1118/1.2982138. Med Phys. 2008. PMID: 19070220 Free PMC article.
-
Single pixel hyperspectral bioluminescence tomography based on compressive sensing.Biomed Opt Express. 2019 Oct 7;10(11):5549-5564. doi: 10.1364/BOE.10.005549. eCollection 2019 Nov 1. Biomed Opt Express. 2019. PMID: 31799030 Free PMC article.
-
Hyperspectral and multispectral bioluminescence optical tomography for small animal imaging.Phys Med Biol. 2005 Dec 7;50(23):5421-41. doi: 10.1088/0031-9155/50/23/001. Epub 2005 Nov 8. Phys Med Biol. 2005. PMID: 16306643
-
In vivo bioluminescence tomography with a blocking-off finite-difference SP3 method and MRI/CT coregistration.Med Phys. 2010 Jan;37(1):329-38. doi: 10.1118/1.3273034. Med Phys. 2010. PMID: 20175496 Free PMC article.
-
Tomographic bioluminescence imaging by use of a combined optical-PET (OPET) system: a computer simulation feasibility study.Phys Med Biol. 2005 Sep 7;50(17):4225-41. doi: 10.1088/0031-9155/50/17/021. Epub 2005 Aug 24. Phys Med Biol. 2005. PMID: 16177541 Free PMC article.
Cited by
-
Non-contact small animal fluorescence imaging system for simultaneous multi-directional angular-dependent data acquisition.Biomed Opt Express. 2014 Jun 18;5(7):2301-16. doi: 10.1364/BOE.5.002301. eCollection 2014 Jul 1. Biomed Opt Express. 2014. PMID: 25071965 Free PMC article.
-
Non-contact dynamic diffuse optical tomography imaging system for evaluating lower extremity vasculature.Biomed Opt Express. 2018 Oct 19;9(11):5597-5614. doi: 10.1364/BOE.9.005597. eCollection 2018 Nov 1. Biomed Opt Express. 2018. PMID: 30460149 Free PMC article.
-
Simultaneous diffuse optical and bioluminescence tomography to account for signal attenuation to improve source localization.Biomed Opt Express. 2020 Oct 16;11(11):6428-6444. doi: 10.1364/BOE.401671. eCollection 2020 Nov 1. Biomed Opt Express. 2020. PMID: 33282499 Free PMC article.
-
Differentiation of tumor vasculature heterogeneity levels in small animals based on total hemoglobin concentration using magnetic resonance-guided diffuse optical tomography in vivo.Appl Opt. 2016 Jul 20;55(21):5479-87. doi: 10.1364/AO.55.005479. Appl Opt. 2016. PMID: 27463894 Free PMC article.
-
Quantitative bioluminescence tomography using spectral derivative data.Biomed Opt Express. 2018 Aug 9;9(9):4163-4174. doi: 10.1364/BOE.9.004163. eCollection 2018 Sep 1. Biomed Opt Express. 2018. PMID: 30615705 Free PMC article.
References
-
- Klerk CP, Overmeer RM, Niers TM, Versteeg HH, Richel DJ, Buckle T, Van Noorden CJ, van Tellingen O. Validity of bioluminescence measurements for noninvasive in vivo imaging of tumor load in small animals. Biotechniques. 2007;43(1 Suppl):7–13. - PubMed
-
- Wang Ge, Cong Wenxiang, Shen Haiou, Qian Xin, Henry Michael, Wang Yue, et al. Overview of bioluminescence tomography-a new molecular imaging modality. Frontiers in Bioscience. 2008;13(1281-1293):190. - PubMed
-
- Ntziachristos Vasilis, Ripoll Jorge, Wang Lihong V, Weissleder Ralph. Looking and listening to light: the evolution of whole-body photonic imaging. Nature biotechnology. 2005;23(3):313–320. - PubMed
Grants and funding
LinkOut - more resources
Full Text Sources
Other Literature Sources