. 2014 May 7:7:50.
doi: 10.1186/1757-2215-7-50. eCollection 2014.

Changes in granulosa cells gene expression associated with growth, plateau and atretic phases in medium bovine follicles

Affiliations

Changes in granulosa cells gene expression associated with growth, plateau and atretic phases in medium bovine follicles

Gabriel Douville et al. J Ovarian Res. .

Abstract

Background: The objective of this study was to build the transcriptomic profile of granulosa cells originating from follicles 6 to 9 mm in diameter in dairy cattle using microarrays.

Methods: Granulosa cells originating from three different phases of antral follicle growth were compared: growing (G), plateau (P) and atresia (A), as categorized by flow cytometry profiles of DNA. The growing and atretic conditions were each hybridized against the plateau condition as a reference in order to understand the specific biological mechanisms modulated in this class of follicles.

Results: 2,942 genes were differentially expressed (P < 0.05) in P vs. G and 1,974 in A vs. P. A clear segregation of the 3 phases was confirmed by between group analysis (BGA). The first characteristic of the plateau phase is the activation of the upstream regulators TP53 and PTEN which participate in the reduction of cell growth through MYC, FOS and E2F1-2-3. We also observed the down-regulation of steroidogenesis genes: CYP11A1 and CYP19A1, in the granulosa cells of the plateau phase relative to the growth phase. On the other hand, the A vs. P contrast showed up-regulation of multiple transcripts associated to apoptosis: CCT2, DAB2, DSG2 and TGM2.

Conclusions: This study offers multiple candidate genes to be further studied in order to elucidate their role in the modulation of follicular development and, ultimately, of oocyte quality.

Keywords: Cow; Granulosa cells; Growth status; Transcriptome.


Figures

Figure 1
Figure 1
A between group analysis (BGA). The analysis was performed using R software [22] and using all probes’ data from the 3 folliculogenesis phases: Growing (Blue), Plateau (green) and Atretic (red).
Figure 2
Figure 2
Histogram of modeled DNA content for follicles 6-9 mm in diameter at different growing phases. The modelization of the growing, plateau and atretic phases, using FlowJo software, gave the proportion of total events in the sub-G1 phase (-G1), corresponding to cells with less than 2n DNA content, G1 phase, corresponding to cells containing 2n of DNA, S phase, corresponding to cells that are duplicating their DNA material, G2 phase, corresponding to cells having completely duplicated their genetic material to 4n. (n = 26 granulosa samples). On the graph, the selected regions correspond to 1) –G1, 2) G0/G1, 3) S.
Figure 3
Figure 3
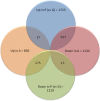
Venn diagram of differently expressed genes. The graph showing genes modulated according to a cut off set at 1.5 for symmetrical fold change and a p-value < 0.05. 2,942 differentially expressed genes between plateau (P) and growing (G) follicle granulosa samples. The atretic (A) versus plateau (P) contrast yielded 1974 differentially expressed genes. 932 genes modulated in both contrasts.
Figure 4
Figure 4
Graphical representations of functional annotations. The Cell Cycle (A, C) and Cell Death (B, D) functional annotations for P (plateau phase) vs. G (growing phase) and A (atretic phase) vs. P (plateau phase) are respectively presented. Dashed blue lines indicate the z-score threshold for statistical significance (-2.00 and +2.00). All annotations were above the –log(p-value) threshold indicating statistically significant overlap between genes from the study’s dataset and genes associated to the annotation in the IPA database (-log(0.05) = 1.3).
Figure 5
Figure 5
Upstream regulator analysis in the contrast G vs P. The regulators in orange are activated and in blue are considered as inhibited. This analysis is based on the genes that are downstream of the regulators and generates P values that were highly significant for the top regulator PTEN. PTEN, Phosphatase and tensin homolog ; HRAS, V-Ha-ras Harvey rat sarcoma viral oncogene homolog; FOXO3, Forkhead box O3; CDKN1A, Cyclin-dependent kinase inhibitor 1A; RB1, Retinoblastoma 1; FOXO1, Forkhead box O1; FOXM1, Forkhead box M1; MYC, V-myc myelocytomatosis viral oncogene homolog; CDKN2A, Cyclin-dependent kinase inhibitor; SP1, Sp1 transcription factor; E2F1-4, E2F transcription factor 1–4; TP53, Tumor protein p53; RBL1, Retinoblastoma-like 1 (p107); ATF4, Activating transcription factor 4.
Figure 6
Figure 6
Upstream regulator analysis in the contrast G vs P. The regulators in orange are activated and in blue are considered as inhibited. This analysis is based on the genes that are downstream of the regulators and generates P values that were highly significant for the top regulator TP53. TP53, Tumor protein p53; CDKN2A, Cyclin-dependent kinase inhibitor; E2F1-2-3-4, E2F transcription factor 1-2-3-4; CDKN1A, Cyclin-dependent kinase inhibitor 1A; YY1, YY1 transcription factor; FOS, FBJ murine osteosarcoma viral oncogene homolog; SP1, Sp1 transcription factor; HIF1A, Hypoxia inducible factor 1, alpha subunit (basic helix-loop-helix transcription factor); MYC, V-myc myelocytomatosis viral oncogene homolog; RB1, Retinoblastoma 1; RBL1, Retinoblastoma-like 1 (p107).
Figure 7
Figure 7
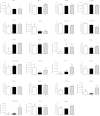
Graphs of gene expression profiles. 23 genes were measured by qRT-PCR in the growing (G) (white box), plateau (P) (black box) and atretic (A) (dashed box) phases (n = 7, 6 and 7 follicles). Different letters above bars correspond to significantly different expression levels (P < 0.05). Error bars represent the standard error of the mean (SEM). BAX, BCL2-associated X protein; BCL2, B-cell CLL/lymphoma 2; CCNB1, Cyclin B1; CCND2, Cyclin D2; CCT2, Chaperonin containing TCP1, subunit 2 (beta); CKS1B, CDC28 protein kinase regulatory subunit 1B; CYP11A1, Cytochrome P450, family 11, subfamily A, polypeptide 1; CYP19A1, Cytochrome P450, family 19, subfamily A, polypeptide 1; DAB2, Disabled-2 DSG2 Desmoglein-2; FAS, Fas (TNF receptor superfamily, member 6); FOSL1, FOS-like antigen 1; GADD45A, Growth arrest and DNA-damage-inducible, alpha; HSD3B1, Hydroxy-delta-5-steroid dehydrogenase, 3 beta- and steroid delta-isomerase 1; ID3, Inhibitor of DNA binding 3, dominant negative helix-loop-helix protein; OLR1, Low density lipoprotein (lectin-like) receptor 1; PCNA, Proliferating cell nuclear antigen; SOD2, superoxide dismutase 2, mitochondrial; STK17A, serine/threonine kinase 17a; TGM2, Transglutaminase 2 (C polypeptide, protein-glutamine-gamma-glutamyltransferase); TNFRSF21, Tumor necrosis factor receptor superfamily, member 21; TP53, Tumor protein p53; XIRP1, Xin actin-binding repeat containing 1.

Similar articles

Cited by

References

    1. Erickson BH. Development and senescence of the postnatal bovine ovary. J Anim Sci. 1966;25(3):800–805. - PubMed
    1. Aerts JM, Bols PE. Ovarian follicular dynamics: a review with emphasis on the bovine species. Part I: Folliculogenesis and pre-antral follicle development. Reprod Domest Anim. 2010;45(1):171–179. doi: 10.1111/j.1439-0531.2008.01302.x. - DOI - PubMed
    1. Oktem O, Urman B. Understanding follicle growth in vivo. Hum Reprod. 2010;25(12):2944–2954. doi: 10.1093/humrep/deq275. - DOI - PubMed
    1. Braw-Tal R, Yossefi S. Studies in vivo and in vitro on the initiation of follicle growth in the bovine ovary. J Reprod Fertil. 1997;109(1):165–171. doi: 10.1530/jrf.0.1090165. - DOI - PubMed
    1. Sorensen RA, Wassarman PM. Relationship between growth and meiotic maturation of the mouse oocyte. Dev Biol. 1976;50(2):531–536. doi: 10.1016/0012-1606(76)90172-X. - DOI - PubMed

Publication types