

Growth charts for patients with Hunter syndrome
- PMID: 24955330
- PMCID: PMC4060980
- DOI: 10.1016/j.ymgmr.2013.10.001
Growth charts for patients with Hunter syndrome
Abstract
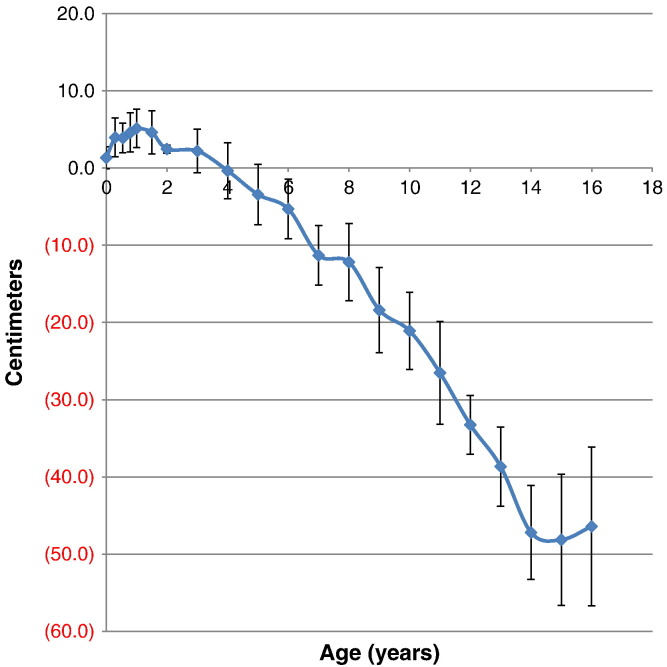
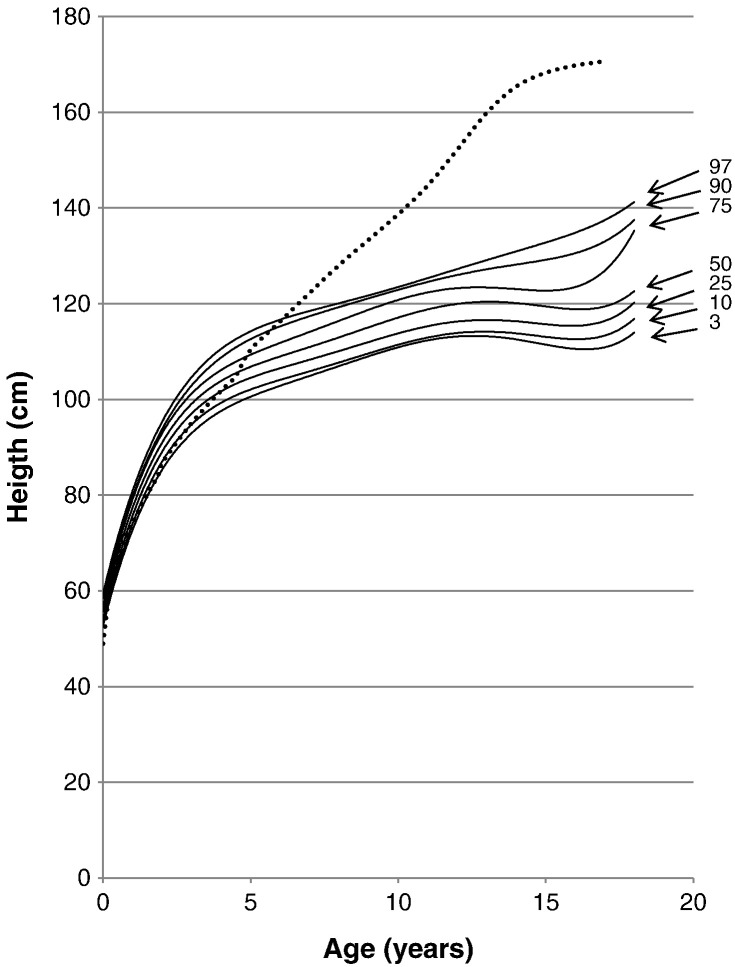
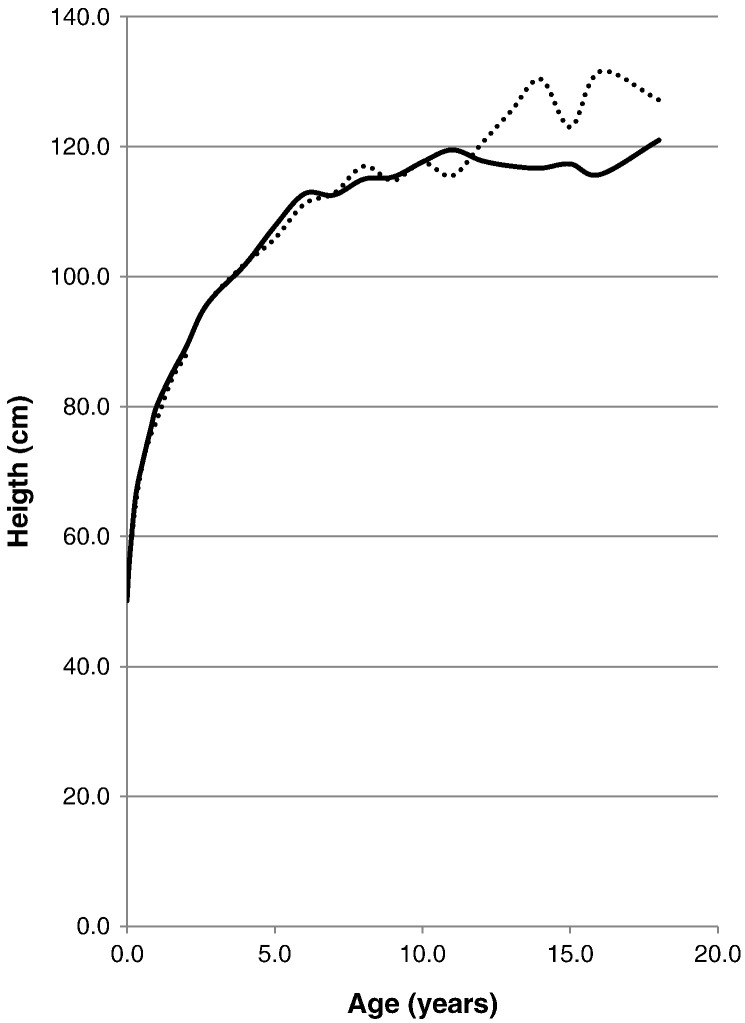
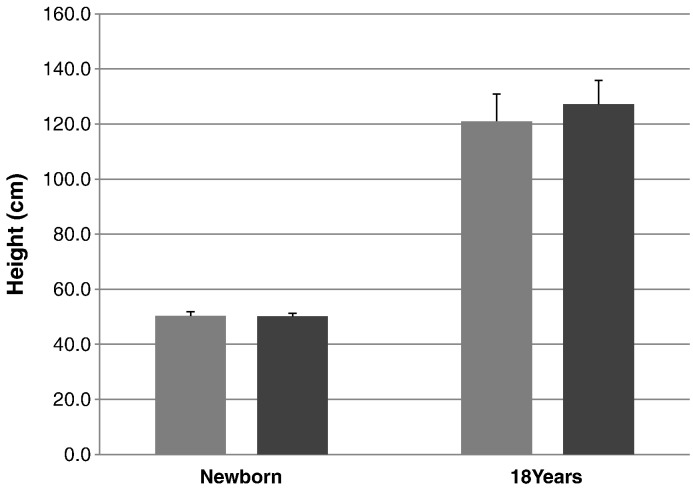
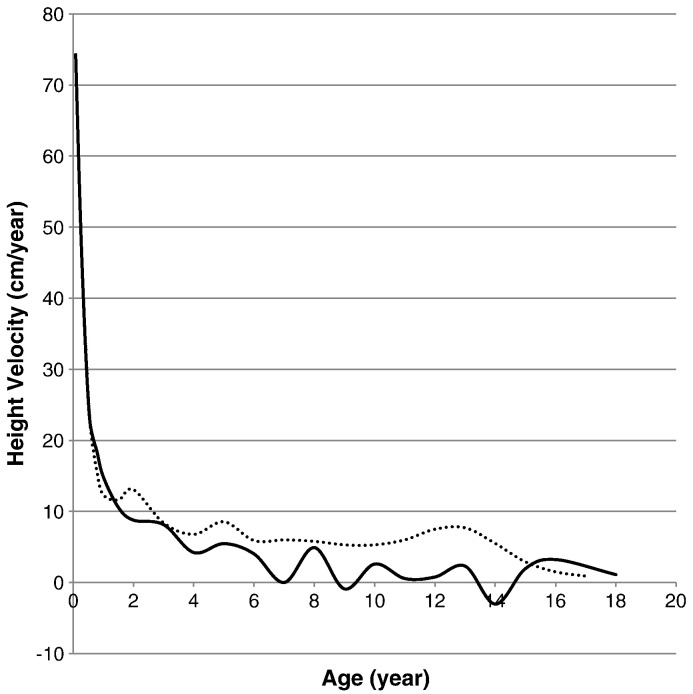
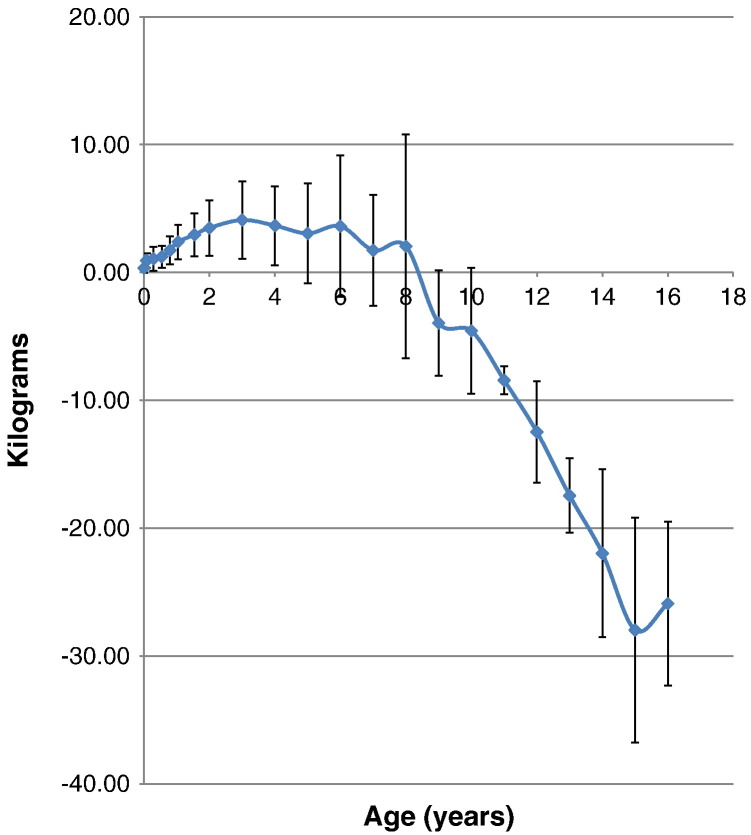
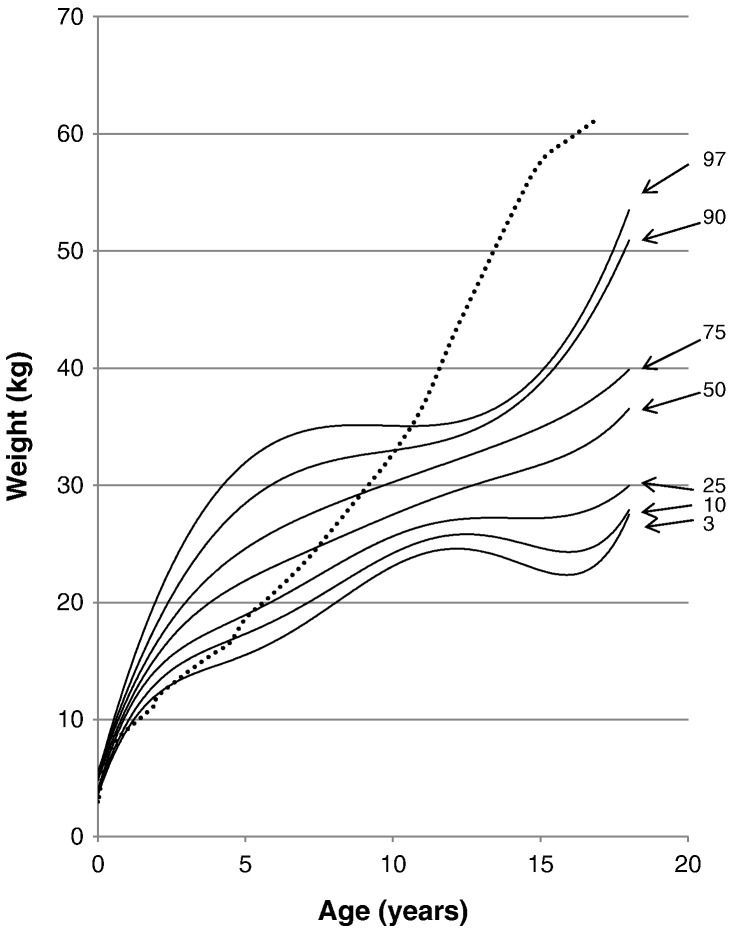
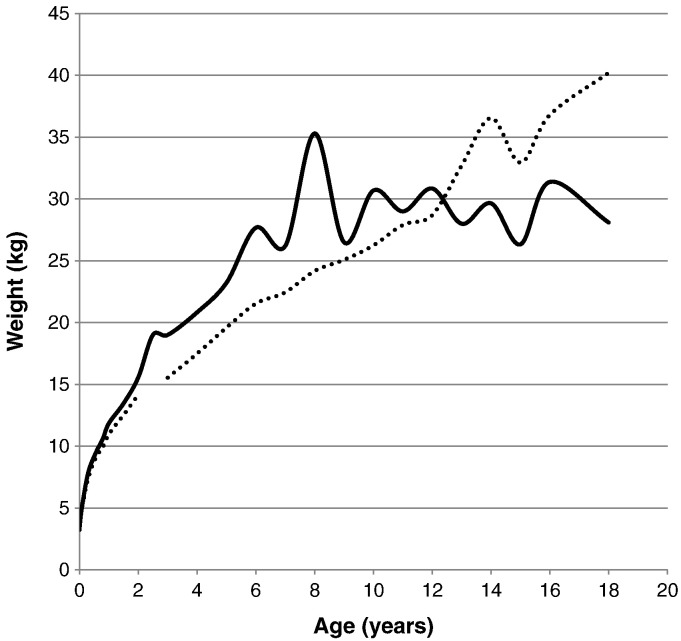
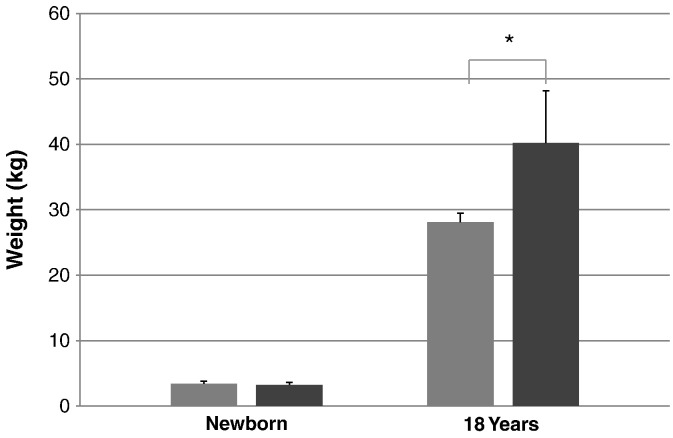
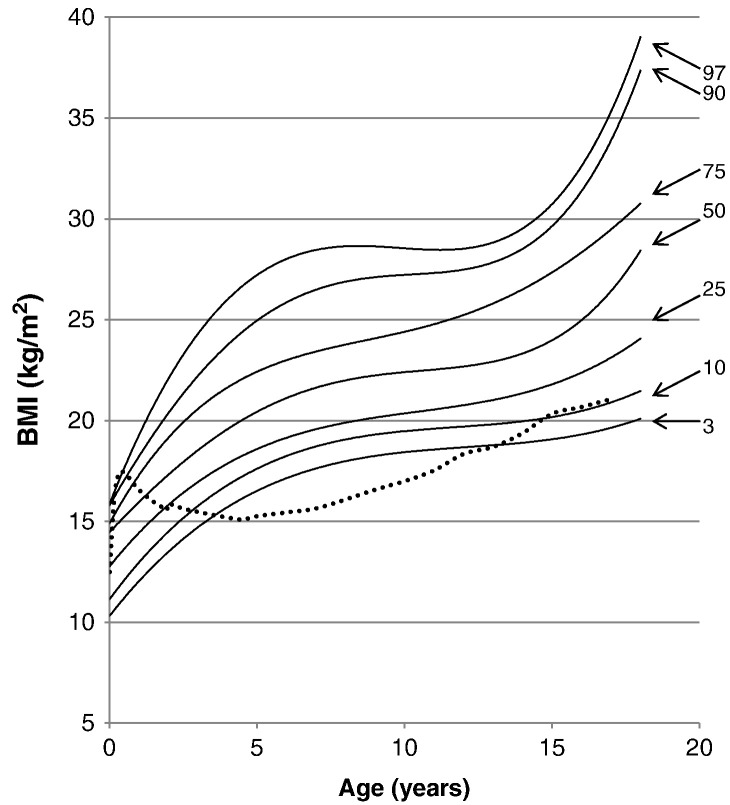
Children with mucopolysaccharidosis II (MPS II), also known as Hunter syndrome, an X-linked disorder, suffer from a multisystem dysfunction caused by the accumulation of glycosaminoglycans. However, there has been no systemic report on the growth of patients with MPS II. The purpose of this study is to describe the growth patterns of patients with MPS II and to compare with the patterns of age-matched controls. Data (height, weight, age, etc.) was collected in a longitudinal study of Japanese male patients with MPS II (n = 111). The mean birth length was 50.31 ± 1.42 cm, while the mean birth weight was 3.35 ± 0.39 kg. The mean final height and weight at 18 years and older were 125.63 ± 9.09 cm and 37.18 ± 8.72 kg; corresponding to a difference of -46.40 cm and -25.89 kg lower, when compared with healthy Japanese male controls. The mean birth BMI was 10.84 ± 3.29 kg/m2, while the mean BMI at 18 years was 29.41 ± 6.15 kg/m2. The growth pattern in patients with MPS II was characterized by overgrowth for the first several years, although growth velocity fell below that of the normal healthy controls after one year of age. No statistical difference in height was observed between patients with the attenuated and severe phenotypes in each age class. In conclusion, this report describes the natural history of growth in patients with MPS II, which can help in monitoring the progression of the disease as well as assessing therapeutic efficacy.
Keywords: Growth charts; Height Velocity; Hunter Syndrome; Lysosomal Storage Disorders; Mucopolysaccaridosis type II.
Figures
References
-
- Scarpa M. Mucopolysaccharidosis Type II. In: Pagon R.A., Adam M.P., Bird T.D., Dolan C.R., Fong C.T., Stephens K., editors. GeneReviews™ [Internet] University of Washington; Seattle (WA): Nov 06 2007. pp. 1993–2013. (updated 2011 Feb 22)
-
- Valayannopoulos V. Enzyme replacement therapy and substrate reduction therapy in lysosomal storage disorders with neurological expression. Handb. Clin. Neurol. 2013;113:1851–1857. - PubMed
-
- Wraith J.E., Beck M., Giugliani R., Clarke J., Martin R., Muenzer J. HOS investigators. Initial report from the Hunter Outcome Survey. Genet. Med. 2008;10:508–516. - PubMed
-
- da Silva E.M.K., Strufaldi M.L.W., Andriolo R.B., Silva L.A. Enzyme replacement therapy with idursulfase for mucopolysaccharidosis type II (Hunter syndrome) Cochrane Database Syst. Rev. 2011;(11) (Art. No.: CD008185) - PubMed
-
- Nelson J., Crowhurst J., Carey B., Greed L. Incidence of the mucopolysaccharidoses in Western Australia. Am. J. Med. Genet. A. 2003;123A:310–313. - PubMed
Grants and funding
LinkOut - more resources
Full Text Sources
Other Literature Sources
