

Amygdala Atrophy in MCI/Alzheimer's Disease in the BIOCARD cohort based on Diffeomorphic Morphometry
Affiliations
- PMID: 24955432
- PMCID: PMC4063307
Item in Clipboard
Amygdala Atrophy in MCI/Alzheimer's Disease in the BIOCARD cohort based on Diffeomorphic Morphometry
Med Image Comput Comput Assist Interv.
2012 Oct.
Abstract
Surface-based deformation markers obtained from diffeomorphic mapping of the amygdala are used to study specific atrophy patterns in a combined mild cognitively impaired and demented cohort compared with cognitively normal aging subjects. Statistical analysis demonstrates with high significance in a small sample of legacy data that deformation-based morphometry provides sensitive markers for locating atrophy in the amygdala. With respect to a high-field amygdala atlas, significant atrophy was found in the basomedial and lateral nucleus subregions.
Figures

Left: surface mesh reconstruction of amygdala (green), entorhinal cortex (red), hippocampus (blue), ventricle (gray) from one BIOCARD subject. Right: Corresponding MRI section with reconstructed structures embedded in the MRI volume.

Left amygdala under the NIH diagnosis using the template-centered analysis at a familywise error rate (FWER) of 5%. The blue hippocampus is shown as a reference in the same orientation as Fig. 1. The scale shows the range of average log-Jacobian with positive values indicating compression.
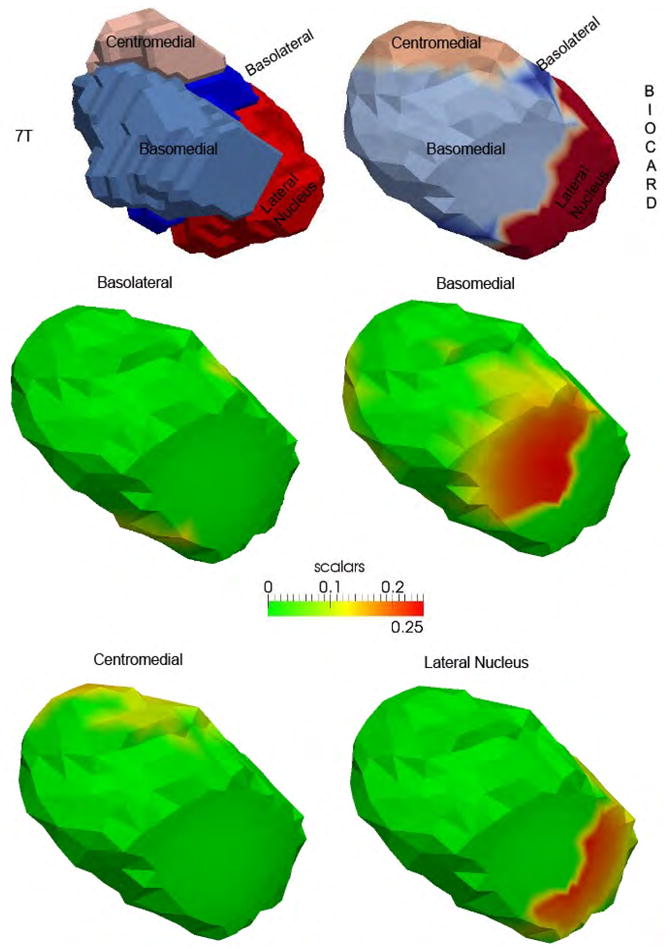
Top row shows the 7T high field amygdala template (left) with four subfields defined from the 0.8mm isotropic 7T MRI and the subfields transferred to the 1.5T population template (right). Middle and bottom row shows the statistical results (Fig. 2) for the template partitioned into the four basolateral, basomedial, centromedial, and lateral nucleus subfields. The reconstruction is shown in the same orientation as Figs. 1–2.
References
-
- Jernigan TL, et al. Cerebral Structure on Mri.2. Specific Changes in Alzheimers and Huntingtons Diseases. Biological Psychiatry. 1991;29(1):68–81. - PubMed
-
- Braak H, Braak E. Neuropathological stageing of Alzheimer-related changes. Acta Neuropathol. 1991;82(4):239–59. - PubMed
-
- Arnold SE, et al. The topographical and neuroanatomical distribution of neurofibrillary tangles and neuritic plaques in the cerebral cortex of patients with Alzheimer’s disease. Cereb Cortex. 1991;1(1):103–16. - PubMed
-
- Price JL, Morris JC. Tangles and plaques in nondemented aging and “preclinical” Alzheimer’s disease. Ann Neurol. 1999;45(3):358–68. - PubMed
Grants and funding
LinkOut - more resources
Full Text Sources