. 2014 Jun 20;15(6):11126-41.
doi: 10.3390/ijms150611126.

TRAF6 inhibition rescues dexamethasone-induced muscle atrophy

Affiliations

TRAF6 inhibition rescues dexamethasone-induced muscle atrophy

Hualin Sun et al. Int J Mol Sci. .

Abstract

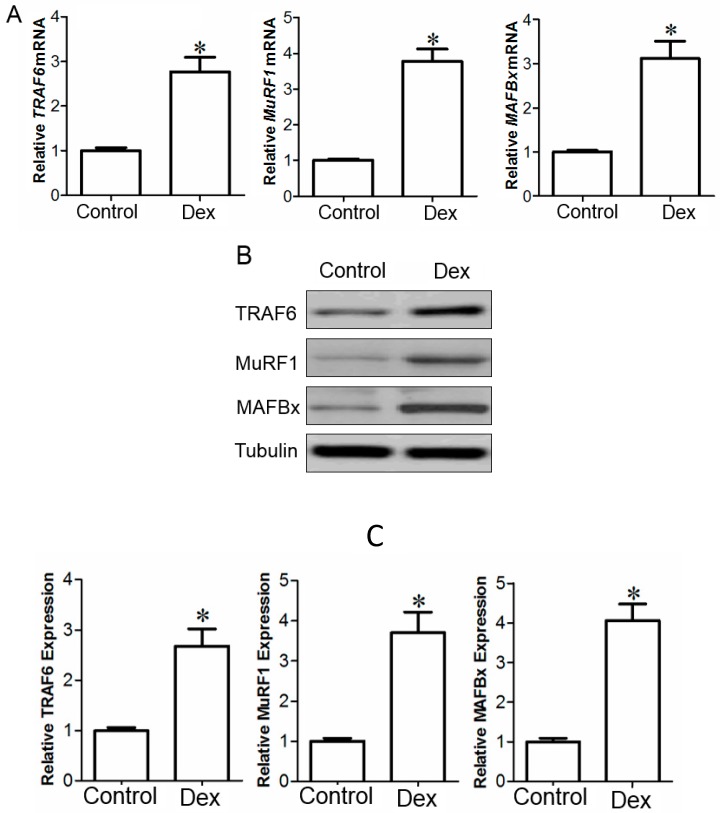
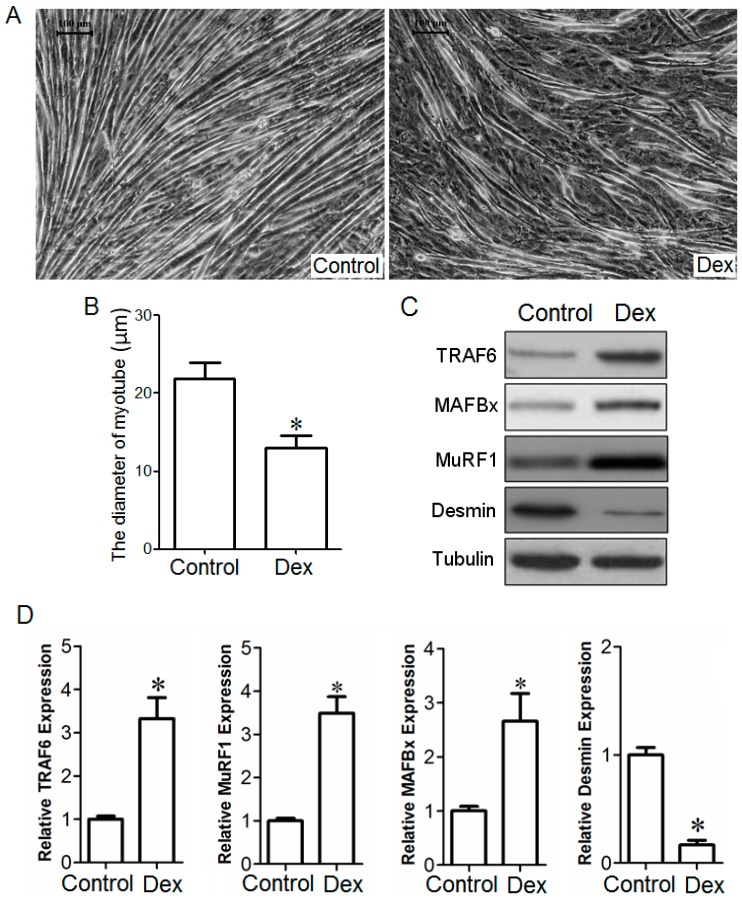
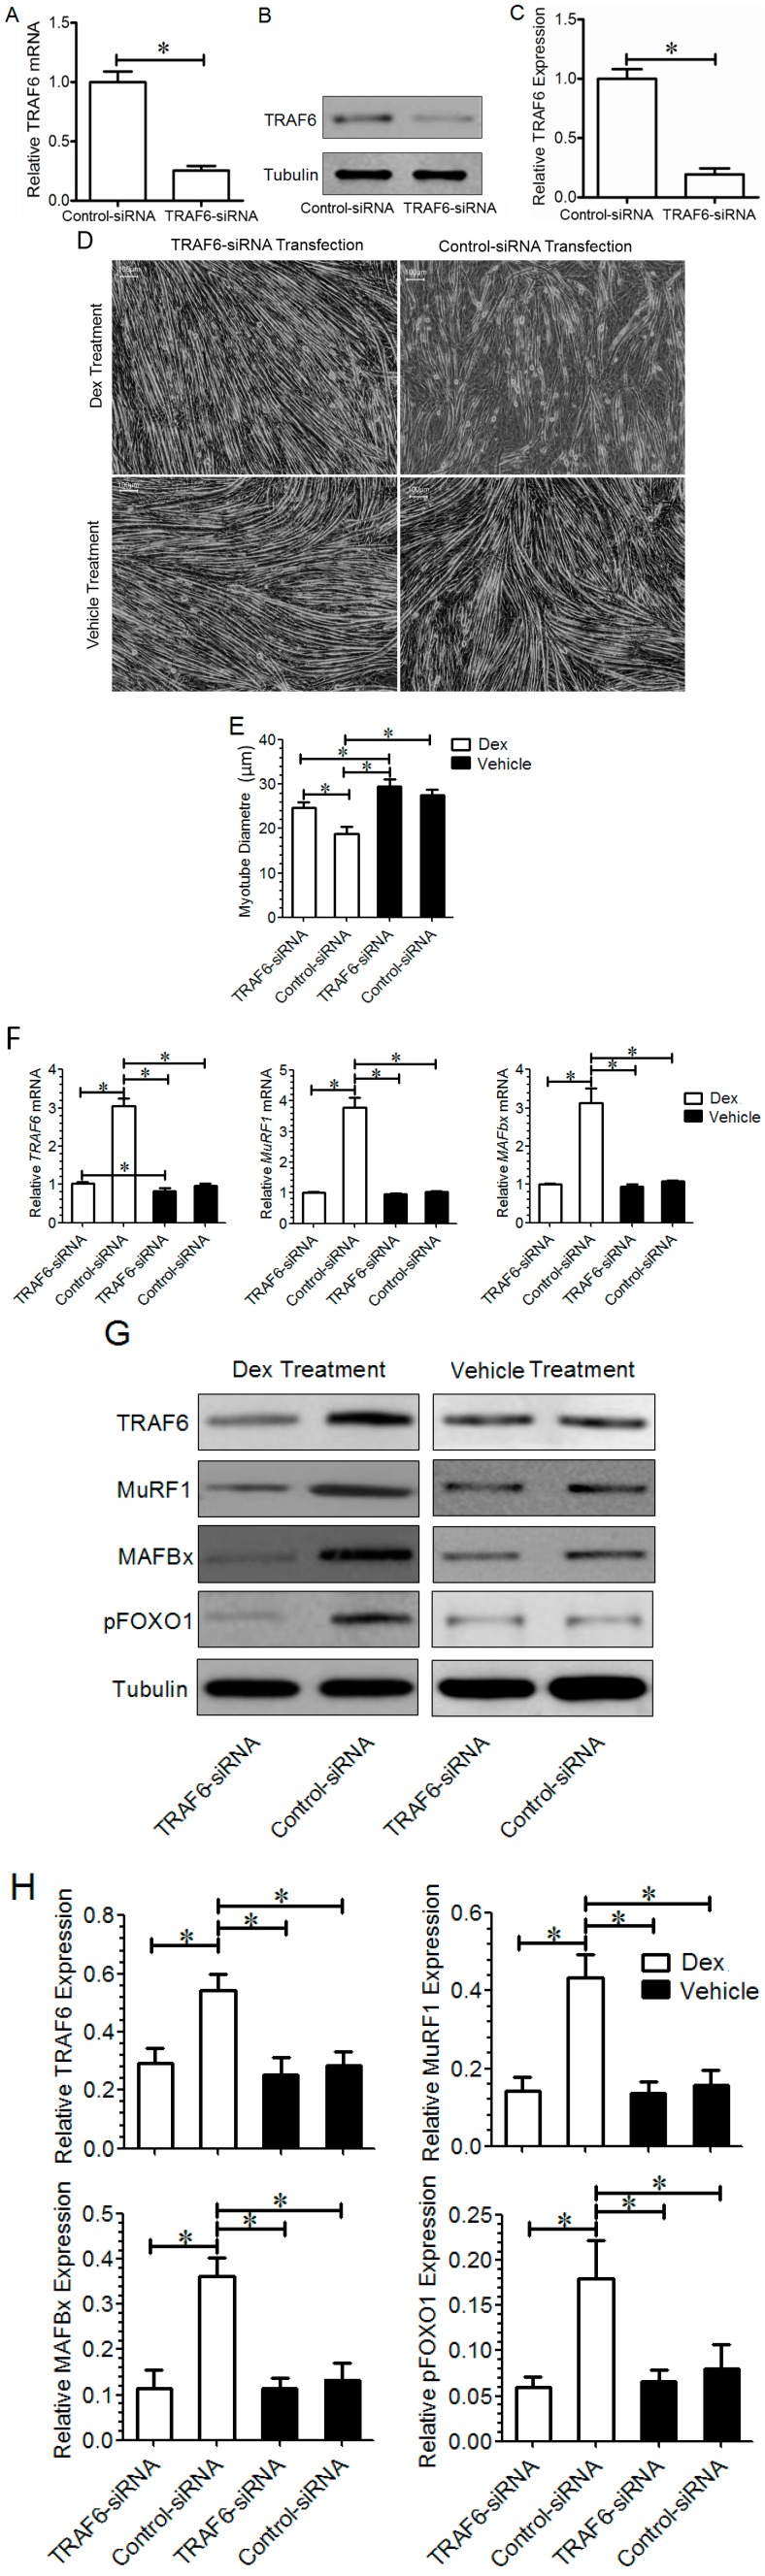
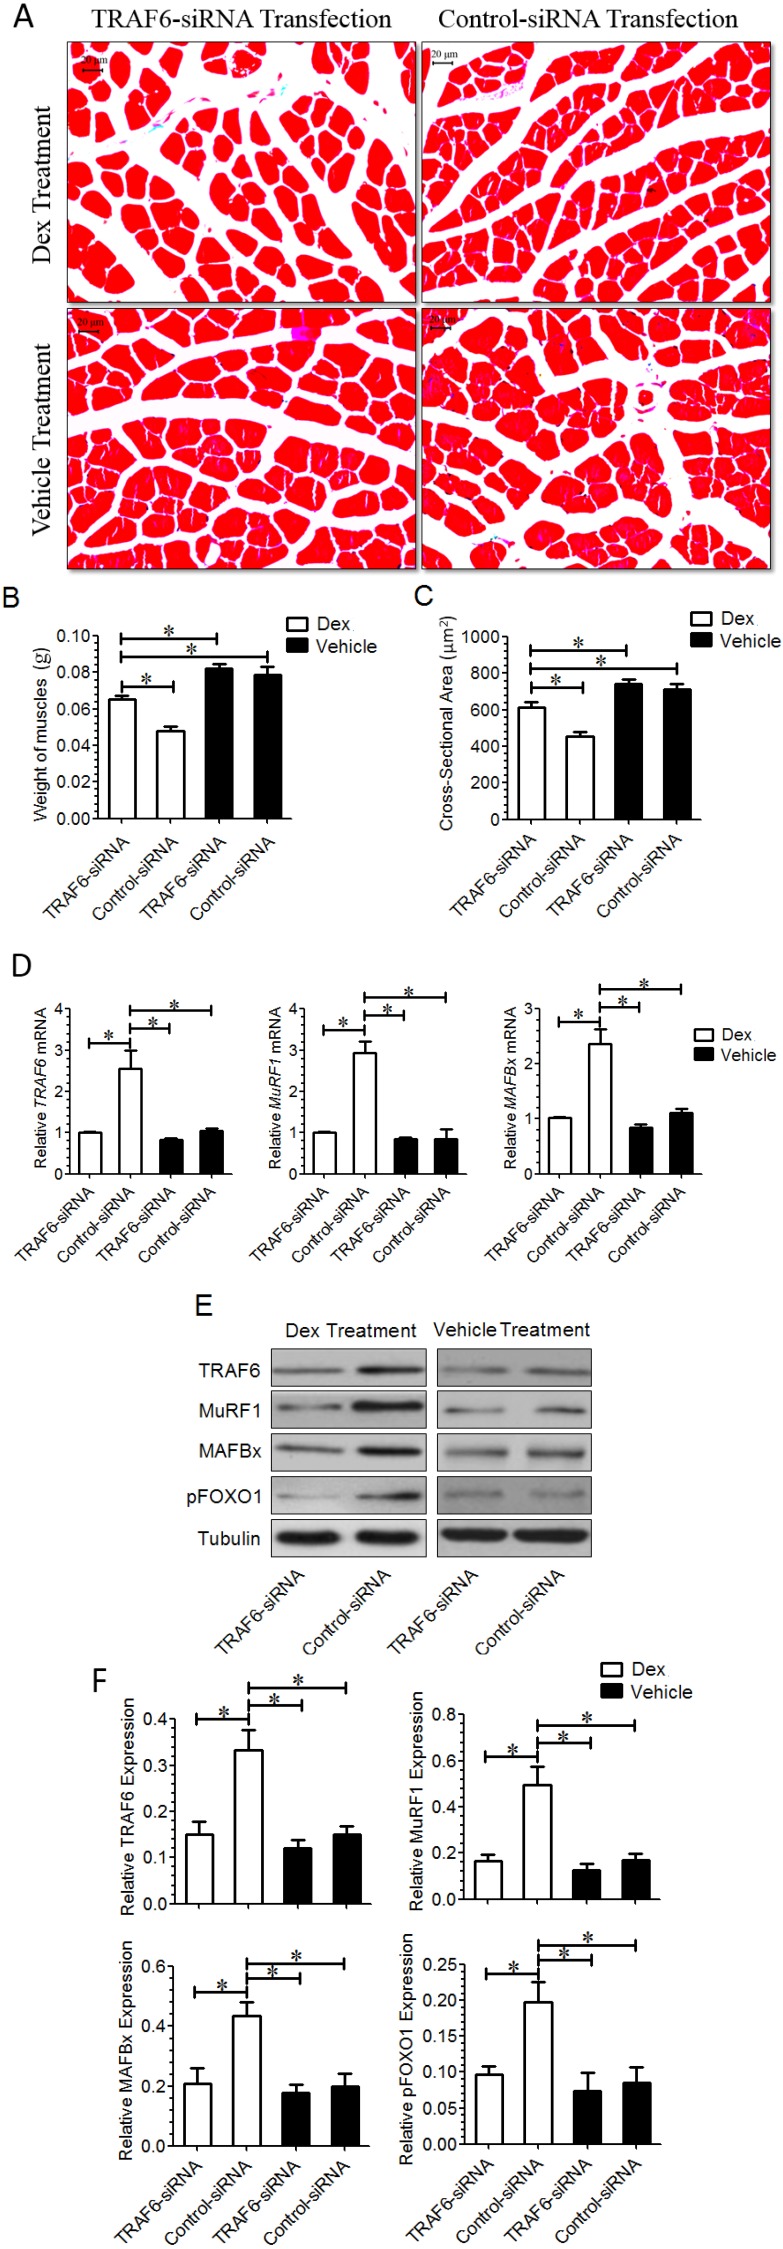
Tumor necrosis factor receptor-associated factor 6 (TRAF6), a unique E3 ubiquitin ligase and adaptor protein, is involved in activation of various signaling cascades. Recent studies identify TRAF6 as one of the novel regulators of skeletal muscle atrophy. The role of TRAF6 in glucocorticoid-induced muscle atrophy, however, remains to be elucidated. In this study, we show that TRAF6 and its downstream signaling molecules, muscle atrophy F-box (MAFBx) and muscle ring finger 1 (MuRF1), were all upregulated in dexamethasone-induced atrophy of mouse C2C12 myotubes or mouse tibialis anterior (TA) muscle. To further investigate the role of TRAF6 in dexamethasone-induced muscle atrophy, TRAF6-siRNA was used to transfect cultured C2C12 myotubes or was injected into the TA muscle of mice respectively, and we note that TRAF6 knockdown attenuated dexamethasone-induced muscle atrophy in vitro and in vivo, and concomitantly decreased the expression of MuRF1 and MAFBx. Our findings suggest that a decreased expression of TRAF6 could rescue dexamethasone-induced skeletal muscle atrophy through, at least in part, regulation of the expression of MAFBx and MuRF1.


Figures

Figure 1
Figure 1
(A) Image of the hind limb of mice receiving daily intraperitoneal injection with 0.1 mL of vehicle (saline, control) or Dex (dexamethasone sodium phosphate in saline, 10 mg/kg) for 14 days, respectively; (B,D) Bar graphs showed the weight (B) and cross sectional area (CSA, D) of the TA muscle of mice injected with vehicle (control) or Dex respectively. Data are presented as mean ± SD, n = 9 per animal group, * p < 0.05 versus control; Also shown (C) is a representative image of Masson trichrome staining for determining the CSA of the mouse TA muscle. Scale bar = 20 μm.
Figure 2
Figure 2
The qPCR (quantitative real-time PCR) (A) and Western blot analysis (B,C) showed the mRNA (A) and protein (B,C) expressions of TRAF6, MAFBx, and MuRF1 in the TA muscle of mice injected with vehicle (saline, control) or Dex (dexamethasone sodium phosphate in saline, 10 mg/kg) respectively. Data are presented as mean ± SD, n = 9 per animal group, * p < 0.05 versus control. Also shown (B) is a representative Western blot image. GAPDH and tubulin were used as a loading control in qPCR and Western blot analysis.
Figure 3
Figure 3
(A) Micrograph showed the morphology of C2C12 myotubes cultured in vehicle (0.1% ethanol-containing plain medium, control) or stimulated by Dex (dexamethasone in vehicle) respectively. Scale bar = 100 μm; (B) Bar graph compared the diameter of C2C12 myotubes cultured in vehicle (control) or stimulated by Dex respectively; and (C,D) Representative Western blot image and Bar graphs displayed the protein expression of TRAF6, MAFBx, MuRF1, and desmin in C2C12 myotubes cultured in vehicle (control) or stimulated by Dex respectively. Tubulin were used as a loading control in Western blot analysis. All data in bar graphs are presented as mean ± SEM (standard error of the mean) from three independent experiments, * p < 0.05 versus control.
Figure 4
Figure 4
The qPCR (A) and Western blot analysis (B,C) showed that C2C12 myotubes were transfected with TRAF6-siRNA or control-siRNA; Micrographs (D) showed the morphology of Dex- or vehicle-treated C2C12 myotubes after transfection with TRAF6-siRNA and control-siRNA respectively. Scale bar = 100 μm; Bar graph (E) showed the diameter of Dex- or vehicle-treated C2C12 myotubes after transfection with TRAF6-siRNA and control-siRNA respectively; The qPCR and Western blot analysis showed the mRNA (F) and protein (G,H) expressions of TRAF6, MAFBx, and MuRF1, as well as the protein expression of pFOXO-1 in Dex- or vehicle-treated C2C12 myotubes after transfection with TRAF6-siRNA and control-siRNA respectively. GAPDH and tubulin were used as a loading control in qPCR and Western blot analysis. All data in bar graphs are presented as mean ± SEM from three independent experiments, * p < 0.05.
Figure 5
Figure 5
(A) Masson trichrome staining image of the TA muscle from mice co-injected with both Dex and control-siRNA, with both Dex and TRAF6-siRNA, with both vehicle and control-siRNA, or with both vehicle and TRAF6-siRNA, respectively, for 14 days; (B,C) Bar graphs showed the weight (B) and cross sectional area (CSA, C) of the TA muscle from mice co-injected with each of the above four combinations respectively. Scale bar =20 μm; (DF) The qPCR and Western blot analysis showed the comparison in the mRNA (D) and protein; and (E,F) expression of TRAF6, MAFBx, and MuRF1, as well as the protein expression of pFOXO-1 in the TA muscle of mice co-injected with each of the above four combinations respectively. GAPDH and tubulin were used as a loading control in qPCR and Western blot analysis, respectively. All data in bar graphs are presented as mean ± SD, n = 9 per animal group,* p < 0.05.

References

    1. Bodine S.C., Latres E., Baumhueter S., Lai V.K., Nunez L., Clarke B.A., Poueymirou W.T., Panaro F.J., Na E., Dharmarajan K. Identification of ubiquitin ligases required for skeletal muscle atrophy. Science. 2001;294:1704–1708. doi: 10.1126/science.1065874. - DOI - PubMed
    1. Jackman R.W., Kandarian S.C. The molecular basis of skeletal muscle atrophy. Am. J. Physiol. Cell Physiol. 2004;287:C834–C843. doi: 10.1152/ajpcell.00579.2003. - DOI - PubMed
    1. Piccirillo R., Demontis F., Perrimon N., Goldberg A.L. Mechanisms of muscle growth and atrophy in mammals and Drosophila. Dev. Dyn. 2014;243:201–215. doi: 10.1002/dvdy.24036. - DOI - PMC - PubMed
    1. Piccirillo R., Goldberg A.L. The p97/VCP ATPase is critical in muscle atrophy and the accelerated degradation of muscle proteins. EMBO J. 2012;31:3334–3350. doi: 10.1038/emboj.2012.178. - DOI - PMC - PubMed
    1. Jones A., Hwang D.J., Narayanan R., Miller D.D., Dalton J.T. Effects of a novel selective androgen receptor modulator on dexamethasone-induced and hypogonadism-induced muscle atrophy. Endocrinology. 2010;151:3706–3719. doi: 10.1210/en.2010-0150. - DOI - PubMed

Publication types

MeSH terms

LinkOut - more resources