. 2014 Jun 23;9(6):e99520.
doi: 10.1371/journal.pone.0099520. eCollection 2014.

Genetic deletion of transglutaminase 2 does not rescue the phenotypic deficits observed in R6/2 and zQ175 mouse models of Huntington's disease

Affiliations

Genetic deletion of transglutaminase 2 does not rescue the phenotypic deficits observed in R6/2 and zQ175 mouse models of Huntington's disease

Liliana B Menalled et al. PLoS One. .

Abstract

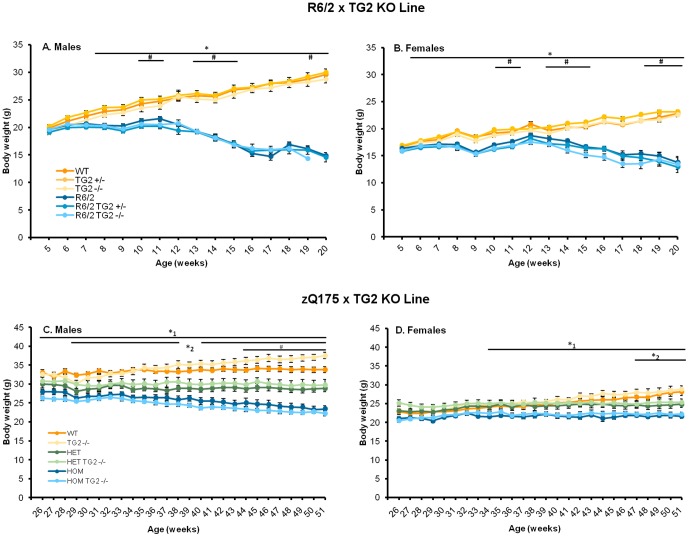
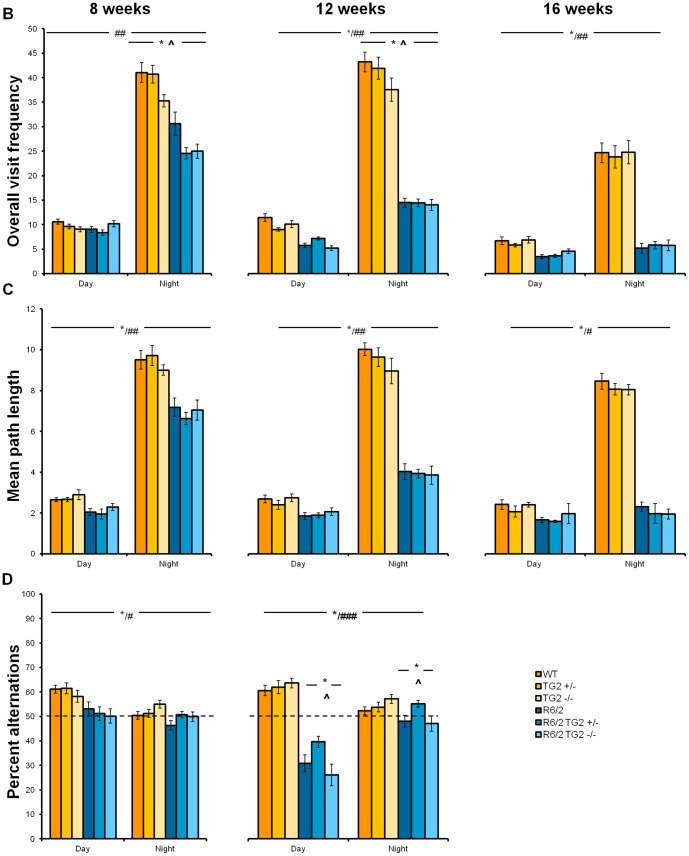
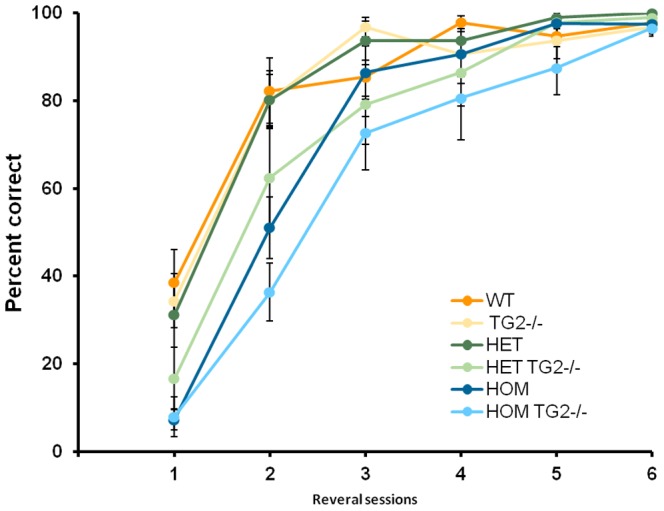
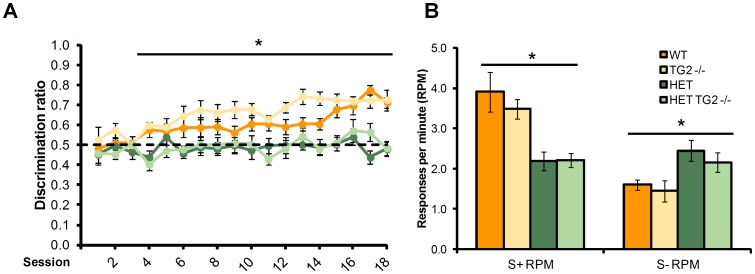
Huntington's disease (HD) is an autosomal dominant, progressive neurodegenerative disorder caused by expansion of CAG repeats in the huntingtin gene. Tissue transglutaminase 2 (TG2), a multi-functional enzyme, was found to be increased both in HD patients and in mouse models of the disease. Furthermore, beneficial effects have been reported from the genetic ablation of TG2 in R6/2 and R6/1 mouse lines. To further evaluate the validity of this target for the treatment of HD, we examined the effects of TG2 deletion in two genetic mouse models of HD: R6/2 CAG 240 and zQ175 knock in (KI). Contrary to previous reports, under rigorous experimental conditions we found that TG2 ablation had no effect on either motor or cognitive deficits, or on the weight loss. In addition, under optimal husbandry conditions, TG2 ablation did not extend R6/2 lifespan. Moreover, TG2 deletion did not change the huntingtin aggregate load in cortex or striatum and did not decrease the brain atrophy observed in either mouse line. Finally, no amelioration of the dysregulation of striatal and cortical gene markers was detected. We conclude that TG2 is not a valid therapeutic target for the treatment of HD.


Conflict of interest statement

Competing Interests: The authors have declared that no competing interests exist. DH, IMS, LP and DM are employed by CHDI Management, Inc., as advisors to CHDI Foundation, Inc. LM, AK, SO, AF, NP, IF, SM, MK, MO, JB, JT, JF, RM, KC, KMC, MM, DH, DB and SR are employed by PsychoGenics, Inc. PT and KL are employed by Charles River Research Services. There are no patents, products in development or marketed products to declare. This declaration does not alter the authors' adherence to all PLoS ONE policies regarding sharing data and materials.

Figures

Figure 1
Figure 1. Transglutaminase 2 protein levels in R6/2×TG2 KO line.
A. TG2 expression levels in the striatum of 12 week old animals from the R6/2×TG2 KO line (n = 11–12 per genotype). *p<0.05,***p<0.0001. See materials and methods' section for details regarding the calculation of TG2 protein expression levels. B. Westen blotting examples of striatal lysates of animals from the R6/2×TG2 KO line probed with antibodies that recognize TG2 and the housekeeping proteins.
Figure 2
Figure 2. Body weight curves.
A–B. Mean body weights of mice from the R6/2×TG2 KO line. A. Male mice (n = 14–16 per genotype). B. Female mice (n = 13–16 per genotype). C–D Mean body weights of mice from the zQ175×TG2 KO line. A. Male mice (n = 5–6 per genotype). B. Female mice (n = 6–7 per genotype). *Significant differences R6/2 vs WT,*1significant differences HOM vs WT, *2significant differences HET vs. WT, #significant TG2 genotype differences. WT: wild-type, TG2+/−: heterozygous TG2 knockout, TG2−/−: homozygous TG2 knockout, HET: zQ175 HET HOM: zQ175 HOM.
Figure 3
Figure 3. Behavioral data captured in the PhenoCube system as a function of genotype, age and light cycle phase in animals from the R6/2×TG2 KO line.
A. Overall visit frequency. B. Mean path length. C. Percent alternations (Data for this measure were not collected at 16 weeks of age since R6/2 mice were not tested in this protocol due to reduced licking). *Significant HD genotype differences within each light phase, at each age; #: significant differences due to light phase in the diurnal cycle in the WT mice; ##significant differences due to light phase in the cycle for each age independently of genotype; ###significant differences due to light phase in the diurnal cycle in the R6/2 mice; ∧significant TG2 genotype differences. WT: wild-type, TG2+/−: heterozygous TG2 knockout, TG2−/−: homozygous TG2 knockout.
Figure 4
Figure 4. Overall visit frequency detected in the PhenoCube system as a function of genotype, age and light cycle phase in animals from the zQ175×TG2 KO line.
*Significant HD genotype differences regardless of the light phase (in the mean path length the differences were detected between HET and WT animals); ##significant differences due to light phase in the cycle independently of genotype; ∧significant TG2 genotype differences (see results method for details). WT: wild-type, TG2−/−: homozygous TG2 knockout, HET: zQ175 HET, HOM: zQ175 HOM.
Figure 5
Figure 5. Acquisition of the procedural T-maze task (n = 20–24 per genotype).
A. Proportion of mice acquiring the task on each test day. B. Average (±SEM) number of days to acquire the task (only animals that fulfill the acquisition criterion within 10 training days were included). *Significant HD genotype effect. WT: wild-type, TG2+/−: heterozygous TG2 knockout, TG2−/−: homozygous TG2 knockout.
Figure 6
Figure 6. Reversal phase of the procedural T–maze task (platform location switched; n = 19–24 per genotype).
The graph shows the mean (±SEM) percent correct for each group, on each test day. WT: wild-type, TG2+/−: heterozygous TG2 knockout, TG2−/−: homozygous TG2 knockout.
Figure 7
Figure 7. Acquisition of the procedural T-maze task in the zQ175×TG2 KO animals (n = 11–12, per genotype).
A. Proportion of mice acquiring the task on each test day. B. Average (±SEM) number of days to acquire the task. WT: wild-type, TG2+/−: heterozygous TG2 knockout, TG2−/−: homozygous TG2 knockout, HET: zQ175 HET, HOM: zQ175 HOM.
Figure 8
Figure 8. Reversal phase of the procedural T–maze task (platform location switched; n = 11–12 per genotype).
WT: wild-type, TG2−/−: homozygous TG2 knockout, HET: zQ175 HET, HOM: zQ175 HOM.
Figure 9
Figure 9. Mean number of days required to obtain 40 reinforcers across two consecutive sessions during the training phase (n = 6–12 per genotype).
*Significant HD genotype effect. WT: wild-type, TG2−/−: homozygous TG2 knockout, HET: zQ175 HET.
Figure 10
Figure 10. Discrimination performance (n = 6–12 per genotype).
A. Discrimination ratio across the training period. B. Response rate for the reinforced (S+ RPM) and unreinforced (S- RPM) conditions averaged across the final four sessions for the zQ175×TG2 KO line. *Significant HD genotype effect. WT: wild-type, TG2−/−: homozygous TG2 knockout, HET: zQ175 HET.
Figure 11
Figure 11. The relative striatal (left panels) and cortical (right panels) mRNA expression level of mice examined from the R6/2×TG2 KO line at 12 weeks of age (n = 12 per genotype).
Relative mRNA levels are normalized to WT controls. For normalization, the geometric means of Ubc, Eif4a2 an Atp5b were used. *Significant HD Genotype effect; #significant TG2 Genotype effect. WT: wild-type, TG2+/−: heterozygous TG2 knockout, TG2−/−: homozygous TG2 knockout.
Figure 12
Figure 12. The relative striatal mRNA expression level of mice examined from the zQ175×TG2 KO line at 12 months of age (n = 7–12 per genotype).
Relative mRNA levels are normalized to zQ175_WT TG2_WT controls. For normalization, the geometric means of Ubc, Eif4a2 an Atp5b were used. *Significant HD Genotype effect. WT: wild-type, TG2+/−: heterozygous TG2 knockout, TG2−/−: homozygous TG2 knockout, HET: zQ175 HET.
Figure 13
Figure 13. Seprion ligand quantification of aggregate load.
A. Aggregate load in cortical tissues from 12-week-old R6/2×TG2 KO mice. The background readings obtained from the WT animals (n = 3 per group) were averaged and subtracted from the readings obtained from the R6/2 animals in order to remove the baseline reading. B. Aggregate load in striatal tissues from 52-week-old zQ175×TG2 KO mice. The readings obtained from the zQ175_WT animals (n = 5–7 per group) were averaged and subtracted from the readings obtained from the zQ175_HET animals in order to remove the baseline reading. WT: wild-type, TG2+/−: heterozygous TG2 knockout, TG2−/−: homozygous TG2 knockout, HET: zQ175 HET.
Figure 14
Figure 14. Whole brain, striatal and cortical volumes of 16-week-old R6/2×TG2 KO mice (top panels, n = 6 per genotype per sex) and of 52-weeks-old zQ175×TG2 KO mice (bottom panels, n = 6 per genotype per sex).
*Significant differences compared to WT animals, #significant differences compared to HET mice. WT: wild-type, TG2+/−: heterozygous TG2 knockout, TG2−/−: homozygous TG2 knockout, HET: zQ175 HET, HOM; zQ175HOM.

Similar articles

Cited by

References

    1. Greenberg CS, Birckbichler PJ, Rice RH (1991) Transglutaminases: multifunctional cross-linking enzymes that stabilize tissues. FASEB J 5: 3071–3077. - PubMed
    1. Im MJ, Riek RP, Graham RM (1990) A novel guanine nucleotide-binding protein coupled to the alpha 1-adrenergic receptor. II. Purification, characterization, and reconstitution. J Biol Chem 265: 18952–18960. - PubMed
    1. Lai TS, Slaughter TF, Peoples KA, Hettasch JM, Greenberg CS (1998) Regulation of human tissue transglutaminase function by magnesium-nucleotide complexes. Identification of distinct binding sites for Mg-GTP and Mg-ATP. J Biol Chem 273: 1776–1781. - PubMed
    1. Hasegawa G, Suwa M, Ichikawa Y, Ohtsuka T, Kumagai S, et al. (2003) A novel function of tissue-type transglutaminase: protein disulphide isomerase. Biochem J 373: 793–803. - PMC - PubMed
    1. Mastroberardino PG, Farrace MG, Viti I, Pavone F, Fimia GM, et al. (2006) “Tissue” transglutaminase contributes to the formation of disulphide bridges in proteins of mitochondrial respiratory complexes. Biochim Biophys Acta 1757: 1357–1365. - PubMed

Publication types

MeSH terms