. 2014 Jun 23;9(6):e100924.
doi: 10.1371/journal.pone.0100924. eCollection 2014.

Large-scale East-Asian eQTL mapping reveals novel candidate genes for LD mapping and the genomic landscape of transcriptional effects of sequence variants

Affiliations

Large-scale East-Asian eQTL mapping reveals novel candidate genes for LD mapping and the genomic landscape of transcriptional effects of sequence variants

Maiko Narahara et al. PLoS One. .

Abstract

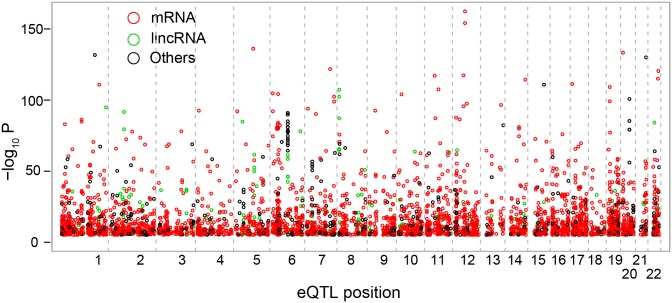
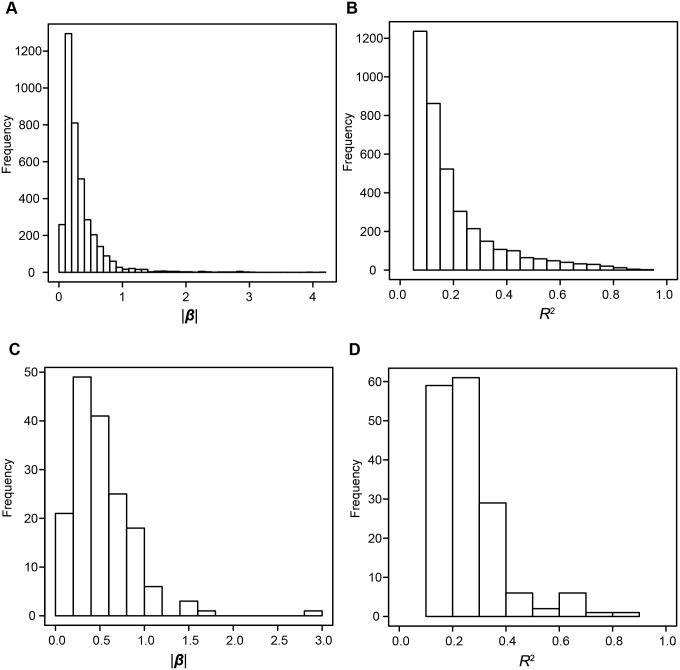
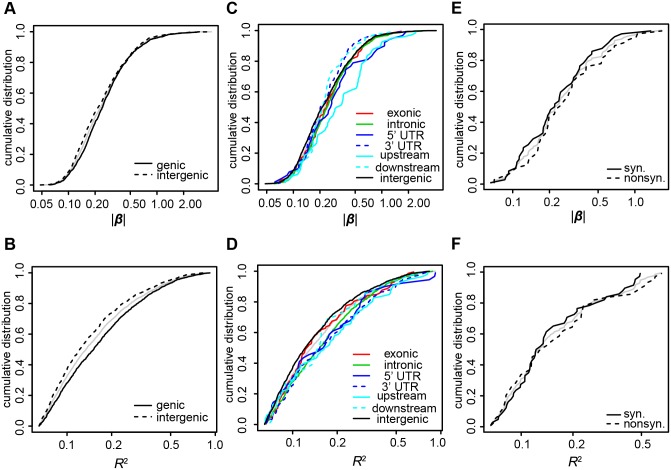
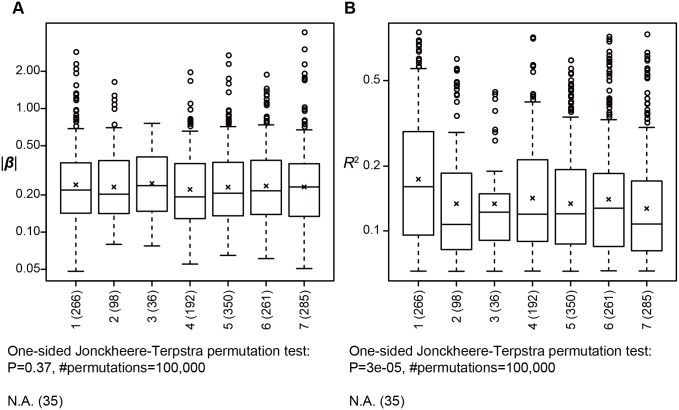
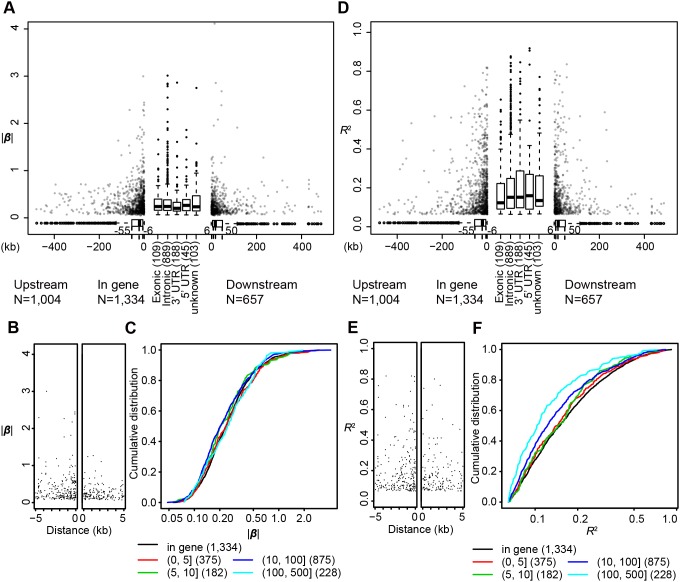
Profiles of sequence variants that influence gene transcription are very important for understanding mechanisms that affect phenotypic variation and disease susceptibility. Using genotypes at 1.4 million SNPs and a comprehensive transcriptional profile of 15,454 coding genes and 6,113 lincRNA genes obtained from peripheral blood cells of 298 Japanese individuals, we mapped expression quantitative trait loci (eQTLs). We identified 3,804 cis-eQTLs (within 500 kb from target genes) and 165 trans-eQTLs (>500 kb away or on different chromosomes). Cis-eQTLs were often located in transcribed or adjacent regions of genes; among these regions, 5' untranslated regions and 5' flanking regions had the largest effects. Epigenetic evidence for regulatory potential accumulated in public databases explained the magnitude of the effects of our eQTLs. Cis-eQTLs were often located near the respective target genes, if not within genes. Large effect sizes were observed with eQTLs near target genes, and effect sizes were obviously attenuated as the eQTL distance from the gene increased. Using a very stringent significance threshold, we identified 165 large-effect trans-eQTLs. We used our eQTL map to assess 8,069 disease-associated SNPs identified in 1,436 genome-wide association studies (GWAS). We identified genes that might be truly causative, but GWAS might have failed to identify for 148 out of the GWAS-identified SNPs; for example, TUFM (P = 3.3E-48) was identified for inflammatory bowel disease (early onset); ZFP90 (P = 4.4E-34) for ulcerative colitis; and IDUA (P = 2.2E-11) for Parkinson's disease. We identified four genes (P<2.0E-14) that might be related to three diseases and two hematological traits; each expression is regulated by trans-eQTLs on a different chromosome than the gene.


Conflict of interest statement

Competing Interests: The authors have the following interests: Co-authors Seiji Nakamura, Miho Ishii and Kenichi Matsubara are employed by the DNA Chip Research Inc. The affiliation to this company does not alter the authors' adherence to PLOS ONE policies on sharing data and materials.

Figures

Figure 1
Figure 1. Cis-eQTL map.
–log10 P values of cis-eQTLs are plotted against the respective chromosomal positions. eQTLs for mRNA transcripts are shown in red; lincRNA transcripts are shown in green; and other transcripts are shown in black. The vertical dashed lines separate chromosomes.
Figure 2
Figure 2. Histograms of effects of eQTLs.
A, B) Histograms of |β| values (A) and of R 2 values (B) of cis-eQTLs are shown. C, D) Histograms of |β| values (C) and R 2 values (D) of trans-eQTLs are shown.
Figure 3
Figure 3. Cumulative curves of effect magnitudes of cis-eQTLs in gene-structure-based functional categories.
Cumulative curves represent the distributions of |β| values or R 2 values of cis-eQTLs in each category. Cumulative distribution of all cis-eQTLs (A–D) or all exonic cis-eQTLs (E–F) are shown in grey. The X axis is a log scale. A, B) Distributions of genic and intergenic cis-eQTLs for |β| values (A) or for R 2 values (B). C, D) Distributions of genic subcategories and intergenics for |β| values (C) or for R 2 values (D). E, F) Distributions of nonsynonymous and synonymous eQTLs for |β| values (E) and for R 2 values (F).
Figure 4
Figure 4. Trend in effects associated with regulatory classes of intergenic cis-eQTLs.
The box-and-whisker plots show distributions of |β| values (A) or of R 2 values (B) of intergenic cis-eQTLs that affect mRNA transcripts for regulatory classes defined by the RegulomeDB. A cross indicates the mean effect of each class. The number of cis-eQTLs belonging to each class is shown in the parentheses following the class name. Jonckheere-Terpstra permutation test was used to test each trend, and the results are shown under the box-and-whisker plots. N.A.: not available.
Figure 5
Figure 5. Relationships between effects of cis-eQTLs and distance from genes.
|β| values (A) and R 2 values (D) of cis-eQTLs that affect mRNA transcripts are plotted against distances from the respective target genes by scatter (non-transcribed regions) and by box-and-whisker plots (transcribed regions). eQTLs in transcribed regions are shown for each gene-structure-based category. The number following each category name represents the number of cis-eQTLs classified into that category. Negative distance values indicate that the eQTL is upstream of the target gene, and positive values indicate that it is downstream, regarding transcriptional directions. Distributions of distances are represented by box-and-whisker plots below the scatters. Magnified view for <5 kb of genes is shown for |β| (B) and R 2 (E). Cumulative distribution of |β| (C) and R 2 (F) of eQTLs are shown for each division of eQTLs; each division represent a defined distance (kb) from the respective target gene. The number in the parentheses following each distance range in the legend is the number of cis-eQTLs identified in that range. The X-axis is a log scale. One eQTL located within a gene (C16orf55) that was assigned function of “downstream” is shown as “unknown”; therefore, the number of “In gene” eQTLs shown in (A) and (D) is the sum of the numbers of Exonic, Splicing, Intronic, 5′ UTR, 3′ UTR, and N.A. in Table 2 plus 1.

References

    1. Göring HHH, Curran JE, Johnson MP, Dyer TD, Charlesworth J, et al. (2007) Discovery of expression QTLs using large-scale transcriptional profiling in human lymphocytes. Nat Genet 39: 1208–1216. - PubMed
    1. Morley M, Molony CM, Weber TM, Devlin JL, Ewens KG, et al. (2004) Genetic analysis of genome-wide variation in human gene expression. Nature 430: 743–747. - PMC - PubMed
    1. Dixon AL, Liang L, Moffatt MF, Chen W, Heath S, et al. (2007) A genome-wide association study of global gene expression. Nat Genet 39: 1202–1207. - PubMed
    1. Cheung VG, Spielman RS, Ewens KG, Weber TM, Morley M, et al. (2005) Mapping determinants of human gene expression by regional and genome-wide association. Nature 437: 1365–1369. - PMC - PubMed
    1. Stranger BE, Forrest MS, Clark AG, Minichiello MJ, Deutsch S, et al. (2005) Genome-wide associations of gene expression variation in humans. PLoS Genet 1: e78. - PMC - PubMed

Publication types

MeSH terms

Substances