. 2014 Jun 23;9(6):e100839.
doi: 10.1371/journal.pone.0100839. eCollection 2014.

Tissue-specific expressed antibody variable gene repertoires

Affiliations

Tissue-specific expressed antibody variable gene repertoires

Bryan S Briney et al. PLoS One. .

Erratum in

Abstract

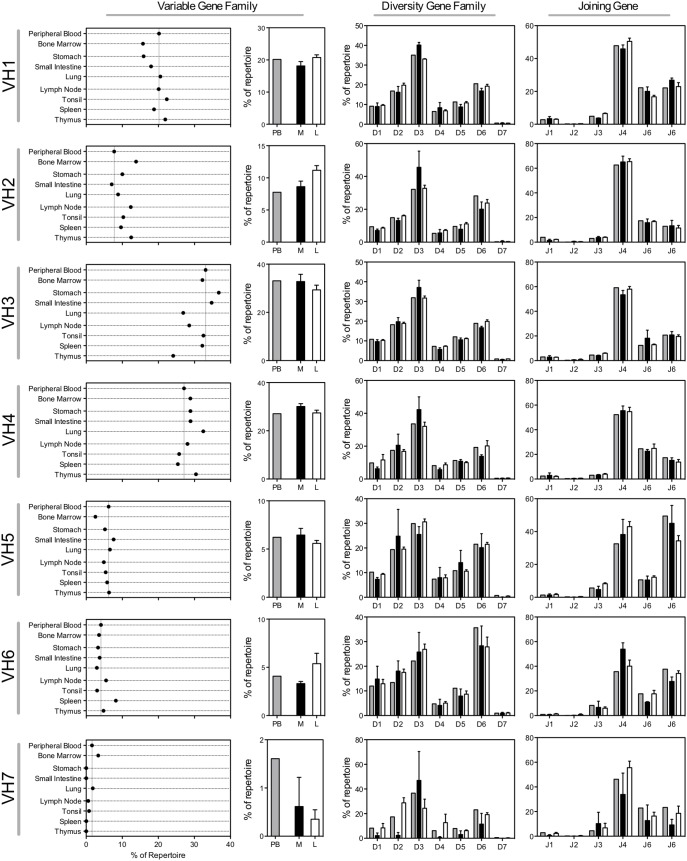
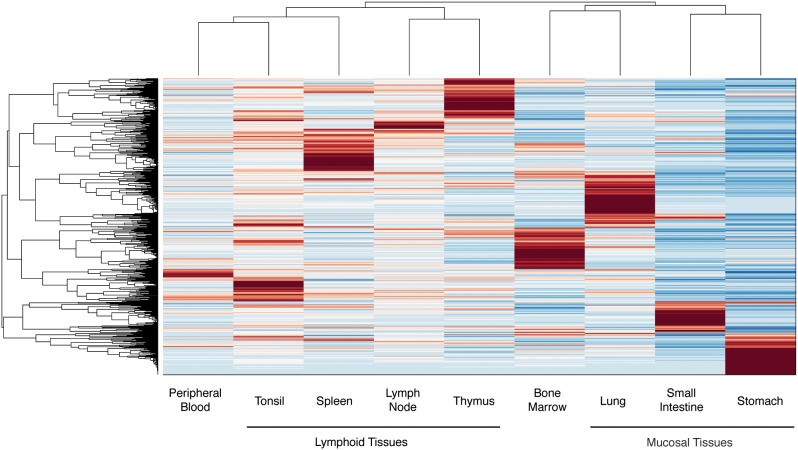
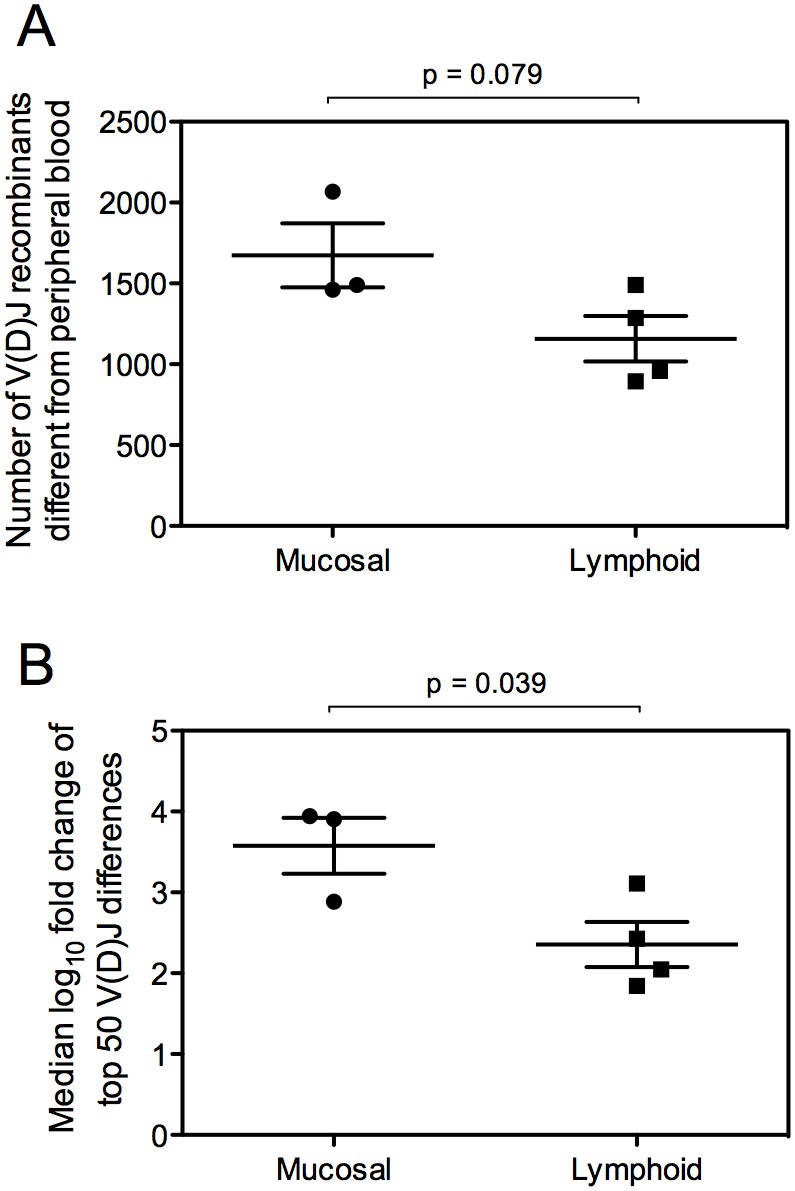
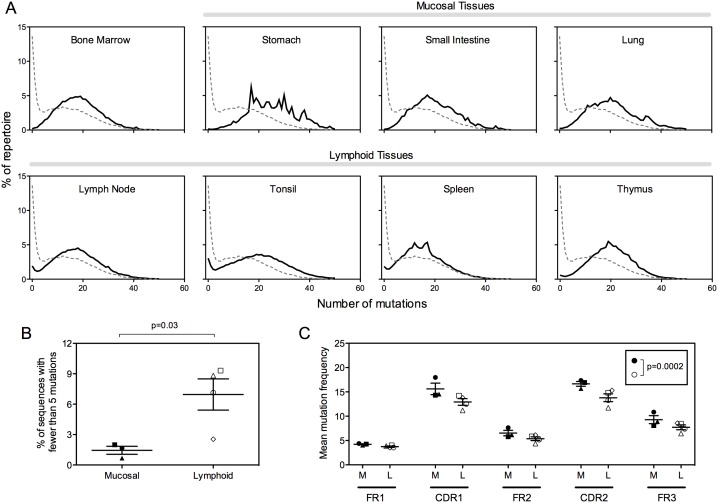
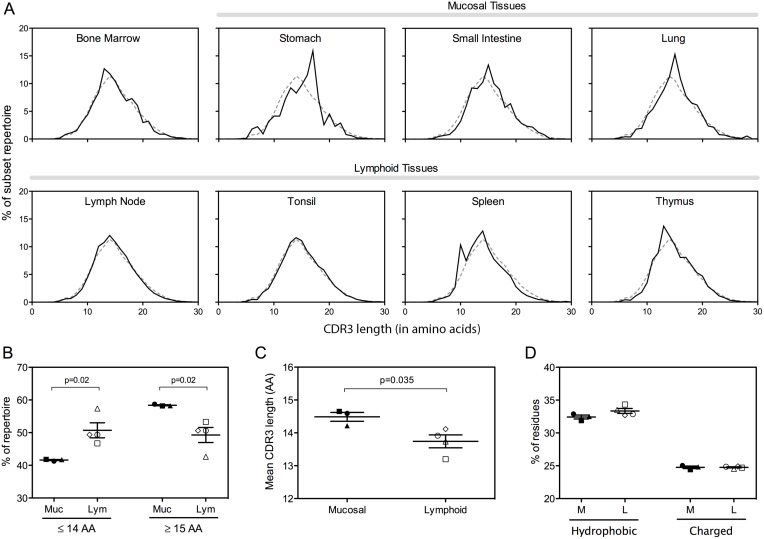
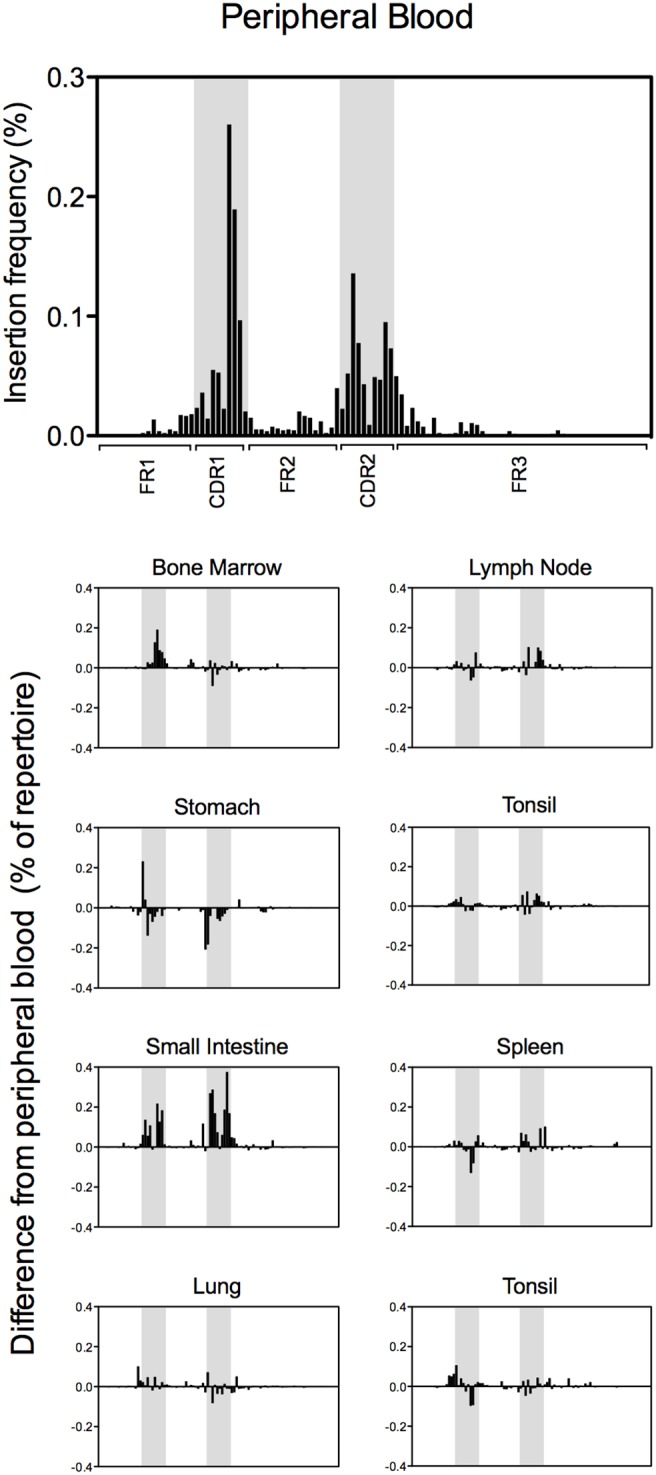
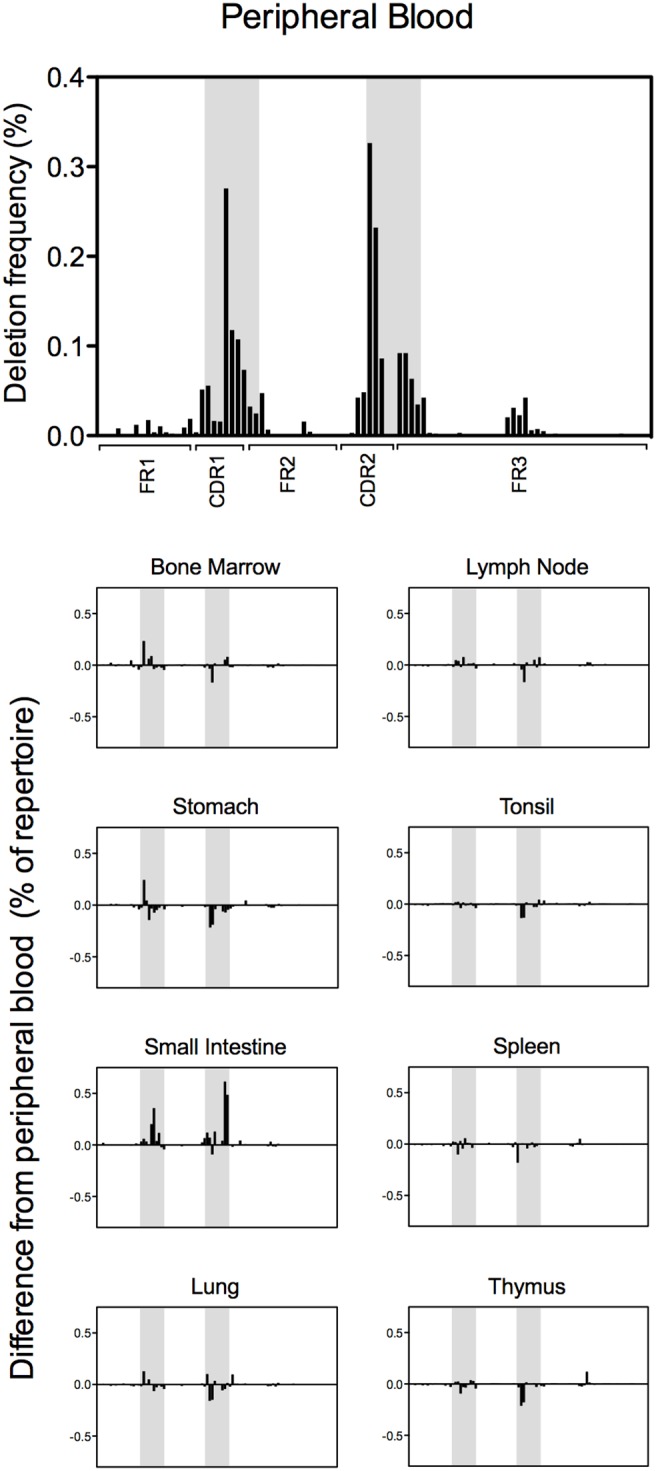
Recent developments in genetic technologies allow deep analysis of the sequence diversity of immune repertoires, but little work has been reported on the architecture of immune repertoires in mucosal tissues. Antibodies are the key to prevention of infections at the mucosal surface, but it is currently unclear whether the B cell repertoire at mucosal surfaces reflects the dominant antibodies found in the systemic compartment or whether mucosal tissues harbor unique repertoires. We examined the expressed antibody variable gene repertoires from 10 different human tissues using RNA samples derived from a large number of individuals. The results revealed that mucosal tissues such as stomach, intestine and lung possess unique antibody gene repertoires that differed substantially from those found in lymphoid tissues or peripheral blood. Mutation frequency analysis of mucosal tissue repertoires revealed that they were highly mutated, with little evidence for the presence of naïve B cells, in contrast to blood. Mucosal tissue repertoires possessed longer heavy chain complementarity determining region 3 loops than lymphoid tissue repertoires. We also noted a large increase in frequency of both insertions and deletions in the small intestine antibody repertoire. These data suggest that mucosal immune repertoires are distinct in many ways from the systemic compartment.


Conflict of interest statement

Competing Interests: The authors have declared that no competing interests exist.

Figures

Figure 1
Figure 1. Germline gene family use.
Starting from the left, the first column of panels shows the variable gene family use in peripheral blood, bone marrow, mucosal tissues (lung, small intestine, stomach) and lymphoid tissues (lymph node, tonsil, spleen and thymus). For easier comparison, the dashed vertical line in each panel represents the peripheral blood frequency. The second column of panels shows the variable gene use of peripheral blood and the combined variable gene family use of mucosal or lymphoid tissues. Bars indicate mean ± SEM for each group of tissue samples. The third column of panels shows the diversity gene family use in peripheral blood (grey bars), mucosal tissues (black bars) and lymphoid tissues (white bars). Bars indicate mean ± SEM for each group of tissue samples. The final column of panels shows the joining gene use. Colors are the same as the diversity gene family frequency panels. Bars indicate mean ± SEM for each group of tissue samples.
Figure 2
Figure 2. Clustergram of antibody gene repertoires.
The frequency of each VH(D)JH recombination was determined for each of nine tissues, and a clustergram was created. VH(D)JH recombinants were clustered by relative frequency in each tissue-specific repertoire, and the resulting phylogenetic tree is shown on the left. Tissue-specific repertoires were clustered by the overall VH(D)JH usage of each repertoire, and the resulting clustering diagram is shown at the top. The frequency variation for each VH(D)JH recombination across all tissue-specific repertoires was determined, and standardized to a range of −3 to 3. A complete list of the frequency variation of all VH(D)JH recombinants for each tissue-specific repertoire, along with statistical significance and false discovery rate (FDR) calculations, is available in File S1 (see eight files, each named Suppl Info_PB_vs_tissue).
Figure 3
Figure 3. Comparison of VH(D)JH use in lymphoid or mucosal tissues to that in peripheral blood.
(A) The frequency of each VH(D)JH recombination was calculated for each tissue and compared to peripheral blood. The number of VH(D)JH recombinants for which the frequency differed significantly from peripheral blood was calculated for each tissue (statistical false discovery rate (FDR) calculations are available in File S1 [see eight files, each named Suppl Info_PB_vs_tissue]). The number of statistically different VH(D)JH combinations is shown for each mucosal (lung, small intestine, stomach) and lymphoid (lymph node, tonsil, spleen and thymus) tissue. (B) The frequency of each VH(D)JH recombination was determined for each tissue and compared to peripheral blood. The fold change of the 50 most different VH(D)JH recombinations is shown in log10 scale for each tissue.
Figure 4
Figure 4. Mutation frequency for peripheral blood, bone marrow and mucosal and lymphoid tissues.
(A) Mutation histograms are shown for each sample. Each of the three mucosal tissue samples (small intestine, stomach and lung) shows a complete loss of un-mutated sequences, which constitute a large portion of the peripheral blood repertoire. Repertoires for each of the lymphoid tissues (lymph node, tonsil, spleen and thymus) contained antibody genes with few or no mutations, but at a lower frequency than peripheral blood. For ease of comparison, the mutation distribution for peripheral blood is shown as a dashed line in each tissue plot. (B) The frequency of sequences with fewer than 5 mutations was determined for each mucosal and lymphoid tissue sample. For mucosal samples, lung, small intestine or stomach samples are plotted as filled circles, squares or triangles, respectively. For lymphoid samples, lymph node, spleen, thymus or tonsil are plotted as open circles, squares, triangles and diamonds, respectively. (C) The mean mutation frequency is shown for each genetic region of the variable gene: Framework Regions 1, 2 and 3 (FR1, FR2, FR3) and Complementarity Determining Regions 1 and 2 (CDR1, CDR2). Bars indicate mean ± SEM for each group of tissue samples. Sample glyphs are as in (B).
Figure 5
Figure 5. Mucosal tissue antibody gene repertoires encode longer CDR3s and are more mutated than lymphoid tissue repertoires.
(A) Heavy chain CDR3 length histograms for each tissue sample. For ease of comparison, the CDR3 length distribution for peripheral blood is shown as a dashed line in each tissue plot. (B) Frequency of sequences containing short (14AA or shorter) or long (15AA or longer) CDR3s. Bars indicate mean ± SEM for each group of samples. (C) The mean CDR3 length was determined for each tissue-specific repertoire. Bars indicate mean ± SEM for each group of samples. For mucosal samples, lung, small intestine or stomach samples are plotted as filled circles, squares and triangles, respectively. For lymphoid samples, lymph node, spleen, thymus and tonsil or plotted as open circles, squares, triangles and diamonds, respectively. (D) Frequency of hydrophobic and charged CDR3 residues. Bars indicate mean ± SEM for each group of samples. Samples glyphs are as in (C).
Figure 6
Figure 6. Frequency and position of DNA fragments encoding non-frameshift insertions.
(A) The presence and frequency of non-frameshift insertions is shown for the peripheral blood repertoire. The frequency is plotted as the percent of sequences in the repertoire displaying deletions for each codon position in the variable gene. The location of CDR1 and CDR2 are highlighted in grey. (B) The difference in insertion frequency compared to peripheral blood is shown for each tissue. As in (A), CDR1 and CDR2 are highlighted in grey.
Figure 7
Figure 7. Frequency and position of DNA fragments encoding non-frameshift deletions.
(A) The presence and frequency of non-frameshift deletions is shown for the peripheral blood subset. The frequency is plotted as the percent of sequences in the repertoire displaying deletions for each codon position in the variable gene. The location of CDR1 and CDR2 are highlighted in grey. (B) The difference in deletion frequency when compared to that in peripheral blood is shown for each tissue. As in (A), CDR1 and CDR2 are highlighted in grey.

Similar articles

Cited by

References

    1. Tonegawa S (1983) Somatic generation of antibody diversity. Nature 302: 575–581. - PubMed
    1. Schatz DG (2004) V(D)J recombination. Immunol Rev 200: 5–11 10.1111/j.0105-2896.2004.00173.x - DOI - PubMed
    1. Alt FW, Oltz EM, Young F, Gorman J, Taccioli G, et al. (1992) VDJ recombination. Immunology Today 13: 306–314. - PubMed
    1. Neuberger MS (2008) Antibody diversification by somatic mutation: from Burnet onwards. Immunol Cell Biol 86: 124–132 10.1038/sj.icb.7100160 - DOI - PubMed
    1. Milstein C, Neuberger M (1996) Maturation of the immune response. Adv Protein Chem 49: 451–485. - PubMed

Publication types

MeSH terms